


This section describes some remarkable projects to study relatively small ultra-deep areas - the deep fields (see the lower right corner in Fig. 2a). I will restrict myself to works carried out in the last ten years. Earlier papers are referenced in reviews by Koo and Kron [46], Sandage [47], and Ellis [48].
The WHDF (William Herschel Deep Field) is the deepest
ground-based image of a small area taken with a middle-class
telescope. The 7' × 7' patch of sky centered on
 (2000) =
00h22m33s and
(2000) =
00h22m33s and
 (2000) = +00°21'
was imaged in 1994-1997 with the 4.2-m William Herschel telescope (the
Roque de Los Muchachos Observatory, Spain)
[49].
Several dozen thousand CCD-frames were obtained in each of four
filters (U, B, R, and I) with the respective
total exposure time 34, 28, 8, and 5 h. A careful processing and
summing-up of frames enabled reaching the
B
(2000) = +00°21'
was imaged in 1994-1997 with the 4.2-m William Herschel telescope (the
Roque de Los Muchachos Observatory, Spain)
[49].
Several dozen thousand CCD-frames were obtained in each of four
filters (U, B, R, and I) with the respective
total exposure time 34, 28, 8, and 5 h. A careful processing and
summing-up of frames enabled reaching the
B  28m limiting magnitude
for unresolved objects. The number of galaxies discovered in the
WHDF is around six thousand. This field was later
imaged in the IR bands by other telescopes.
28m limiting magnitude
for unresolved objects. The number of galaxies discovered in the
WHDF is around six thousand. This field was later
imaged in the IR bands by other telescopes.
The results of the WHDF studies have been used to analyze the dependence of the number of galaxies on their apparent magnitude (this provides information on the early cosmological evolution of galaxies), to determine the surface (angular) correlation function of galaxies, and to select the most distant objects by using color indices (see Section 2) [49, 50].
The deep fields of the HST [their standard names are the Hubble Deep Field North (HDF-N) and Hubble Deep Field South (HDF-S)] are likely to be the most well-studied patches of the sky. Their exploration has led to some important discoveries on the structure and evolution of distant galaxies [51].
Observations with the HST (the diameter of the main
mirror is 2.4 m, the Ritchey ± Chretien system) in the first half
of the 1990s demonstrated that this instrument resolves the
structure of distant galaxies and these galaxies look different
than those at z
0. The idea emerged
to use some free time at the discretion of the STScI director (at that
time, Robert Williams) to obtain an unprecedented deep image of one
typical area at high galactic latitudes
[52].
The area was very
carefully selected: the interstellar absorption in the Milky
Way in its direction had to be small, the area should not have
had very bright (in all spectral bands) objects, no relatively
close galaxy clusters should have been present, etc. As a
result, a region of the sky in Ursa Major was selected.
Observations of this northern area (HDF-N) were carried out in December 1995 with the WFPC-2 (Wide-Field Planetary Camera 2) in four broadband filters centered on 3000 Å (filter F300W), 4500 Å (F450W), 6060 Å (F606W), and 8140 Å (F814W). From fifty to a hundred individual frames were taken, with each frame being taken at a slightly displaced position of the telescope (such that one object fell onto different elements of the CCD matrix). Such a dithering technique allowed obviating the detector's defects and constructing integral deep field images with the step 0.04", which is smaller than the matrix pixel size. The HDF-N covers about 5.3 sq. min., and the field has a nonrectangular shape. The total exposure time in each filter amounted to one to almost two days. The HDF-N was later observed in the near IR bands.
In mid-January of 1996, immediately after primary data
processing, the deep field images were open to access through
the STScI web-pages
(http://www.stsci.edu/ftp/science/hdf/hdf.html).
In addition to original images, this site provides a
detailed description of observations, their processing, and
calibration. It turned out that in the HDF-N, one can detect
galaxies as faint as B ~ 29m. Depending on the selection
criteria, up to 2000-3000 galaxies in this field can be
discovered (for comparison, only several dozen stars of our
Galaxy were found). The main feature of the HST deep field
is, of course, a much better resolution
( 0.1") than can be
achieved by ground-based observations. Such an angular
resolution enables one to study the observed structure of
distant (z  1)
galaxies with the linear resolution
1)
galaxies with the linear resolution
 1 kpc.
The principal shortcoming of the field is its small angular size
(at z = 1, it corresponds to only
2 Mpc in the comoving
frame), and therefore the statistics of objects in the field are
not representative.
1 kpc.
The principal shortcoming of the field is its small angular size
(at z = 1, it corresponds to only
2 Mpc in the comoving
frame), and therefore the statistics of objects in the field are
not representative.
The first reproductions of the HDF-N (see, e.g.,
Fig. 6)
clearly demonstrated that the Universe looked differently
several billion years ago. Distant galaxies are much more
asymmetric, and there are numerous interacting and irregular
systems. The Hubble field provided very rich data enabling
the exploration of the morphology and sizes of galaxies, deep
galaxy counts, searches for extremely distant objects
(z 5), etc.
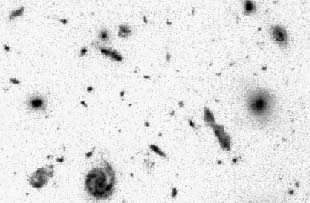 |
Figure 6. A fragment (~ 20" × 30") of the HDF-N. |
The obvious success of the HDF-N stimulated carrying out an analogous project in the southern hemisphere [53]. Observations of the southern area (located in the Tucanus constellation) were carried out in October 1998. The HDF-S project has two important differences from the HDF-N: a remote quasar with z = 2.24 falls within this field and several instruments are simultaneously used. The following results were obtained: (1) a deep image of the field was obtained with the WFPC-2 (with the same filters and using the same methods as in the HDF-N), (2) the spectroscopy of the quasar in the spectral range 1150 to 3560 Å was made, an ultradeep image of a small area near the quasar was taken with the STIS (Space Telescope Imaging Spectrograph), and (3) a small area was imaged with the NICMOS (Near Infrared Camera and Multi-Object Spectrometer) at 1.1 µm, 1.6 µm, and 2.2 µm. All three instruments have different fields of view, and therefore the instrumental field must be specified in referencing the HDF-S. As in the case of the HDF-N, completely reduced observations of this field were open to access at the end of November 1998 (see http://www.stsci.edu/ftp/science/hdfsouth/hdfs.html).
The policy of providing open access to the data, as well as their uniqueness (both fields had been the deepest `punctures' into the Universe in several years), ensured that they were enormously popular and in demand. Both HDF areas were observed many times from the ground and from space and in all other spectral ranges, from X-ray to radio. According to ADS, at the beginning of 2005, the data of these fields were used in at least fifteen hundred papers.
The Chandra Deep Fields represent a series of deep (exposure ~ 10-20 days) images of small patches of the sky obtained by the space Chandra X-ray Observatory (CXO). The best known of them are the North field (CDF-N) and South field (CDF-S). Observations of the CDF-S in the constellation Fornax were carried out in 1999-2000. The total exposure time was around 106 s. The CDF-S covered 0.109 sq. deg. with the pixel size 1". In the Southern Chandra field, 346 sources were discovered in the energy range 0.5-7 keV [54, 55]. Most of these sources are extragalactic objects, mainly active galactic nuclei and star-forming galaxies.
The CDF-N was the deepest X-ray image of the sky area obtained by the beginning of 2005. The field covers 0.124 sq. deg. with the total exposure time approaching 2 × 10⁶ s. The coordinates of the Northern Chandra field are close to those of the HDF-N (see Section 2.4), but the area of the CDF-N is many times larger than HDF-N (Fig. 7). In the CDF-N, about 600 X-ray sources in the energy range 0.5-8 keV were discovered [56, 57]. Twenty of these sources lie within the HDF-N (Fig. 7).
 |
Figure 7. The distribution of X-ray sources within the CDF-N (the boundaries of this field are shown by the dotted line). The white circles show sources detected with a 106 s exposure, the black circles stand for fainter sources that appeared when increasing the exposure time to 2 × 10⁶ s. The small polygon in the center marks the HDF-N field. |
Spectroscopic studies of optical counterparts of the CDF-S and CDF-N X-ray sources revealed that they lie at z ~ 1, with some sources having z > 3 (see, e.g., [57]). For the first time, the CDF data enabled evaluating the evolution of the X-ray luminosity of active galactic nuclei as a function of z and investigating X-ray properties of normal galaxies at large redshifts [58].
The FORS Deep Field is devoted to a detailed photometric and spectroscopic study of a ~ 7' × 7' area located in the vicinity of the south galactic pole with the FOcal Reducer/low dispersion Spectrograph (FORS) on the 8.2-m ESO VLT telescope [59]. The main photometric observations were carried out in 1999-2000 with the UT1 (Antu) ESO VLT telescope with five broadband filters spanning the spectral range from ~ 3700 to ~ 8000 Å. With each filter, several dozen images were taken, and more than a hundred were obtained with the R filter. The total exposure time varied from 6 to 12 h depending on the color band. The image quality in the integral image is better than 1" in each filter. Near-IR observations (J and K filters) of the field were also carried out by the ESO NTT telescope.
A careful analysis of the FDF images allowed discovering almost 10,000 objects, mostly galaxies (only 50 stars are seen in the field). The limiting magnitude in the FORS field with filter B turns out to be comparable with that in the HDF (see Section 4.2), and is smaller than the HDF only by ~ 1m with the other filters. The ESO NTT telescope has started a spectral survey of the FDF objects. By the present time, redshifts for several hundred galaxies from this field have been reported (see e.g., [60]).
Additional observations of the FDF and data analysis continue. Some preliminary results on the physical properties of distant (z > 3) galaxies, their luminosity function evolution, the history of star formation in the Universe, etc., are reported in [61].
The main goal of the Japanese project Subaru Deep Field (SDF) is to select and study a large sample of distant (z > 4) galaxies. Since 1999, the Japanese Subaru (Pleiades) telescope has been carrying out multicolor photometric and spectral observations of a 34' × 27' area near the north galactic pole. Photometric data were obtained in five broadband (B, V, R, i') and two narrowband filters in the near-IR wavelength range centered on 8150 Å and 9196 Å [62]. The central 2' × 2' part of the SDF was also observed in J and K bands [63]. The total exposure time in each band was approximately 10 h with the limiting magnitudes near 28.5m in the B filter and 23.5m in K. More than 150,000 objects (mostly galaxies) were discovered in the Subaru Deep Field. The processed SDF images and catalogs of objects are available through http://soaps.naoj.org/sdf/.
Many interesting results on the properties and distribution
of distant galaxies were obtained using the SDF. In
particular, several objects with z
6 were discovered (their
age is only several million years), including the most distant,
at the present time, spectroscopically confirmed
L-emitting object with
z = 6.60
[64].
The Subaru/XMM-Newton Deep Survey (SXDS) is a
multi-wavelength survey of a small (~ 1.3 sq. deg.) area
obtained with several ground-based and space instruments (Subaru,
UKIRT, XMM-Newton, VLA, GALEX, JCMT) (see, e.g.,
[65]).
The SXDS is centered at
(2000) =
2h18m00s,
(2000) = -
5°00'00". This survey is less deep (in terms
of the limiting magnitude) than the SDF, but has a
coverage several times larger and, in addition, allows
multi-wavelength studies of objects.
At the end of 2003, photometric observations of the
SXDS field were performed in a narrow band centered on
 =
8150 Å. Using a special method based on comparison of
the energy flux density in different spectral intervals, more
than 500 candidates in galaxies with z = 5.7 ± 0.05 were
selected
[66].
Spectral observations confirmed that most
objects must actually reside at such z. From analysis of the
space distribution of galaxies, the authors of
[66]
arrived at
the conclusion that some primordial large-scale structure of
galaxies with extended filaments, voids, and even with two
clusters under formation (see Fig. 8) must
already exist at z = 5.7 (!).
=
8150 Å. Using a special method based on comparison of
the energy flux density in different spectral intervals, more
than 500 candidates in galaxies with z = 5.7 ± 0.05 were
selected
[66].
Spectral observations confirmed that most
objects must actually reside at such z. From analysis of the
space distribution of galaxies, the authors of
[66]
arrived at
the conclusion that some primordial large-scale structure of
galaxies with extended filaments, voids, and even with two
clusters under formation (see Fig. 8) must
already exist at z = 5.7 (!).
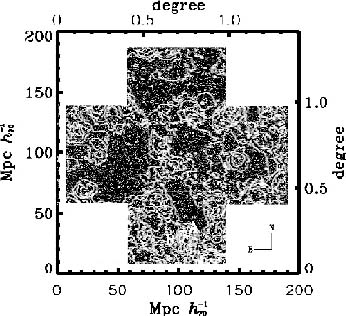 |
Figure 8. The distribution of
L |
COMBO-17 (Classifying Objects by Medium-Band Observations in
17 filters) represents a multicolor photometric survey
of five ~ 0.5° × 0.5°
areas (including the CDF-S, the south
galactic pole, and the Abell 901/902 supercluster) obtained
with the 2.2-m MPG/ESO telescope in Chile
[67,
68].
The main feature of this project is that observations were carried
out with 17 filters (five broadband - U, B, V,
R, I ,
and 12 medium-band) covering the spectral range 3500-9300 Å.
Such a detailed photometry allows constructing a kind of
low-resolution spectrum of each object, which can be used
both to spectrally classify and to evaluate the redshift of each
object with a relatively good accuracy
( z
0.03).
The relatively small depth of COMBO-17 (B
25.5
[68]),
therefore, is compensated by the large coverage, as well as by the
possibility of estimating the type and z of an object without
additional spectral observations. These advantages of
COMBO-17 make it a convenient tool to study galaxies
using the weak gravitational lensing method
[69].
z
0.03).
The relatively small depth of COMBO-17 (B
25.5
[68]),
therefore, is compensated by the large coverage, as well as by the
possibility of estimating the type and z of an object without
additional spectral observations. These advantages of
COMBO-17 make it a convenient tool to study galaxies
using the weak gravitational lensing method
[69].
The results obtained in this project for the Southern Chandra Field, including a catalog of 63,501 objects, were recently published in [70] (see also http://www.mpia.de/COMBO/combo_index.html).
In January 2004, a special issue of the Astrophysical Journal Letters was entirely devoted to preliminary results obtained in the GOODS (Great Observatories Origins Deep Survey) project [71]. The GOODS is a new-generation project after the HDF, combining deep multi-wavelength observations from several space (HDF, SIRTF, CXO, XMM-Newton) and ground-based (ESO VLT, ESO NTT, KPNO 4-m, etc.) telescopes. The scientific goals of the GOODS include estimations of stellar and dynamical masses of bright galaxies up to z ~ 5, measurements of the star formation rate in complete samples at different z, studies of the origin of the Hubble sequence, measurements of the relative contributions of stars and active galactic nuclei to the global energy budget of the Universe, and studies of individual sources contributing to intergalactic background radiation in all spectral ranges.
Observations have been carried out in two areas ~ 160 sq. min., each almost centered on the HDF-N (Section 4.2) and CDF-S (Section 4.3).
The fields were observed with the HST by the Advanced Camera for Surveys (ACS) installed in 2002 in four broad-band filters F435W (B), F606W (V), F775W (i), and F850LP (z) (the three figures in the filter's name indicate the central wavelength in nm). As with the HDFs, dozens of dithered exposures are taken with each filter. Observations in V, i, and z were carried out during five periods delayed by 40-50 days. (Such an observational strategy was adopted to facilitate searches for distant `cosmological' supernovae. As a result, more than 40 supernovae were discovered by the GOODS, with six SN Ia's at z > 1.25 [72].)
After initial reductions and the superposition of individual
frames, integral images of the fields in all filters were
obtained with the step 0.''03 (the actual angular resolution in
the images is
0.1"). The limiting magnitude of extended objects in these fields
is by 0.5m - 0.8m worse
than in the previous HST deep fields, but the total coverage
of the GOODS is 30 times larger than that of the HDF-N
and HDF-S taken together. The original HST frames and
reduced images are available through the web pages of the
GOODS project: http://www.stsci.edu/science/goods/.
Observations in the framework of the GOODS project with other telescopes (including, in particular, Keck and Gemini) either have already been made or are being carried out. See paper [71] or the project web page for details.
The Hubble Ultra Deep Field (HUDF) is the deepest optical imaging of a patch of the sky ever made (Fig. 9). The authors of the project believe it will remain such in the next several years and, consequently, this field will long remain the main source of information on the most distant objects in the Universe [73].
 |
Figure 9. Detail ~ 50" × 55" of the HUDF. |
The HUDF is located within the limits of the Southern
Chandra Field (CDF-S) and, hence, within the GOODS field.
The precise coordinates of the HUDF are
(2000) =
3h32m39.0s and
(2000) =
-27°47'29.1".
Major observations were carried out by the HST from September 2003 till
January 2004 with a wide-field camera (WFC) ACS with the
same four filters as the GOODS observations. The field
coverage is relatively small: 11.5 sq. min. More than a hundred
individual images were taken in the B and V filters
with the total exposure time ~ 40h.
Observations in the i and z bands include almost 300
frames with the total exposure time ~ 100h with each filter.
The final calibrated HUDF images with the step 0.03" (the image size with each filter is 430 Mb) and the catalog of discovered objects can be found on the web page of the project: http://www.stsci.edu/hst/udf. The HUDF is by about one magnitude deeper than the HDF. In this field, around 10,000 galaxies up to B ~ 30m (~ 5 × 10⁻⁹ Jy!) were discovered.
To improve the impact of the ACS data, the central part
of the HUDF was also observed by the HST with the
NICMOS (Near-Infrared Camera and Multi-Object Spectrometer) with
filters F110W (J) and F160W (H). An
unprecedented depth was also attained in these observations:
the limiting apparent magnitudes in the J and H bands
are 27.5m
(~ 1.5 × 10⁻⁸ Jy)
[74].
Such high-quality data in
the near-IR spectral range make the HUDF an extremely
valuable field for selecting and studying the most distant
objects. The first analysis of the HUDF allowed discovering
galaxy candidates at z ~ 7-8 (see, e.g.,
[74]).
In parallel with the main observations, the HUDF field has been studied with other HST instruments: the STIS (Space Telescope Imaging Spectrograph) and the WFPC-2 (Wide-Field Planetary Camera 2). These observations and results are summarized on the STScI site: http://www.stsci.edu/hst/udf.
Above, we have briefly described typical or unique projects. This list of notable deep field projects is far from being complete, but it is impossible to describe all of them. For completeness, below I briefly enumerate several other interesting projects.
The LCRS (Las Campanas Redshift Survey) is a spectroscopic survey of ~ 2600 galaxies with the 2.5-m telescope of the Las Campanas observatory (Chile) [75]. The survey covers about 700 sq. deg. and consists of six extended patches 1.5° × 80° each.
The NDF (NTT Deep Field) represents a deep (B
27.5m)
photometry of a small (~ 5 sq. min.) area with the 3.6-m ESO NTT telescope
[76].
The CNOC2 (Canadian Network for Observational
Cosmology) is a survey covering ~ 1.5 sq. deg.
of the sky with the 3.6-m CFHT telescope
[77].
The survey is aimed at
determining redshifts for ~ 6000 galaxies with the apparent
magnitude R
21.5m and providing multicolor photometry for
~ 40,000 galaxies with R
23m.
The MUNICS (Munich Near-Infrared Cluster Survey)
represents a photometric and spectroscopic study of several
thousand galaxies with K
19.5m within
several areas with the total coverage ~ 1 sq. deg.
[78]
The photometry was obtained
with the 2.2-m and 3.5-m telescopes of the Calar Alto
observatory (Spain). The Hobbey-Eberly (9.2-m, USA) and
ESO-VLT telescopes were also used for spectral observations.
K20 is a spectroscopic survey of a complete sample of galaxies with the apparent magnitude K < 20m (around 550 objects) within two fields covering ~ 52 sq. min. with the ESO VLT telescope [79].
The DEEP2 (Deep Extragalactic Evolutionary Probe 2) is a spectroscopic survey covering ~ 3.5 sq. deg. of the sky with a multi-object spectrograph on the 10-m Keck-II telescope [80]. Redshifts for ~ 60,000 remote (z > 0.7) galaxies will be measured.
GEMS (Galaxy Evolution from Morphologies and SEDs) represents the largest (~ 28' × 28') image obtained up to the present time with the Hubble Space Telescope [81]. The field was observed with two filters (F606W and F850LP). The integrated image represents a mosaic from about 60 WFC ACS fields. The GEMS field is centered on the CDF-S and includes the GOODS field. The size and location of GEMS are almost identical to the COMBO-17. The GEMS data allow the study of the structure and morphology of ~ 10,000 galaxies.
The VVDS (VIMOS-VLT Deep Survey) is a photometric and spectroscopic survey of ~ 100,000 galaxies within several deep fields covering ~ 16 sq. deg. with the VIsible Multi-Object Spectrograph (VIMOS) on the ESO VLT telescope [82, 83].
The OACDF (Capodimonte Deep Field) is a multi-color (9 color bands) photometric survey of ~ 50,000 galaxies within a ~ 0.5 sq. deg. field with the ESO/MPG 2.2-m telescope [84].
The NDWFS (NOAO Deep Wide-Field Survey) is a deep optical and near-infrared imaging survey covering two 9.3 sq. deg. fields with the KPNO and CTIO telescopes (http://www.noao.edu/noao/noaodeep/).
COSMOS is an HST Treasury project to perform a survey using the ACS in a single filter (F814W) in a contiguous 2 sq. deg. equatorial field (http://cosmos.astro.caltech.edu). The selection of an equatorial field has allowed observatories in both hemispheres to join efforts for the extensive follow-up multi-wavelength observations.
This list is of course incomplete. In particular, there are many purely spectroscopic galaxy surveys in small fields, which are referenced in papers cited above.
The description of the projects shows that virtually all the
largest ground-based telescopes are participating in deep field
studies and surveys. The largest Russian 6-m telescope of
SAO RAN (BTA) is no exception. Shortly after its construction (1976),
deep galaxy counts near the north galactic pole
were carried out with this instrument
[85].
These counts (the
black box in Fig. 2 a,b) were
followed up to B
26m, which
was one of the best results at that time.
The possibilities of the BTA are well illustrated by paper
[86]
reporting the results of four-color photometry of a small
(3.'6 × 3' ) field centered at the gamma-ray burst GRB 000926.
Around 300 objects with B
26.6m were found in
this field (the black circle in
Figs 2 a,b). Both differential
galaxy counts and their general characteristics turned out to
be in agreement with the results of other deep fields. An
analysis of images of bright (M(B) < -18m,
where M(B) is
the absolute magnitude in filter B) spiral galaxies led to
the conclusion that there is no strong evolution of their linear
sizes at z 1
(Fig. 10,
[86]).
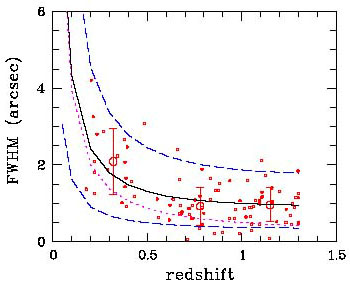 |
Figure 10. The angular size of bright
galaxies as a function of z (red points).
The circles with bars show the mean values and corresponding dispersions
for three intervals of z. The dashed lines are the lines of
constant linear sizes (the bottom and upper lines correspond to the
respective
linear sizes 3 kpc and 15 kpc). The solid line shows the dependence
of the linear size on z for a galaxy with FWHM = 8 kpc (FWHM is
the full width at the half-maximum brightness). The dotted line shows the
expected change in the angular size of a galaxy according to the
law |
 (1 +
z)-1 as predicted by some models.
(1 +
z)-1 as predicted by some models.