


The local luminosity function (LLF) describes the local space density of sources as a function of luminosity: it constitutes an important boundary condition for evolutionary models. Its determination is complicated by several factors discussed e.g. by Toffolatti et al. (1987). Ideally we would like to have a large, complete radio-selected sample of sources, all with redshift measurements, all at low enough redshifts for evolutionary effects to be insignificant, yet distant enough for the redshifts to be accurate distant estimators. The sources should be distributed over large enough volumes for clustering effects to average away.
In practice, however, the well-known fact that the redshift distribution of complete samples of radio sources peaks at z ~ 1 for all flux-density levels down to ~ 10 mJy, implies that local sources are swamped by the much more numerous distant ones. Singling them out by means of complete redshift measurements is therefore impractical, and we must confine ourselves to those brighter than some optical magnitude limit, i.e. we must deal with both radio and optical selection. If the magnitude limit for redshift measurements is too shallow, we lose the contribution of optically-faint galaxies. To some extent this bias may be corrected using bivariate (optical/radio) luminosity functions (Felten 1976, Auriemma et al. 1977). Alternatively, radio surveys of optically-selected samples can be used.
Spectacular progress has been recently achieved combining large-area spectroscopic surveys (Las Campanas, SDSS, 2dF and 6dF) with the NVSS and FIRST surveys (Machalski & Godlowski 2000, Magliocchetti et al. 2002, Sadler et al. 2002, Best et al. 2005, Mauch & Sadler 2007). A more local sample has been used by Condon et al. (2002).
If full redshift information is available for a flux-limited radio-selected sample containing too few local sources for a meaningful LLF to be directly derived, the LLF can be estimated from the luminosity distribution of the sample, for any chosen evolution function (Wall et al. 1980). The results are, by definition, model dependent, although the evolution function may be tightly constrained by source counts and other data.
The key to this process is disentangling the star-forming galaxies from
the AGNs. Radio AGNs dominate above S1.4 GHz
 10 mJy; at lower flux
densities an increasing fraction of
nearby galaxies whose radio emission is fuelled by active star formation
appears. Optical spectra can be used to identify the dominant process
responsible for the radio emission of each source. Star-forming galaxies
have spectra typical of HII regions with strong narrow emission lines of
H
10 mJy; at lower flux
densities an increasing fraction of
nearby galaxies whose radio emission is fuelled by active star formation
appears. Optical spectra can be used to identify the dominant process
responsible for the radio emission of each source. Star-forming galaxies
have spectra typical of HII regions with strong narrow emission lines of
H and
H
and
H , while AGNs
may have a variety of spectra, including
pure absorption lines (like spectra of giant elliptical galaxies), LINER
or conventional type 1 or type 2 AGN spectra. Optical AGN spectra,
however, do not necessarily imply that the radio emission is of nuclear
origin. In fact, there is a body of evidence that the star-formation and
nuclear activities are tightly connected, but the radio and optical
emissions of AGNs are largely uncorrelated - about 90% of AGNs are
radio-quiet. An important diagnostic tool to distinguish between
galaxies whose radio emission is due to star formation and those
harbouring a radio-loud AGN is the very-well-established, remarkably
tight and nearly linear correlation between FIR and radio continuum
emission from star-forming galaxies
(Helou
et al. 1985,
Gavazzi
et al. 1986,
Condon
et al. 1991).
A frequently-used criterion
(Condon
et al. 2002)
is that galaxies with radio to far-IR flux ratio more
than three times higher than the mean for star-forming galaxies are
classified as AGN-powered.
Mauch
& Sadler (2007)
found disagreement between spectroscopic
classification and the radio/FIR diagnostic at the ~ 10% level; a
similar reliability was estimated for their classification based on
optical spectroscopy. Objects with composite AGN + starburst radio
emission are probably a primary source of classification ambiguity. This
suggests that the classification uncertainties may contribute
significantly to the overall errors on the local luminosity function of
each population. Nevertheless, rather accurate estimates of the separate
1.4-GHz local luminosity functions of AGNs and starburst galaxies are
now available (see Fig. 8).
, while AGNs
may have a variety of spectra, including
pure absorption lines (like spectra of giant elliptical galaxies), LINER
or conventional type 1 or type 2 AGN spectra. Optical AGN spectra,
however, do not necessarily imply that the radio emission is of nuclear
origin. In fact, there is a body of evidence that the star-formation and
nuclear activities are tightly connected, but the radio and optical
emissions of AGNs are largely uncorrelated - about 90% of AGNs are
radio-quiet. An important diagnostic tool to distinguish between
galaxies whose radio emission is due to star formation and those
harbouring a radio-loud AGN is the very-well-established, remarkably
tight and nearly linear correlation between FIR and radio continuum
emission from star-forming galaxies
(Helou
et al. 1985,
Gavazzi
et al. 1986,
Condon
et al. 1991).
A frequently-used criterion
(Condon
et al. 2002)
is that galaxies with radio to far-IR flux ratio more
than three times higher than the mean for star-forming galaxies are
classified as AGN-powered.
Mauch
& Sadler (2007)
found disagreement between spectroscopic
classification and the radio/FIR diagnostic at the ~ 10% level; a
similar reliability was estimated for their classification based on
optical spectroscopy. Objects with composite AGN + starburst radio
emission are probably a primary source of classification ambiguity. This
suggests that the classification uncertainties may contribute
significantly to the overall errors on the local luminosity function of
each population. Nevertheless, rather accurate estimates of the separate
1.4-GHz local luminosity functions of AGNs and starburst galaxies are
now available (see Fig. 8).
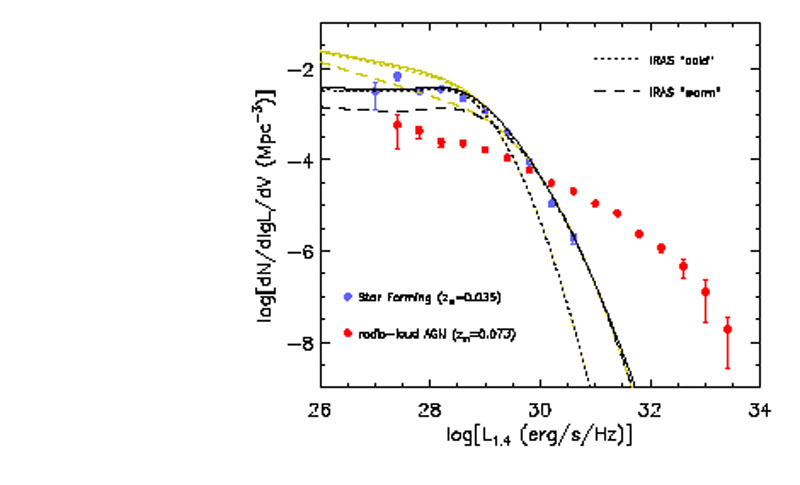 |
Figure 8. Local luminosity functions at 1.4 GHz of radio AGNs (red dots) and of star-forming galaxies (blue dots), as estimated by Mauch & Sadler (2007). The lines show extrapolations to 1.4 GHz of the 60 µm local luminosity functions of "warm" (usually interpreted as starburst; dashed) and "cold" (normal late type; dotted) IRAS galaxies by Takeuchi et al. (2003); the solid lines are the sum of the two contributions. The yellow lines refer to the linear radio/far-IR relationship of eq. (14), while the black lines are based on that of eq. (15), which deviates from linearity at low luminosities. |
With the star-formers disentangled from the radio AGNs, a further
dichotomy in the local luminosity function evaluation is required.
Evolutionary models for radio AGNs generally split the total radio AGN
local luminosity function into the contributions of the steep- and
flat-spectrum sources. As discussed in
Section 4, this is a rather crude, but
frequently unavoidable, simplification. (Obviously, also the radio
spectra of star-forming galaxies must be known for evolution models, but the
problem is simpler because in most cases the spectra are "steep", with mean
~ 0.7 and a relatively
narrow dispersion.)
The 1.4-GHz selection emphasizes steep-spectrum sources, but the
flat-spectrum sources may be important in some luminosity ranges. The
estimates of separated local luminosity functions for the two
populations go back to
Wall et
al. (1981),
Peacock
(1985),
Toffolatti et al. (1987),
Subrahmanya & Harnett (1987),
with little progress thereafter.
Rigby
et al. (2008)
estimated that the density of steep-spectrum sources with log
L(1.4 GHz) / erg s-1 Hz-1
> 32 is
(3.0 ± 1.2) × 10-7 Mpc-3.
Moderate to low-luminosity flat- or inverted-spectrum sources are mostly
classified as BL Lac objects. Very weak, inverted-spectrum radio sources
in the centers of otherwise quiescent ellipticals may correspond to late
phases of AGN evolution (ADAF or ADIOS sources, see
Section 5.5.2). The observational
information on this latter population is very limited.
Pierpaoli & Perna (2004)
assumed that their space density equals that of
elliptical galaxies brighter than L*, and
adopted a log-normal luminosity function with mean
logL(2.7 GHz) / erg s-1 Hz-1
in the range 27-28, and dispersion
 = 0.25. As illustrated by
Fig. 9, the data on the local
luminosity function of flat/inverted-spectrum sources already constrain
the space density of these sources.
= 0.25. As illustrated by
Fig. 9, the data on the local
luminosity function of flat/inverted-spectrum sources already constrain
the space density of these sources.
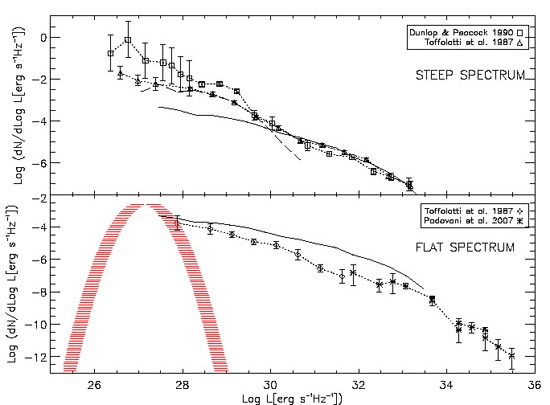 |
Figure 9. Contributions of steep- (upper panel) and flat/inverted-spectrum (lower panel) sources to the local luminosity functions at 1.4 GHz. In both panels the solid line shows Mauch & Sadler's (2007) estimate of the total (i.e., flat/inverted- plus steep-spectrum) local radio luminosity function of AGNs. In the upper panel, the dashed line shows Mauch & Sadler's (2007) estimate of the local luminosity function of starburst galaxies (mostly steep-spectrum), that dominate for log L(erg s-1 Hz-1) < 30; the estimates by Toffolatti et al. (1987) and Dunlop & Peacock (1990) of the local luminosity functions of steep-spectrum sources include both starburst galaxies and AGNs. The Toffolatti's local luminosity function of flat-spectrum sources (lower panel) joins smoothly with the estimated local luminosity function of BL Lac objects obtained by Padovani et al. (2007). The cross-hatched area shows the range spanned by the estimates by Pierpaoli & Perna (2004) of the local luminosity functions of ADAF sources. |
As for BL Lacs, a serious hindrance in the determination of the luminosity function is their essentially featureless spectrum, complicating (or defeating) redshift determination. However, several lines of evidence suggest that their luminosity function evolves weakly if at all (Padovani et al. 2007a), so that the useful volume for computing the local luminosity function extends up to substantial redshifts. The estimate by Padovani et al. (2007a) compares well with the LLF of flat-spectrum sources obtained by Toffolatti et al. (1987). On the contrary, high luminosity flat-spectrum sources are very rare locally and evolve strongly, so that a model independent estimate of the local luminosity function is essentially impossible.
