


By 1966 the counts produced from the Cambridge 3C and 4C surveys at 178
MHz
(Gower
1966)
had already defined the characteristic shape confirmed and refined by
later surveys: in the Euclidean normalized presentation, a `Euclidean'
portion at the brightest flux densities, followed at lower flux
densities by a `bump' (dubbed `bulge' by
Wall
1994),
and then a roll-off toward the faint intensities. The `bump' is the
signature of strong cosmic evolution, implying that the universe must
have evolved from a state of `violent activity' in the past to a more
quiescent phase at the present epoch, in contradiction to the steady
state model as pointed out by
Ryle
& Clarke (1961).
It is also in complete contradiction to
uniformly-populated Friedman models (e.g.
Wall et
al. 1980).
A further implication of strong evolution, also noted by
Ryle
& Clarke (1961),
is that it swamps the effect on the source counts
of different cosmological models, frustrating the original hopes that
the counts could inform on the geometry of the universe. The evolution
is indeed spectacular, yielding co-moving source densities at z
~ 1-2 a factor of  103 higher than those of local sources of similarly high
luminosities
(Longair
1966).
As stressed by
Condon
(1989),
this means that the fraction of nearby radio sources is low even at
large flux densities; the median redshifts of radio sources in complete
samples with limits ranging from mJy to Jy are close to 0.8.
103 higher than those of local sources of similarly high
luminosities
(Longair
1966).
As stressed by
Condon
(1989),
this means that the fraction of nearby radio sources is low even at
large flux densities; the median redshifts of radio sources in complete
samples with limits ranging from mJy to Jy are close to 0.8.
Two reference evolutionary scenarios for radio sources (not to be
interpreted literally) were used in the 1960s to interpret the counts;
they remain popular today. In the luminosity evolution
scenario, the comoving density of sources is constant but luminosities
vary with cosmic epoch, while in the density evolution scenario
the comoving density of sources of any luminosity varies. A density
and luminosity evolution of the luminosity function at the
frequency  can be described as:
 |
(11) |
where fd(z) and fl(z) are the functions describing the density and the luminosity evolution, respectively.
In his pioneering investigation,
Longair
(1966)
showed that either fd(z) =
(1 + z)m or fl(z)
= (1 + z)m' would fit his data, provided that
only sources with high radio luminosity (log(L178 MHz)
33.5 in the case of luminosity evolution or log(L178 MHz)
34.9 in the case of density evolution; luminosities in
erg s-1 Hz-1) evolve. This is called
power-law evolution in which the function is a power of the expansion
factor of the Universe. (To be precise, Longair quoted evolution
functions proportional to tn in an Einstein-de
Sitter universe, where the cosmic time t is proportional to
(1 + z)-3/2). The power-law evolution diverges at high
redshifts, and must be truncated. The problem is avoided in the
exponential evolution model proposed both by
Doroshkevich et al. (1970)
and by
Rowan-Robinson (1970),
fd(z) =
exp(k (z)) or
fl(z) =
exp(k'(z)),
where is the lookback time
in units of the Hubble time
H0-1, and k-1 or
k'-1 are the evolutionary timescales in the same units.
(z)) or
fl(z) =
exp(k'(z)),
where is the lookback time
in units of the Hubble time
H0-1, and k-1 or
k'-1 are the evolutionary timescales in the same units.
A further step in exploring radio-AGN evolution was taken by Schmidt (1968) and Rowan-Robinson (1968): the development of the Vmax or `luminosity - volume' test. The test avoids mentioning source counts, at the time still lingering under a cloud of suspicion. It requires a complete sample, and it requires that if two or more limits to this completeness are in play, they all be considered. For example Schmidt (1968) applied the test to the quasars of the 3CR catalogue, a sample defined by the radio flux-density survey limit and by the optical magnitude limit of the original Palomar Observatory Sky Survey. The test is simple: take each object and "push" it out in increasing redshift until it becomes faint enough to encounter one of the two limits, radio or optical. (The process requires that the optical and radio spectra be known so as to define K-corrections in each band.) Stop "pushing" at the first limit encountered; this defines zmax and hence Vmax, the maximum co-moving volume in which the object could be found. Calculate the co-moving V for the object, the volume defined by the object's redshift, and then form the ratio V/Vmax. Do this for all objects in the sample. It is easy to show that if they are uniformly distributed in space, the values should be uniformly distributed between 0 and 1.0, i.e. <V / Vmax> = 0.5 ± 1 / (12N)1/2 where N is the number of objects in the sample. The statistic is a maximum-likelihood estimator and is unbiased. It remains in widespread use and has undergone many refinements, e.g the C- method of Lynden-Bell (1971), the application to combined samples (Avni & Bahcall 1980), Vmax methods to extract an evolution function (Choloniewski 1987 and references therein), methods to estimate the luminosity function directly (Felten 1976, Eales 1993), and the banded V / Vmax method (Dunlop & Peacock 1990). There is a vast literature; (Willmer 1997) is a good starting point.
Schmidt (1968) found strong evolution for the 3CR quasars, in accord with the evolution derived by e.g. Longair (1966). Longair & Scheuer (1970) showed how very closely the test was related to the source-count test and emphasized that the two methods were far from independent. However, V / Vmax is versatile, simple in concept, model-free, and comes with a statistical pedigree, in contrast to source counts, the trial and error process of guessing suitable evolution functions, and the frequently less-than-transparent statistical methods used to compare these with source-count and redshift data.
However, the evolution functions mentioned above may carry physical
significance. For example a physical interpretation was offered by
Cavaliere et al. (1985)
who pointed out that models for gravitational energy
release near collapsed massive objects yield
dL / dt = -A(t)
L1 + p. If A = constant and p = 0 we
get the exponential luminosity evolution function with timescale
k-1 = A-1. If A(t)
 t-1
we get a power-law evolution. It must be
stressed that these evolutionary laws apply to source
populations, not to individual sources: the evolutionary
timescales, k-1, are found to be of order of a few to
several Gyrs, while the lifetimes of bright radio AGN phases are at
least one and probably two orders of magnitude shorter
(Bird et
al. 2008).
Grueff
& Vigotti (1977)
made an early attempt to build a model explicitly
constrained by astrophysical factors. They linked the radio-source
formation to that of parent galaxies and assumed radio-emitting
lifetimes inversely proportional to radio luminosities.
t-1
we get a power-law evolution. It must be
stressed that these evolutionary laws apply to source
populations, not to individual sources: the evolutionary
timescales, k-1, are found to be of order of a few to
several Gyrs, while the lifetimes of bright radio AGN phases are at
least one and probably two orders of magnitude shorter
(Bird et
al. 2008).
Grueff
& Vigotti (1977)
made an early attempt to build a model explicitly
constrained by astrophysical factors. They linked the radio-source
formation to that of parent galaxies and assumed radio-emitting
lifetimes inversely proportional to radio luminosities.
Most evolution models have ignored the distributions of spectral indices
around the mean values (which may be luminosity dependent) for both
steep- and flat-spectrum sources (but see
Condon
1984a).
If such distributions can be approximated as Gaussians with dispersion
 , and the differential
counts have a power-law shape, n(S) =
kS-
, and the differential
counts have a power-law shape, n(S) =
kS- , the mean spectral index
 of sources with given
value of S shifts with frequency
(Kellermann 1964,
Condon
1984a,
Danese
& de Zotti 1984):
of sources with given
value of S shifts with frequency
(Kellermann 1964,
Condon
1984a,
Danese
& de Zotti 1984):
 |
(12) |
and the amplitude of the counts
scales with frequency as
k=k0(
/ 0)q,
with:
 |
(13) |
The dispersion of the mean spectral
indices thus counteracts the effect on counts of the high-frequency
steepening (Section 4). The effect is
amplified by the increase with frequency of the variability amplitude
(Impey
& Neugebauer 1988,
Ciaramella et al. 2004).
We note however that (a) power-law approximations for
source counts hold over very limited flux-density ranges only; and (b) a
Gaussian approximation for spectral-index distributions holds only for
low-frequency surveys. By 1.4 GHz, spectral-index distributions have
pronounced tails towards flat spectra and by 5 GHz, the spectral-index
distribution is almost the sum of two Gaussians with peaks at ~ 0.8
(steep-spectrum sources) and ~ 0.0 (flat-spectrum sources). Clearly,
the above equations can be used to calculate
and q for
each population.
5.1. Low versus high luminosities
Extensive discussions can be found in the literature on whether or not the cosmological evolution is a property of powerful radio sources only. The origin of the discussion is Longair (1966)'s classic study. He adopted a luminosity function extending over about 8 decades in luminosity and with a shape not far from a power-law, so that density and luminosity evolution were essentially equivalent over the flux density range covered by the counts available at the time. Under these assumptions, the relative narrowness of the evolution bump in normalized counts (width less than 2 orders of magnitude) compared to the breadth of the luminosity function (8 orders of magnitude) could be accounted for if only the brightest sources evolve strongly. It was a fundamental discovery of Longair (1966)'s investigation that `differential evolution' was therefore essential: if all sources evolved equally, there are far too many faint sources, i.e. the model bump is far too broad.
As more data accumulated, the evolutionary models were refined.
Robertson (1978),
Robertson (1980)
and
Wall et
al. (1980)
factorized the evolving luminosity function as
 (L,
z) = F(L, z)
0(L), where
F(L, z) is the evolution function, able to represent
density or luminosity evolution, or a combination of both. Models
assuming a luminosity-independent evolution function were found to
produce unsatisfactory results, while (following the qualitative
description of the previous paragraph) good fits of the data were
obtained only by assuming a far stronger F(L, z) for
more luminous sources.
Danese
et al. (1987)
proposed a luminosity-dependent luminosity evolution
model in which the luminosity evolution timescale increases with
decreasing luminosity and exceeds H0-1, so
that sources evolve weakly (if at all), below some critical luminosity
Ls ~ 1031 erg
s-1 Hz-1. This is in keeping with the
indications that a variety of physical processes can sustain a steady
low-level fueling of the central engine for times longer than the Hubble
time
(Cavaliere
et al. 1985).
The
Danese
et al. (1987)
model was exploited by
Toffolatti et al. (1998)
to carry out remarkably successful predictions of radio
source contributions to small scale anisotropies measured by Cosmic
Microwave Background experiments.
(L,
z) = F(L, z)
0(L), where
F(L, z) is the evolution function, able to represent
density or luminosity evolution, or a combination of both. Models
assuming a luminosity-independent evolution function were found to
produce unsatisfactory results, while (following the qualitative
description of the previous paragraph) good fits of the data were
obtained only by assuming a far stronger F(L, z) for
more luminous sources.
Danese
et al. (1987)
proposed a luminosity-dependent luminosity evolution
model in which the luminosity evolution timescale increases with
decreasing luminosity and exceeds H0-1, so
that sources evolve weakly (if at all), below some critical luminosity
Ls ~ 1031 erg
s-1 Hz-1. This is in keeping with the
indications that a variety of physical processes can sustain a steady
low-level fueling of the central engine for times longer than the Hubble
time
(Cavaliere
et al. 1985).
The
Danese
et al. (1987)
model was exploited by
Toffolatti et al. (1998)
to carry out remarkably successful predictions of radio
source contributions to small scale anisotropies measured by Cosmic
Microwave Background experiments.
The differential evolution is suggestive of two populations. Pushing the high/low luminosity dichotomy to the extreme, some investigators explicitly considered two populations, one of non-evolving low-luminosity sources, and the other of high-luminosity, strongly evolving sources. Wall (1980) identified the two populations with FR I and FR II radio galaxies. The border between FR I and FR II is, approximately, at L1.4 GHz ~ 1032 erg s-1 Hz-1, although the division appears to be dependent on both radio power and optical luminosity of the host galaxy (cf. Ledlow & Owen 1996). Jackson & Wall (1999) extended the scheme to flat-spectrum sources, assuming that BL Lac objects and flat-spectrum radio quasars are the beamed counterparts of FR I and FR II objects respectively, as discussed in Section 5.4.
Before the advent of 2dF and SDSS sky surveys, the space distribution of
low-luminosity radio AGN was a matter of speculation. For example,
Laing
et al. (1983)
showed that the low-luminosity radio galaxies of 3CRR
[log(L178 MHz / erg s-1
&Hz-1) < 34] gave values of <V /
Vmax>
 0.50, suggesting
little or no evolution. This view was supported by
Clewley
& Jarvis (2004)
who found that the comoving space density of sources
fainter than L1.4 GHz ~ 4 ×
1032 erg s-1 Hz-1
remains approximately constant with increasing redshift up to
z
0.50, suggesting
little or no evolution. This view was supported by
Clewley
& Jarvis (2004)
who found that the comoving space density of sources
fainter than L1.4 GHz ~ 4 ×
1032 erg s-1 Hz-1
remains approximately constant with increasing redshift up to
z  0.5. However,
numbers were small and uncertainties
undoubtedly permitted some mild evolution. On the basis of discovering
two distant FR I galaxies in the Hubble Deep Field,
Snellen
& Best (2001)
proposed that FR I galaxies showed significant
evolution. With recourse to the 2dF sample of galaxy redshifts,
Sadler
et al. (2007)
quantified this: they found substantial cosmological
evolution over the redshift range 0 < z < 0.7 of radio
galaxies with 1031 < L1.4 GHz <
1032 erg s-1 Hz-1,
i.e. in the luminosity range of FR I sources. They also found
indications that the most powerful radio galaxies in their sample (with
L1.4 GHz > 1033 erg
s-1 Hz-1) undergo more rapid evolution over the
same redshift range. The latter findings are consistent with those by
Willott
et al. (2001),
who used emission-line strength rather than
morphology (FR I / FR II) to discriminate between radio-source
populations. The critical radio luminosity dividing sources with
weak/absent emission lines (the less radio-luminous population of
FR I and FR II), and the more radio-luminous population of
strong-line FR II radio galaxies and quasars, is approximately
L1.4 GHz ~ 6 × 1032 erg
s-1 Hz-1. Both populations show
evidence for evolution, but the comoving density of the more powerful
sources rises far more dramatically than that of the low-luminosity
population.
0.5. However,
numbers were small and uncertainties
undoubtedly permitted some mild evolution. On the basis of discovering
two distant FR I galaxies in the Hubble Deep Field,
Snellen
& Best (2001)
proposed that FR I galaxies showed significant
evolution. With recourse to the 2dF sample of galaxy redshifts,
Sadler
et al. (2007)
quantified this: they found substantial cosmological
evolution over the redshift range 0 < z < 0.7 of radio
galaxies with 1031 < L1.4 GHz <
1032 erg s-1 Hz-1,
i.e. in the luminosity range of FR I sources. They also found
indications that the most powerful radio galaxies in their sample (with
L1.4 GHz > 1033 erg
s-1 Hz-1) undergo more rapid evolution over the
same redshift range. The latter findings are consistent with those by
Willott
et al. (2001),
who used emission-line strength rather than
morphology (FR I / FR II) to discriminate between radio-source
populations. The critical radio luminosity dividing sources with
weak/absent emission lines (the less radio-luminous population of
FR I and FR II), and the more radio-luminous population of
strong-line FR II radio galaxies and quasars, is approximately
L1.4 GHz ~ 6 × 1032 erg
s-1 Hz-1. Both populations show
evidence for evolution, but the comoving density of the more powerful
sources rises far more dramatically than that of the low-luminosity
population.
It must be noted, however, that a luminosity-dependent evolution
function, F(L, z), does not necessarily imply a
luminosity-dependent luminosity evolution. For example, in the case of a
luminosity function
L- a uniform power-law evolution,
L(z) = L(0)(1 + z)a, yields
[L(z)] =
[L(0)](1
+ z)a; the evolution
function depends on the slope of the luminosity function. If the
luminosity function levels off below some `bending' luminosity
Lb, a luminosity-independent luminosity
evolution translates into a constant comoving space density at low
luminosities, with strong variations with epoch confined to the steep
portion of the luminosity function. As shown by
Condon
(1984b),
it is then possible to fit a wide range of radio data with a model
assuming that all sources evolve equally.
a uniform power-law evolution,
L(z) = L(0)(1 + z)a, yields
[L(z)] =
[L(0)](1
+ z)a; the evolution
function depends on the slope of the luminosity function. If the
luminosity function levels off below some `bending' luminosity
Lb, a luminosity-independent luminosity
evolution translates into a constant comoving space density at low
luminosities, with strong variations with epoch confined to the steep
portion of the luminosity function. As shown by
Condon
(1984b),
it is then possible to fit a wide range of radio data with a model
assuming that all sources evolve equally.
Finally, we note that the debate on the evolution of low luminosity
radio AGNs has been somewhat muddled for some time by the poor knowledge
of their local luminosity function. As discussed in
Section 3, it is now clear that the faint
portion of the radio luminosity function is dominated by starburst
galaxies, while the luminosity function of radio AGNs flattens below log
L(1.4 GHz) / erg s-1 Hz-1
31.
5.2. Steep- versus flat-spectrum sources
The width of the bump in the Euclidean normalized counts increases with
increasing frequency. The bump of the steep-spectrum population
dominating the low-frequency counts shifts to fainter flux densities and
gradually fades as survey frequency increases. But as survey frequency
increases the evolution bump of flat-spectrum sources becomes steadily
more prominent, combining with the steep-spectrum bump to produce an
increasingly broad overall maximum, a broader range of flux densities
over which the count slope is close to Euclidean
(Kellermann
& Wall 1987).
This initially misled investigators to consider
different space distributions and evolutionary laws for steep- and
flat-spectrum sources, with less evolution for the latter.
Demonstrating the lack of independence of
V / Vmax and source-count results, similar
indications of little evolution for flat-spectrum objects came from this
direction.
Schmidt
(1968)
found a slight indication in the 3CR sample of quasars that
<V / Vmax> appeared to be less for
the flatter-spectrum objects. When substantial flat-spectrum quasar
samples became available from cm-wavelength surveys, it was found that
<V / Vmax>
0.5,
consistent with a uniform distribution
(Schmidt
1976,
Masson
& Wall 1977).
This is in contrast to <V / Vmax>
0.7 for
steep-spectrum quasars, indicative of a strong increase of their space
density with z.
Peacock & Gull (1981) stressed that the data available at the time poorly constrained the luminosity function over most areas of the luminosity-redshift plane (see also Wall et al. 1981), and pointed out that within the regions where the luminosity function was reasonably well defined, steep- and flat-spectrum sources behave similarly: both spectral types undergo differential evolution, the strength of evolution increasing with luminosity. The analysis by Condon (1984a) confirmed that the two spectral classes may indeed evolve similarly within the constraints of the data. This position received further support from comparative analysis of evolution of AGNs in the radio, optical and X-ray bands by Danese et al. (1985), who noted that the apparently weaker evolution of flat-spectrum sources might be related to relativistic beaming effects that boost the apparent radio luminosity. In particular, BL Lac objects are probably associated with low-luminosity steep-spectrum radio sources which also show weak evolution. More extensive data and further analyses (Danese et al. 1987, Dunlop & Peacock 1990) reconciled the epoch-dependent spatial distributions of the two populations, showing that they were essentially identical. This finding produced a necessary consistency for the success of the unified scheme for radio-loud AGNs; it is clearly not possible for side-on and end-on versions of the same populations to have different space distributions. `Unified evolutionary schemes', in which flat-spectrum quasars and BL-Lac objects are `beamed' versions of FR I and FR II sources, were presented by Urry & Padovani (1995) and Jackson & Wall (1999) and are discussed in Section 5.4.
Some of the apparent discrepancy between these analyses can perhaps be
resolved noting that, while <V / Vmax>
> 0.5 means an increase with redshift of the source density,
<V / Vmax>
0.5 does not
necessarily mean no evolution. Evolution increasing the source density
up to z ~ 2 and decreasing it afterwards may yield
<V / Vmax>
0.5 for quasars
visible up to high z; at high-z the visibility of
flat/inverted-spectrum quasars is enhanced compared to the
steep-spectrum ones by the more favourable K-correction. This may be
part of the explanation; but probably the majority of the explanation
for disparate <V / Vmax>
results arises from selecting the steep-spectrum samples from their
initial steep portion of source count, while selecting the flat-spectrum
sources from an effectively fainter (and flatter) portion of the source
count.
At some epoch, radio galaxies and quasars have to be born; some epoch
after recombination has to have assembled galaxies suitable to harbour
both massive black hole cores and fuel systems for these to produce
collimated twin-beam radio AGNs. We have described how easily we can
trace the very strong increase of the co-moving number density of
powerful radio sources between redshift
0 and 2. How hard is
it to find the more distant epoch at which this relatively high
co-moving density falls to signify the epoch of AGN birth?
This is an important issue. The radio activity is associated with processes driving the growth of supermassive black holes (SMBHs) in galactic nuclei, which in turn is tied to galaxy formation and evolution. The radio activity may also drive feedback processes that have a key role in the evolution of black holes and their host galaxies (Granato et al. 2004, Best et al. 2006, Bower et al. 2006, Croton et al. 2006). Powerful radio galaxies and quasars trace the most massive SMBHs (Dunlop et al. 2003, McLure et al. 2004) which are hosted by the most massive galaxies (Ferrarese & Ford 2005). Radio survey data are unaffected by dust extinction and may thus provide crucial tests of the optical/IR results on galaxy formation.
One of the achievements of the outstanding (Dunlop & Peacock 1990) free-form evolution analysis was to provide evidence for a decline (or high redshift "cut-off") in the number density of sources with both steep and flat spectra at redshifts beyond 2.5 to 3.0. However their samples were incomplete in redshift information, and the results were dependent on the accuracy of photometric redshifts ascribed to sources of the optically-faintest host galaxies.
Tracing the redshift cutoff is still under investigation.
Shaver
et al. (1996)
reported evidence of a strong decrease of the space
density of flat-spectrum radio-loud quasars (FSRQs) for z > 3.
Jarvis
& Rawlings (2000)
disputed this, pointing out that the apparently
curved nature of many of the radio spectra involved, and in particular a
spectral steepening to the high frequencies, might reduce or remove the
significance of an apparent redshift cutoff. Ignoring such steepening
leads to the prediction of more high-z sources than are actually
seen, and this could be misinterpreted as evidence for a decline of the
space density. They concluded that the comoving volume covered by the
available samples is too small to make definitive statements about any
redshift cut-off for the most luminous flat-spectrum sources, although
both a constant comoving density and a decline as abrupt as those
envisaged by
Shaver
et al. (1996)
were found to be marginally inconsistent with the
data. Using a larger sample with a more rigorous analysis,
Wall et
al. (2005)
found evidence, significant at >
4, of a
diminution in space density of flat-spectrum quasars at z > 3,
consistent with the redshift-cutoff forms of both optically-selected
(Schmidt
et al. 1995,
Fan et
al. 2004)
and X-ray selected
(Hasinger et al. 2005,
Silverman et al. 2005)
quasars. Wall et al. drew attention to a major source
of bias in the Jarvis et al. sample, the non-contemporaneous nature of
the radio flux-density measurements. It is certain that this introduces
too much apparent high-frequency curvature and decline into the radio
spectra. The effect of the bias was demonstrated by Wall et al., using
both contemporaneous and non-contemporaneous spectral data.
Using three samples selected at low frequencies,
Jarvis
et al. (2001)
found that the space density of the most radio-luminous
steep-spectrum radio sources is consistent with being constant
between z 2.5
and z 4.5 and
excluded a decline as steep as suggested by
Shaver
et al. (1996),
Shaver
et al. (1999).
This conclusion was confirmed by
Cruz et
al. (2007).
However, the samples remain small and incomplete in
redshift information and as for
Dunlop
& Peacock (1990),
the faintest host galaxies require redshift
estimation from a K - z plot. It is much harder to track
any redshift diminution for steep-spectrum radio galaxies then for FSRQ
and the statistical uncertainties are inevitably greater; showing that
the steep-spectrum samples are consistent with a uniform distribution
does not disprove the redshift cutoff found by
Wall et
al. (2005)
for FSRQ.
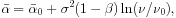
These apparently contradictory results may again be accounted for by luminosity-dependent evolution. Hook et al. (1998) reported indications that the high-z decline of the space density of flat-spectrum quasars is more pronounced and starts at lower redshifts for less powerful sources. These indications were confirmed by subsequent studies that did not distinguish between flat- and steep-spectrum sources (Waddington et al. 2001, Vigotti et al. 2003, Cirasuolo et al. 2005, Cirasuolo et al. 2006). The luminosity dependence of the high-z decline is qualitatively similar to the downsizing observed for galaxies and optically and X-ray selected quasars (Cowie et al. 1996, Barger et al. 2005, Pérez-González et al. 2008). A new analysis in progress by Wall et al. (2009 in preparation) uses a Bayesian modelling process similar to that described by Wall et al. (2008), and this pseudo-downsizing effect is very clear for FSRQ, as shown in Fig. 10.
 |
Figure 10. Relative space density of flat-spectrum radio quasars from the Parkes Quarter-Jansky sample, as derived from a Maximum-Likelihood analysis similar to that of Wall et al. (2008). The sample and Single-Object Survey (SOS) technique used were described by Wall et al. (2005). The peak of FSRQ activity is a monotonic function of 2.7-GHz monochromatic radio luminosity (L in units of ergs s-1 Hz-1) in the pseudo-downsizing sense, i.e. lower luminosities have the peak of their activity at lower redshifts. The green curve in each diagram represents the global solution for the entire sample. This `down-sizing' is similar to that found for quasars selected at X-ray wavelengths (Hasinger et al. 2005) and for submm galaxies (SMG) from JCMT surveys (Wall, Pope & Scott 2008). |
There remains further need for complete redshift information on faint samples of steep-spectrum radio sources to clarify their high-redshift evolution. An important step in this direction has been the Combined EIS-NVSS Survey Of Radio Sources (CENSORS, Brookes et al. 2008) that included spectroscopic observations of 143 out of a total of 150 sources with S1.4 GHz > 3.8 mJy. Of these, 137 form a complete sample to a flux-density limit of 7.2 mJy. The resulting redshift distribution agrees well with the distribution in Fig. 28 of Condon (1984a) but is not well reproduced by any of the Dunlop & Peacock (1990) models (see, e.g., Fig. 11). These data promise substantial improvement in this field.
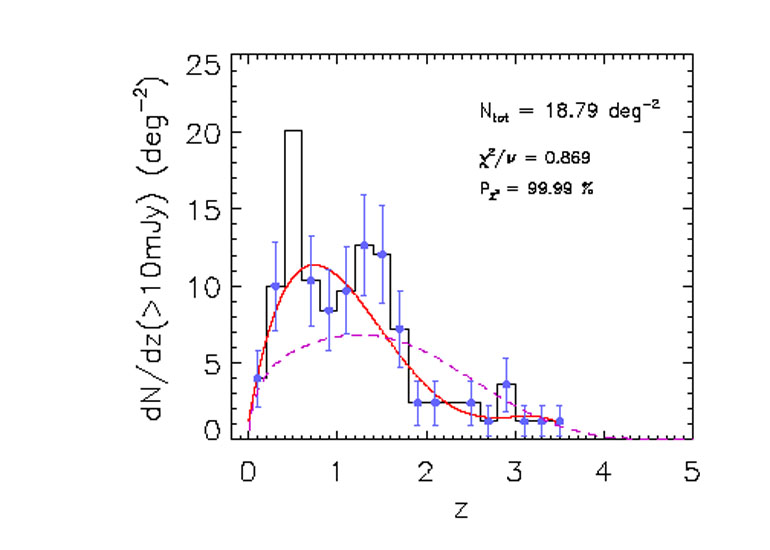 |
Figure 11. Redshift distribution of sources brighter than 10 mJy at 1.4 GHz in the CENSORS sample Brookes et al. (2008), compared with that predicted by the PLE model by (Dunlop & Peacock 1990 dashed line) and with the fit of eq. (26). As the model applies to the AGN population, the two sources classified as starburst galaxies (nos. 95 and 124) were excluded from the histogram.The Kaplan-Meier estimator was used to take into account the lower limits into account. |
5.4. Unified evolutionary schemes
Urry
& Padovani (1995)
carried out a thorough examination of the most
widely accepted version of the unification scheme encompassing steep-
and flat-spectrum radio sources. This scheme is based on the premise
that relativistic beaming of lobe-dominated, steep-spectrum, moderate
radio power FR I and high-radio-power FR II radio galaxies
gives rise to core dominated, flat-spectrum BL Lac objects and radio
loud quasars, respectively, when the line of sight is close to the jet
axis (Fig. 1). Urry & Padovani
based their analysis on a comparison of luminosity functions for the
different objects, and they showed that with reasonable assumptions for
the beaming parameters, these were in agreement. (We remind the reader
that in the case of beamed emission, the true luminosities are lower
than those inferred from the observed fluxes assuming isotropic emission
by a factor  /
4
/
4 , where
is the solid angle of the
beaming cone(s). For example, in the case of twin beams each with
semi-aperture angle of 7°,
/
4
0.094.)
, where
is the solid angle of the
beaming cone(s). For example, in the case of twin beams each with
semi-aperture angle of 7°,
/
4
0.094.)
More recent analyses (Liu & Zhang 2007, Cara & Lister 2008), using observations of the jet kinematics and the apparent superluminal speeds for a complete sample Lister (2008), have confirmed the general validity of the scheme and have improved the accuracy in parameter determination. The assumption that the observed luminosity function of FR II galaxies has the same power-law shape as the intrinsic luminosity function of radio-loud quasars was successfully tested using a maximum likelihood method. Padovani & Urry (1992) had originally developed their method of comparing the calculated beamed luminosity functions of flat-spectrum quasars and BL Lac objects with the observed ones before their comprehensive review paper. Now the observed distribution of Lorentz factors of relativistic jets (Hovatta et al. 2008) is found to be in good agreement with their estimate. The observed distribution of viewing angles also turned out to be consistent with predictions of their unified model. Hovatta et al. (2008) found that the transition from blazars to ordinary radio loud quasars occurs at a viewing angle of 15° to 20°, to be compared with Urry & Padovani (1995)'s estimate of 14°.
Wall & Jackson (1997) and Jackson & Wall (1999) derived an evolutionary model aimed at explaining the behaviour of both the flat- and steep-spectrum populations within a unified scheme. Following Urry & Padovani (1995), they assumed BL Lacs to be the beamed versions of FR I galaxies, and FSRQs to be the beamed versions of FR II galaxies. However the analysis differed from that of Urry & Padovani in deriving model parameters directly from the data rather than by comparing luminosity functions. As a first step, Jackson & Wall derived evolution models separately for FR I and FR II radio galaxies, using data (counts and redshifts) solely from low-frequency surveys in order to avoid beamed objects and to establish space-density behaviour for these parent populations. The evolution models they derived happened to have redshift cutoffs, and for the FRI galaxies the approximation of space density constant with epoch was adopted. These both gave good fits to the low-frequency data, but neither feature is essential to the outcome of the experiment. Together with observed ratios of beamed (core) flux to unbeamed flux, Jackson & Wall then used a Monte Carlo process to orient statistically-large samples of FR I and FR II sources randomly to the line of sight. Using a grid of beaming parameters (range of Lorentz factors, torus opening angles), they then calculated the number of beamed objects (BL Lacs and FSRQs) produced at different flux densities. Identifying these objects with the cm-excess sources found in cm-wavelength surveys, they then closed the loop by using the higher-frequency source counts (primarily at 5 GHz) to find the permissible range of beaming parameters. The process was able to reproduce the exact form of the higher-frequency counts with their broader bump (Section 5.2) as well as torus opening angles and Lorentz factors in reasonable agreement with observations. Liu & Zhang (2007) found that the Lorentz factor distribution is much steeper for low-redshift (z < 0.1) low-luminosity sources than for the more powerful, high-z ones, although the uncertainties are large. Therefore the most extreme relativistic jets are rarer in the low-z population. This indicates that the low- and high-redshift groups are likely to be from different parent populations, consistent with the dual-population scheme of Jackson & Wall (1999).
The Jackson & Wall (1999) unification scheme was adopted by Wilman et al. (2008) to reproduce the observed variety of radio-loud AGNs, including radio galaxies, steep- and flat-spectrum quasars, and strongly beamed sources such as BL Lacs and FSRQs. These authors produced a simulation of a sky area of 20 × 20 deg2 out to z = 20, and down to a flux density of 10 nJy at several frequencies from 151 MHz to 18 GHz. The model comprises 5 source populations with different evolutionary properties: FR I and FR II AGNs, "radio-quiet" AGNs (defined as all X-ray - selected AGNs), and star-forming galaxies in quiescent and star-bursting phases. The simulation includes redshift-dependent size distributions both for radio-loud AGNs and for star-forming galaxies. Clustering is modeled by attributing to each population an effective halo mass and computing the corresponding bias factors, b(z). The simulations have been built with the SKA in mind and will serve to inform design of the SKA, design of analysis software and design of observing programmes.
5.5. Special classes of sources
5.5.1. GHz peaked spectrum (GPS) sources
GPS sources are powerful (logL1.4 GHz
32 erg s-1 Hz-1), compact
( 1 kpc) radio sources
with convex spectra peaking at GHz frequencies (see
O'Dea
1998
for a comprehensive review). They are identified with both galaxies and
quasars. It is now widely agreed that GPS sources correspond to the
early stages of the evolution of powerful radio sources, when the
radio-emitting region grows and expands within the interstellar medium
of the host galaxy, before plunging out into the intergalactic medium
and becoming an extended radio source
(Fanti
et al. 1995,
Readhead
et al. 1996,
Begelman
1996,
Snellen
et al. 2000).
Conclusive evidence that these sources are young came
from VLBI measurements of propagation velocities. Speeds of up to
0.4c were
measured, implying dynamical ages ~ 103 years
(Polatidis et al. 1999,
Taylor
et al. 2000,
Tschager
et al. 2000).
The identification and investigation of these sources
is therefore a key element in the study of the early evolution of
radio-loud AGNs.
1 kpc) radio sources
with convex spectra peaking at GHz frequencies (see
O'Dea
1998
for a comprehensive review). They are identified with both galaxies and
quasars. It is now widely agreed that GPS sources correspond to the
early stages of the evolution of powerful radio sources, when the
radio-emitting region grows and expands within the interstellar medium
of the host galaxy, before plunging out into the intergalactic medium
and becoming an extended radio source
(Fanti
et al. 1995,
Readhead
et al. 1996,
Begelman
1996,
Snellen
et al. 2000).
Conclusive evidence that these sources are young came
from VLBI measurements of propagation velocities. Speeds of up to
0.4c were
measured, implying dynamical ages ~ 103 years
(Polatidis et al. 1999,
Taylor
et al. 2000,
Tschager
et al. 2000).
The identification and investigation of these sources
is therefore a key element in the study of the early evolution of
radio-loud AGNs.
The model by
De
Zotti et al. (2000)
implies that extreme GPS quasars, peaking at
> 20 GHz, should comprise
a substantial fraction of bright radio sources in the WMAP survey at
20 GHz, while GPS
galaxies with similar
peak should be about 10
times less numerous. For a maximum rest-frame peak frequency
p,i = 200 GHz, the
model predicts about
10 GPS quasars with S30 GHz > 2 Jy
peaking at  30 GHz over the
10.4 sr at |b|
> 10°. Although the number of quasars with spectral
peaks at 30 GHz in the WMAP
survey is consistent with this, when additional data
(Trushkin 2003)
are taken into account such sources look more like blazars caught during
a flare that is optically thick up to high frequencies. Furthermore,
Tinti
et al. (2005)
showed that most (perhaps two thirds) of the quasars in the sample of
High Frequency Peaker (HFP, GPS sources peaking above a few GHz)
candidates selected by
Dallacasa et al. (2000)
are likely to be blazars, while all the 10 candidates
classified as galaxies are consistent with being truly young
sources. This conclusion was strengthened by the VLBA variability and
polarization studies of
Torniainen et al. (2005),
Orienti
et al. (2006),
Orienti
et al. (2007), and
Orienti
& Dallacasa (2008).
30 GHz over the
10.4 sr at |b|
> 10°. Although the number of quasars with spectral
peaks at 30 GHz in the WMAP
survey is consistent with this, when additional data
(Trushkin 2003)
are taken into account such sources look more like blazars caught during
a flare that is optically thick up to high frequencies. Furthermore,
Tinti
et al. (2005)
showed that most (perhaps two thirds) of the quasars in the sample of
High Frequency Peaker (HFP, GPS sources peaking above a few GHz)
candidates selected by
Dallacasa et al. (2000)
are likely to be blazars, while all the 10 candidates
classified as galaxies are consistent with being truly young
sources. This conclusion was strengthened by the VLBA variability and
polarization studies of
Torniainen et al. (2005),
Orienti
et al. (2006),
Orienti
et al. (2007), and
Orienti
& Dallacasa (2008).
An implication of these results is that the samples of confirmed GPS quasars are too small to allow meaningful study of their evolutionary properties. The situation is somewhat better for GPS galaxies. Tinti & de Zotti (2006) found that the observed redshift and peak frequency distributions of these sources can be satisfactorily accounted for in the framework of the self-similar expansion model proposed by Begelman (1996), Begelman (1999). According to this model, the properties of the sources are determined by the interaction of a compact, jet-driven, over-pressured, non-thermal radio lobe with a dense interstellar medium. Fits of the redshift and peak frequency distributions require a decrease of the emitted power and of the peak luminosity with source age or with decreasing peak frequency, consistent with expectations from Begelman's model, but at variance with the Snellen et al. (2000) model.
5.5.2. Late stages of AGN evolution
Late stages of the AGN evolution, characterized by low
radiation/accretion efficiency, were brought into sharper focus by the
discovery of ubiquitous, moderate-luminosity hard X-ray emission from
nearby ellipticals. VLA studies at high radio frequencies (up to
43 GHz) have shown, albeit for a limited sample of objects, that
all the observed compact cores of elliptical and S0 galaxies have
spectra rising up to
20-30 GHz
(di
Matteo et al. 1999).
There is growing evidence that essentially all massive ellipticals host
super-massive black holes (e.g.
Ferrarese & Ford 2005).
Yet nuclear activity is not observed at the level expected from
Bondi
(1952)
spherical accretion theory, in the presence of extensive hot gaseous
halos, and for the usually-assumed radiative efficiency
10%
(di
Matteo et al. 1999).
However as proposed by
Rees et
al. (1982),
the final stages of accretion in elliptical galaxies
may occur via Advection-Dominated Accretion Flows (ADAFs), characterized
by a very low radiative efficiency
(Fabian
& Rees 1995).
The ADAF scenario implies strongly self-absorbed
thermal cyclo-synchrotron emission due to a near-equipartition magnetic
field in the inner parts of the accretion flows, most easily detected at
cm to mm wavelengths. However the ADAF scenario is not the only possible
explanation of the data, and is not problem-free. Chandra X-ray
observations of Sgr A at the Galactic Center are suggestive of a
considerably lower accretion rate compared to Bondi's prediction
(Baganoff et al. 2003),
so that the very low ADAF radiative efficiency may not be required.
A stronger argument against a pure ADAF in the Galactic Center is that the emission is strongly polarized at mm/sub-mm wavelengths (Aitken et al. 2000, Agol 2000). Moreover di Matteo et al. (1999) and Di Matteo et al. (2001) found that the high-frequency nuclear radio emission of a number of nearby early-type galaxies is substantially below the prediction of standard ADAF models. The observations are more consistent with the adiabatic inflow-outflow solutions (ADIOS) developed by Blandford & Begelman (1999), whereby the energy liberated by the accretion drives an outflow at the polar region. This outflow carries a considerable fraction of the mass, energy and angular momentum available in the accretion flow, thus suppressing the radio emission from the inner regions. Both the intensity and the peak of the radio emission depend on the mass loss rate.
Tentative estimates of the counts due to these sources and of the associated small-scale fluctuations were presented by Pierpaoli & Perna (2004). As shown in Fig. 9 their model A assumes a local luminosity function (upper boundary of the cross-hatched area) higher than current estimates of the local luminosity function of all flat/inverted spectrum sources. Consistency is obtained only for their minimal model B (lower boundary of the cross-hatched area).
