Copyright © 2004 by Annual Reviews. All rights reserved
| Annu. Rev. Astron. Astrophys. 2004. 42:
603-683 Copyright © 2004 by Annual Reviews. All rights reserved |


The suggestion that some bulge-like components were built by the secular processes discussed in Sections 2 and 3 was first made by Kormendy (1982a, b). A decade later, both the evidence for evolution and the case that it can construct what we now call pseudobulges had grown substantially (Kormendy 1993). Now, after another decade, it is a struggle to review the wealth of new evidence in a single Annual Review of Astronomy and Astrophysics article.
Other early papers that focused on the building of pseudobulges by bars include Combes & Sanders (1981) and Pfenniger & Norman (1990). Two processes were discussed. One is the inward transport of gas by bars and ovals. The other involves dissipationless processes that can produce vertically thickened central components when bars suffer buckling instabilities and when disk stars scatter off of bars and are heated in the axial direction. Both processes can happen in the same galaxy and both make bulge-like components out of disk material. Therefore, we refer to the products of both processes as pseudobulges. In this section, we discuss the observed properties of pseudobulges. As discussed in Section 1.1, we need the context of the above formation mechanisms to make sense of the wealth (or plague) of detail in galactic centers.
How can we tell whether a (pseudo)bulge is like an elliptical or whether it formed secularly? The answer - and the theme of this section - is that pseudobulges retain enough memory of their disky origin so that the best examples are easily recognizable. Before HST, the cleanest evidence was dynamical (Kormendy 1993). Pseudobulges are more dominated by rotation and less dominated by random motions than are classical bulges and ellipticals. This evidence remains compelling (Sections 4.6 and 4.7). However, as a result of spectacular progress from HST imaging surveys, morphology and surface photometry now provide the best evidence for disk-like bulges. We begin with these surveys.
4.1. Embedded Disks, Spiral Structure, and Star Formation
Central to our image of bulges as elliptical galaxies living in the middle of a disk is their morphological resemblance to ellipticals. Central to our growing awareness that something different is going on in late-type galaxies is the observation that their high-surface-brightness centers look nothing like ellipticals. Instead, they are dominated by young stars and disk structure. This is especially true in barred and oval galaxies, that is, in the objects in which secular evolution should be most rapid.
What are we looking for?
A clear statement that classical bulges are equivalent to ellipticals is provided by Sandage & Bedke (1994) in their description of E/S0 galaxies: "On short-exposure plates showing only the central regions, no evidence of a disk ... is seen; the morphologies of the central regions are pure E." The section on elliptical galaxies contains this caution: "The presence or absence of dust is not used as a classification criterion. Some E galaxies ... have dust patches and remain classified as E types." The same is true for bulges; e.g., S0 galaxies range from dustless (S01) to dusty (S03), but all have bulges. We need to be careful that what we identify as pseudobulges are not just dust features or the outer disk extending inside a classical bulge all the way to the center. On the other hand, part of the definition of an elliptical, hence also of a bulge, is that "There is no recent star formation, inferred from the absence of luminous blue and red supergiants." Even of Sab galaxies, Sandage & Bedke (1994) say that "the central bulge is ... nearly always devoid of recently formed stars." Of course, old bulges must have contained young stars in the past; these definitions - and the Hubble sequence - are understood to apply to present-day galaxies and long after major mergers are completed. But ubiquitous ongoing star formation is a pseudobulge signature.
Turning to pseudobulges, Kormendy (1993) noted that the prototypical oval galaxy NGC 4736 has a disk-like bulge: "The central brightness profile ... is an r1/4 law that reaches the high central surface brightness characteristic of a bulge (Boroson 1981). However, the r1/4-law component shows a nuclear bar and spiral structure to within a few arcsec of the center. Bars are disk phenomena. More importantly, it is not possible to make spiral structure in a bulge. Thus the morphology already shows that the r1/4-law profile belongs to the disk." This conclusion is consistent with dynamical evidence shown in Figure 17 and with the nuclear star-formation ring shown in Figure 8.
Sandage (1961) commented similarly and presciently about flocculent spirals, including NGC 4736, in his description of NGC 5055: "The curious and significant feature of [these galaxies] is the sharp discontinuity of surface brightness of the spiral pattern between the inner and the outer regions [close to the center]. The spiral structure is as pronounced and well defined in the bright region as in the outer parts. The important point here is that, if the inner arms were to coalesce and to lose their identity as spiral arms, the region would look amorphous, would have a high surface brightness, and would resemble the central regions of NGC 2841 [a classical bulge] ... and all members of the E and S0 classes." The observation that the spiral structure is as pronounced in the bright region as in the outer parts has important implications. If a high-surface-brightness classical bulge were projected in front of the (relatively faint) inward extrapolation of the outer disk, it would dilute the spiral structure. This is not seen. Therefore it is the high-surface-brightness component that contains the spiral structure. Again, this is a pseudobulge signature.
HST spatial resolution reveals disk structure in the bulge-like central regions of surprisingly many galaxies. Carollo and collaborators carried out a snapshot survey of 75 S0-Sc galaxies with WFPC2 and the F606W filter approximating V band (Carollo et al. 1997, 1998; Carollo & Stiavelli 1998; Carollo 1999) and of 78 galaxies with NICMOS F160W approximating H band (Carollo et al. 2001, 2002; Seigar et al. 2002). Figures 10 - 13 show pseudobulges from these papers. What is remarkable about these generally Sb and Sbc galaxies is how often the central structure looks like a smaller version of a normal, late-type disk.
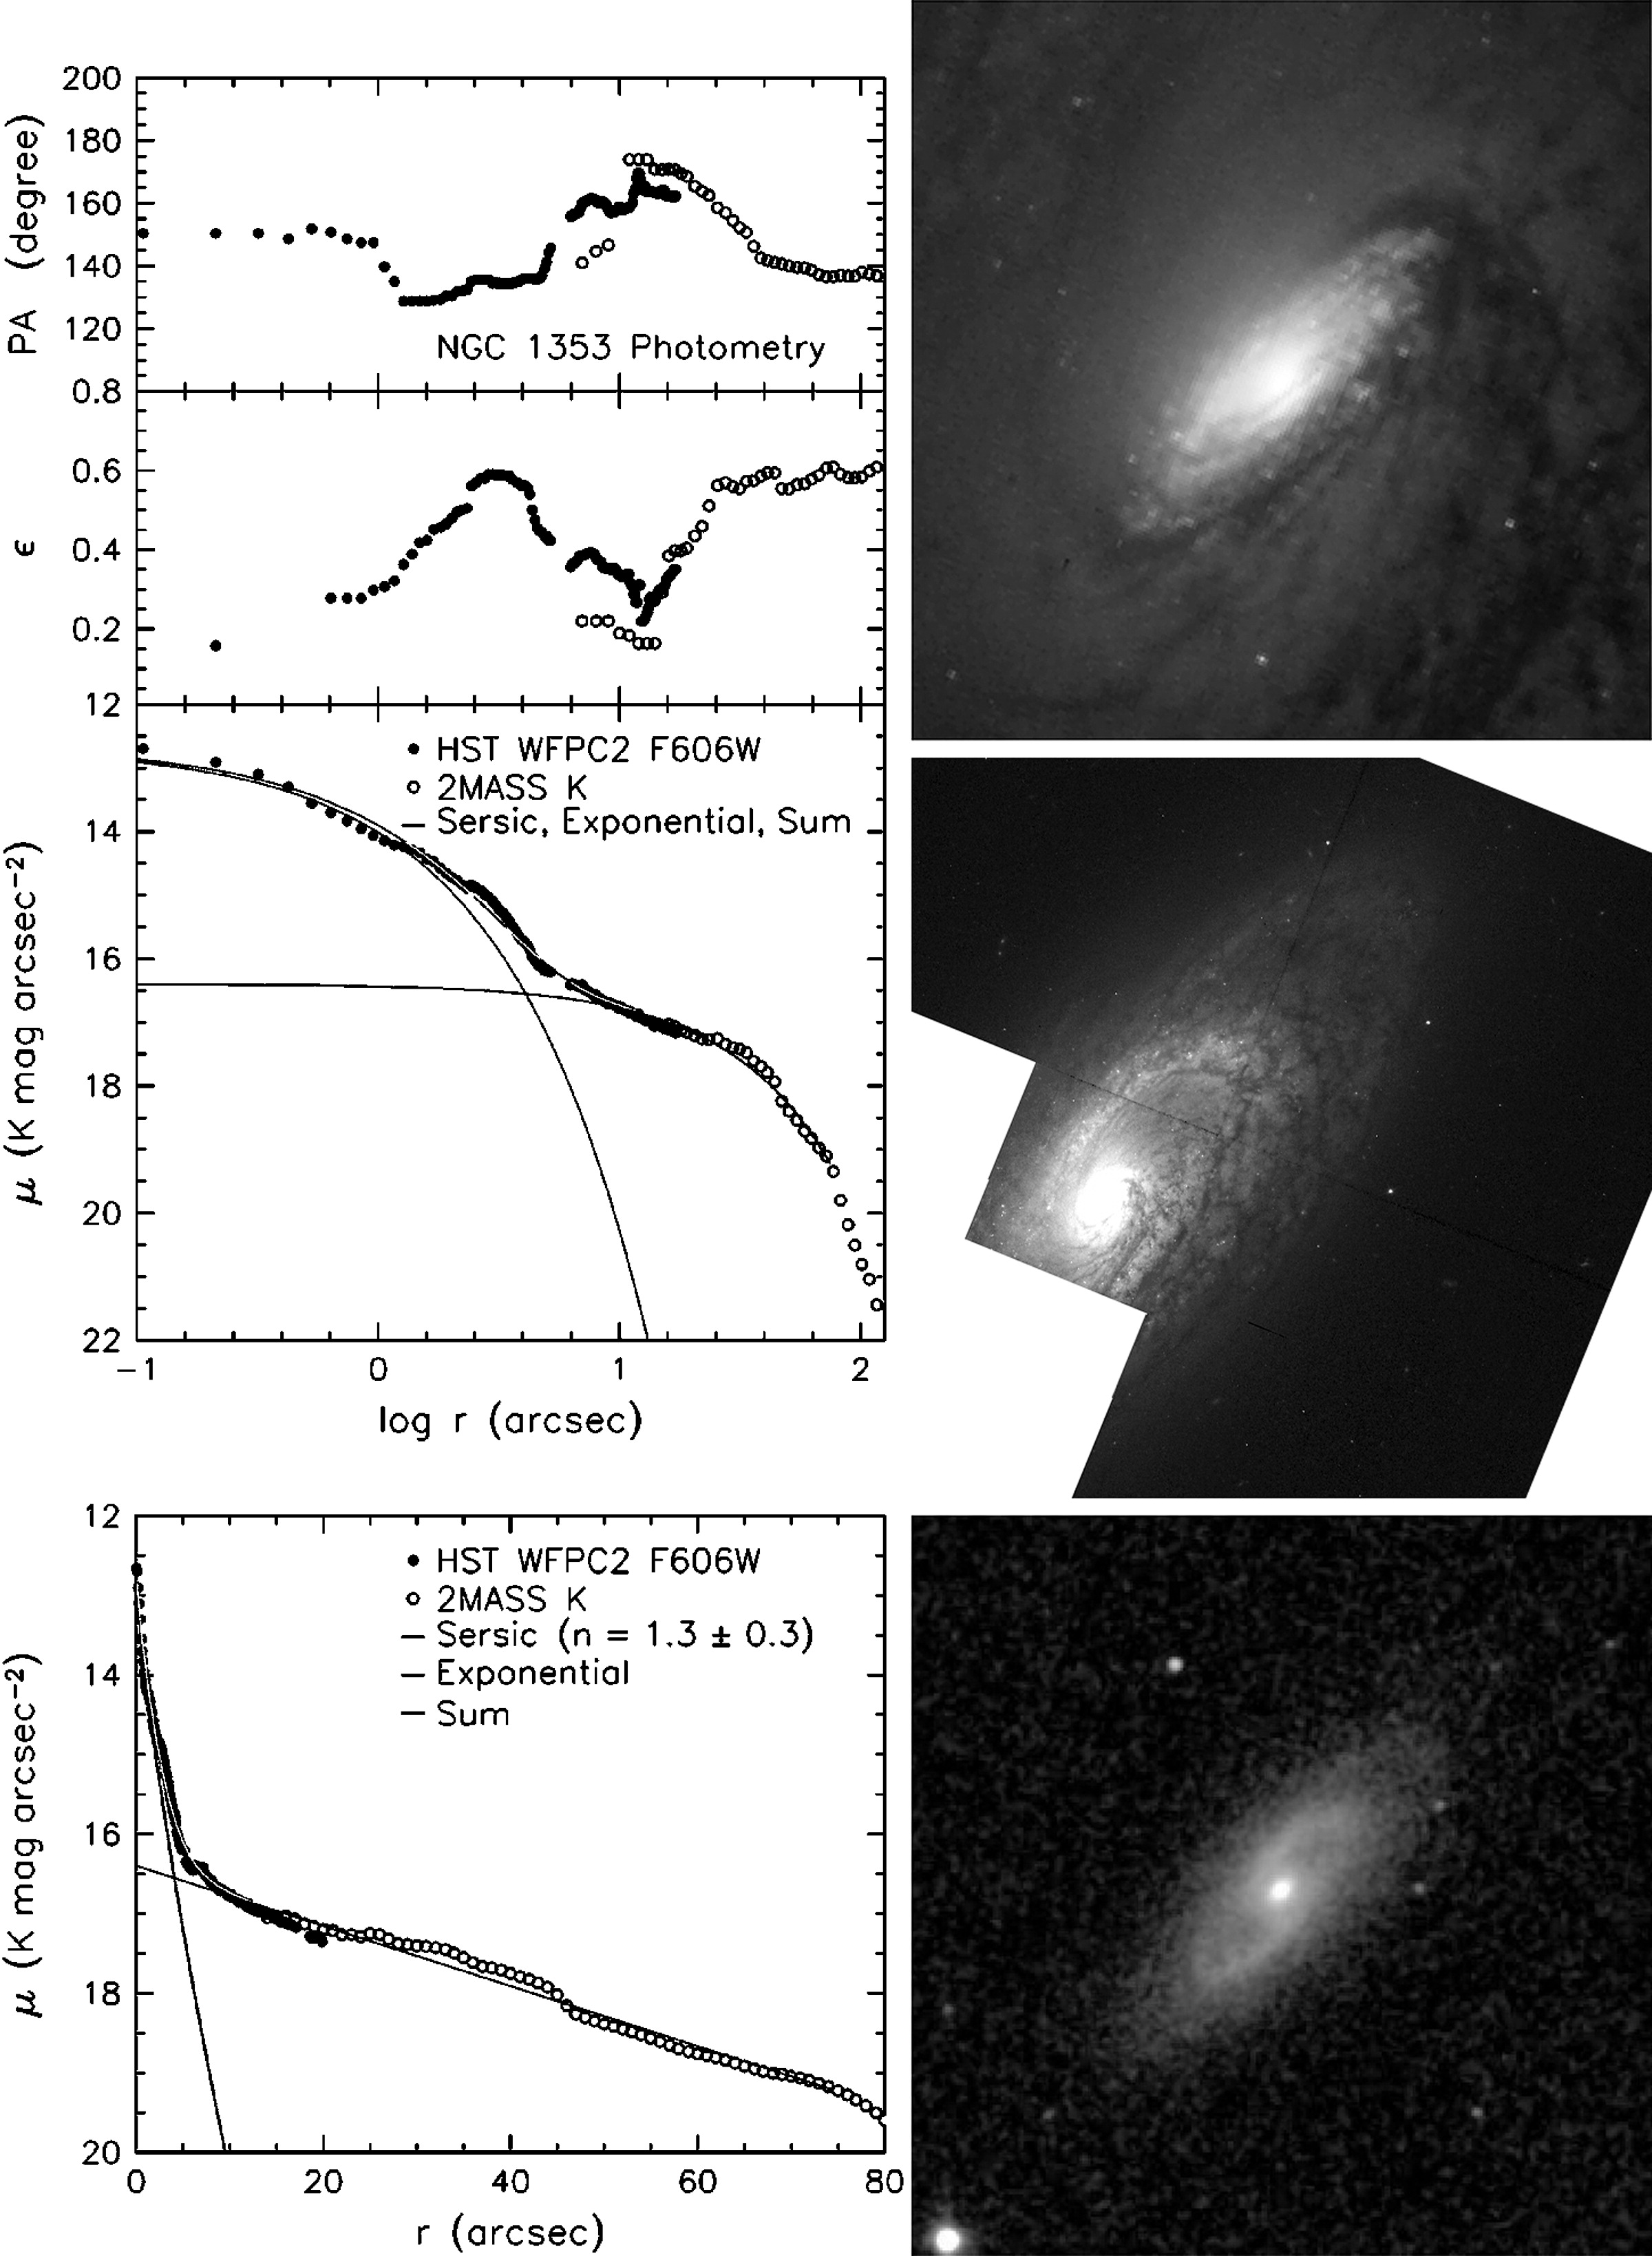 |
Figure 10. NGC 1353 pseudobulge. Top image: 18" × 18" zoom; middle: full WFPC2 F606W image taken with HST by Carollo et al. (1998). The bottom panel is a 2MASS (Jarrett et al. 2003) JHK composite image with a field of view of 4'.4 × 4'.4. The plots show surface photometry with the HST profile shifted to the K-band zeropoint. The lines show a decomposition of the major-axis profile into a Sérsic (1968) function and an exponential disk. The outer part of the pseudobulge has the same apparent flattening as the disk. This nuclear disk produces much of the rapid upturn in surface brightness toward the center. |
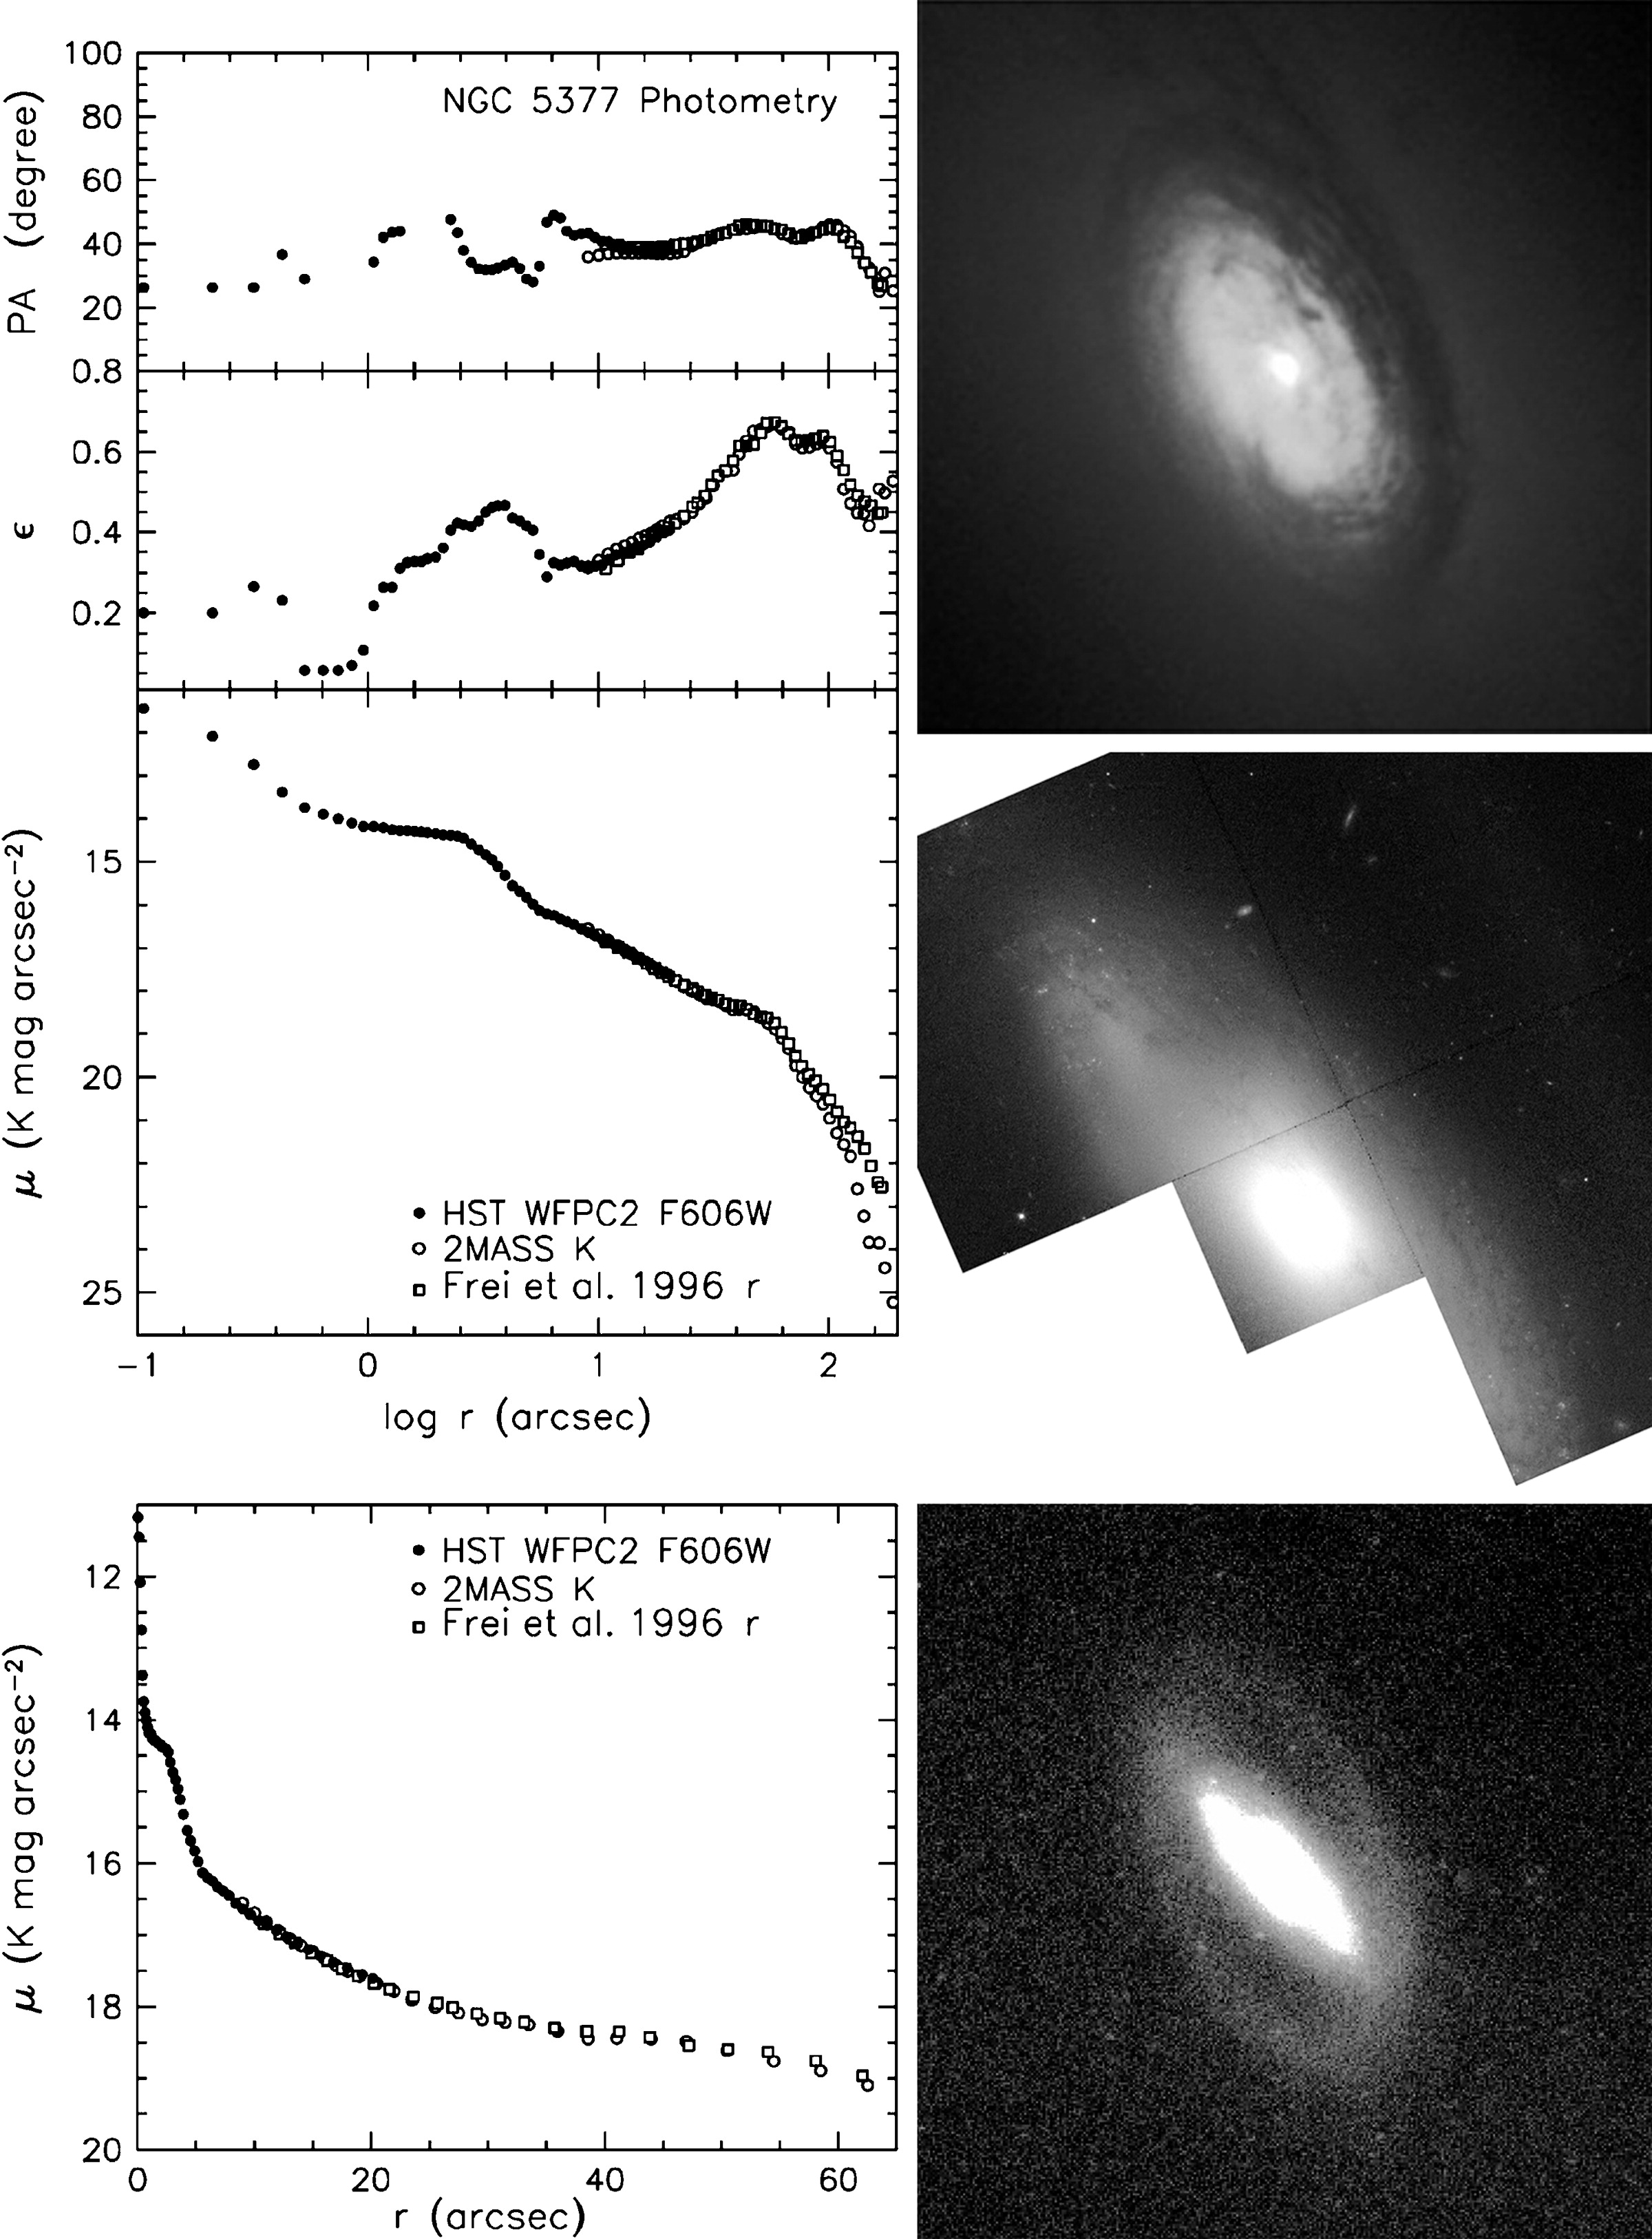 |
Figure 11. NGC 5377 pseudobulge. Top image: 18" × 18" zoom; middle: full WFPC2 F606W image taken with HST by Carollo et al. (1998). At the bottom is a 7' × 7', r-band image of the outer ring (Frei et al. 1996). The plots show surface photometry of the HST/, r-band, and 2MASS JHK composite images, all shifted to the 2MASS, K-band zeropoint. The two shelves in the brightness profile are the nuclear disk and inner oval. The nuclear disk has the same apparent flattening and orientation as the outer ring. It may be embedded in a less obviously disky bulge, but it produces a rapid upturn in surface brightness toward the center. |
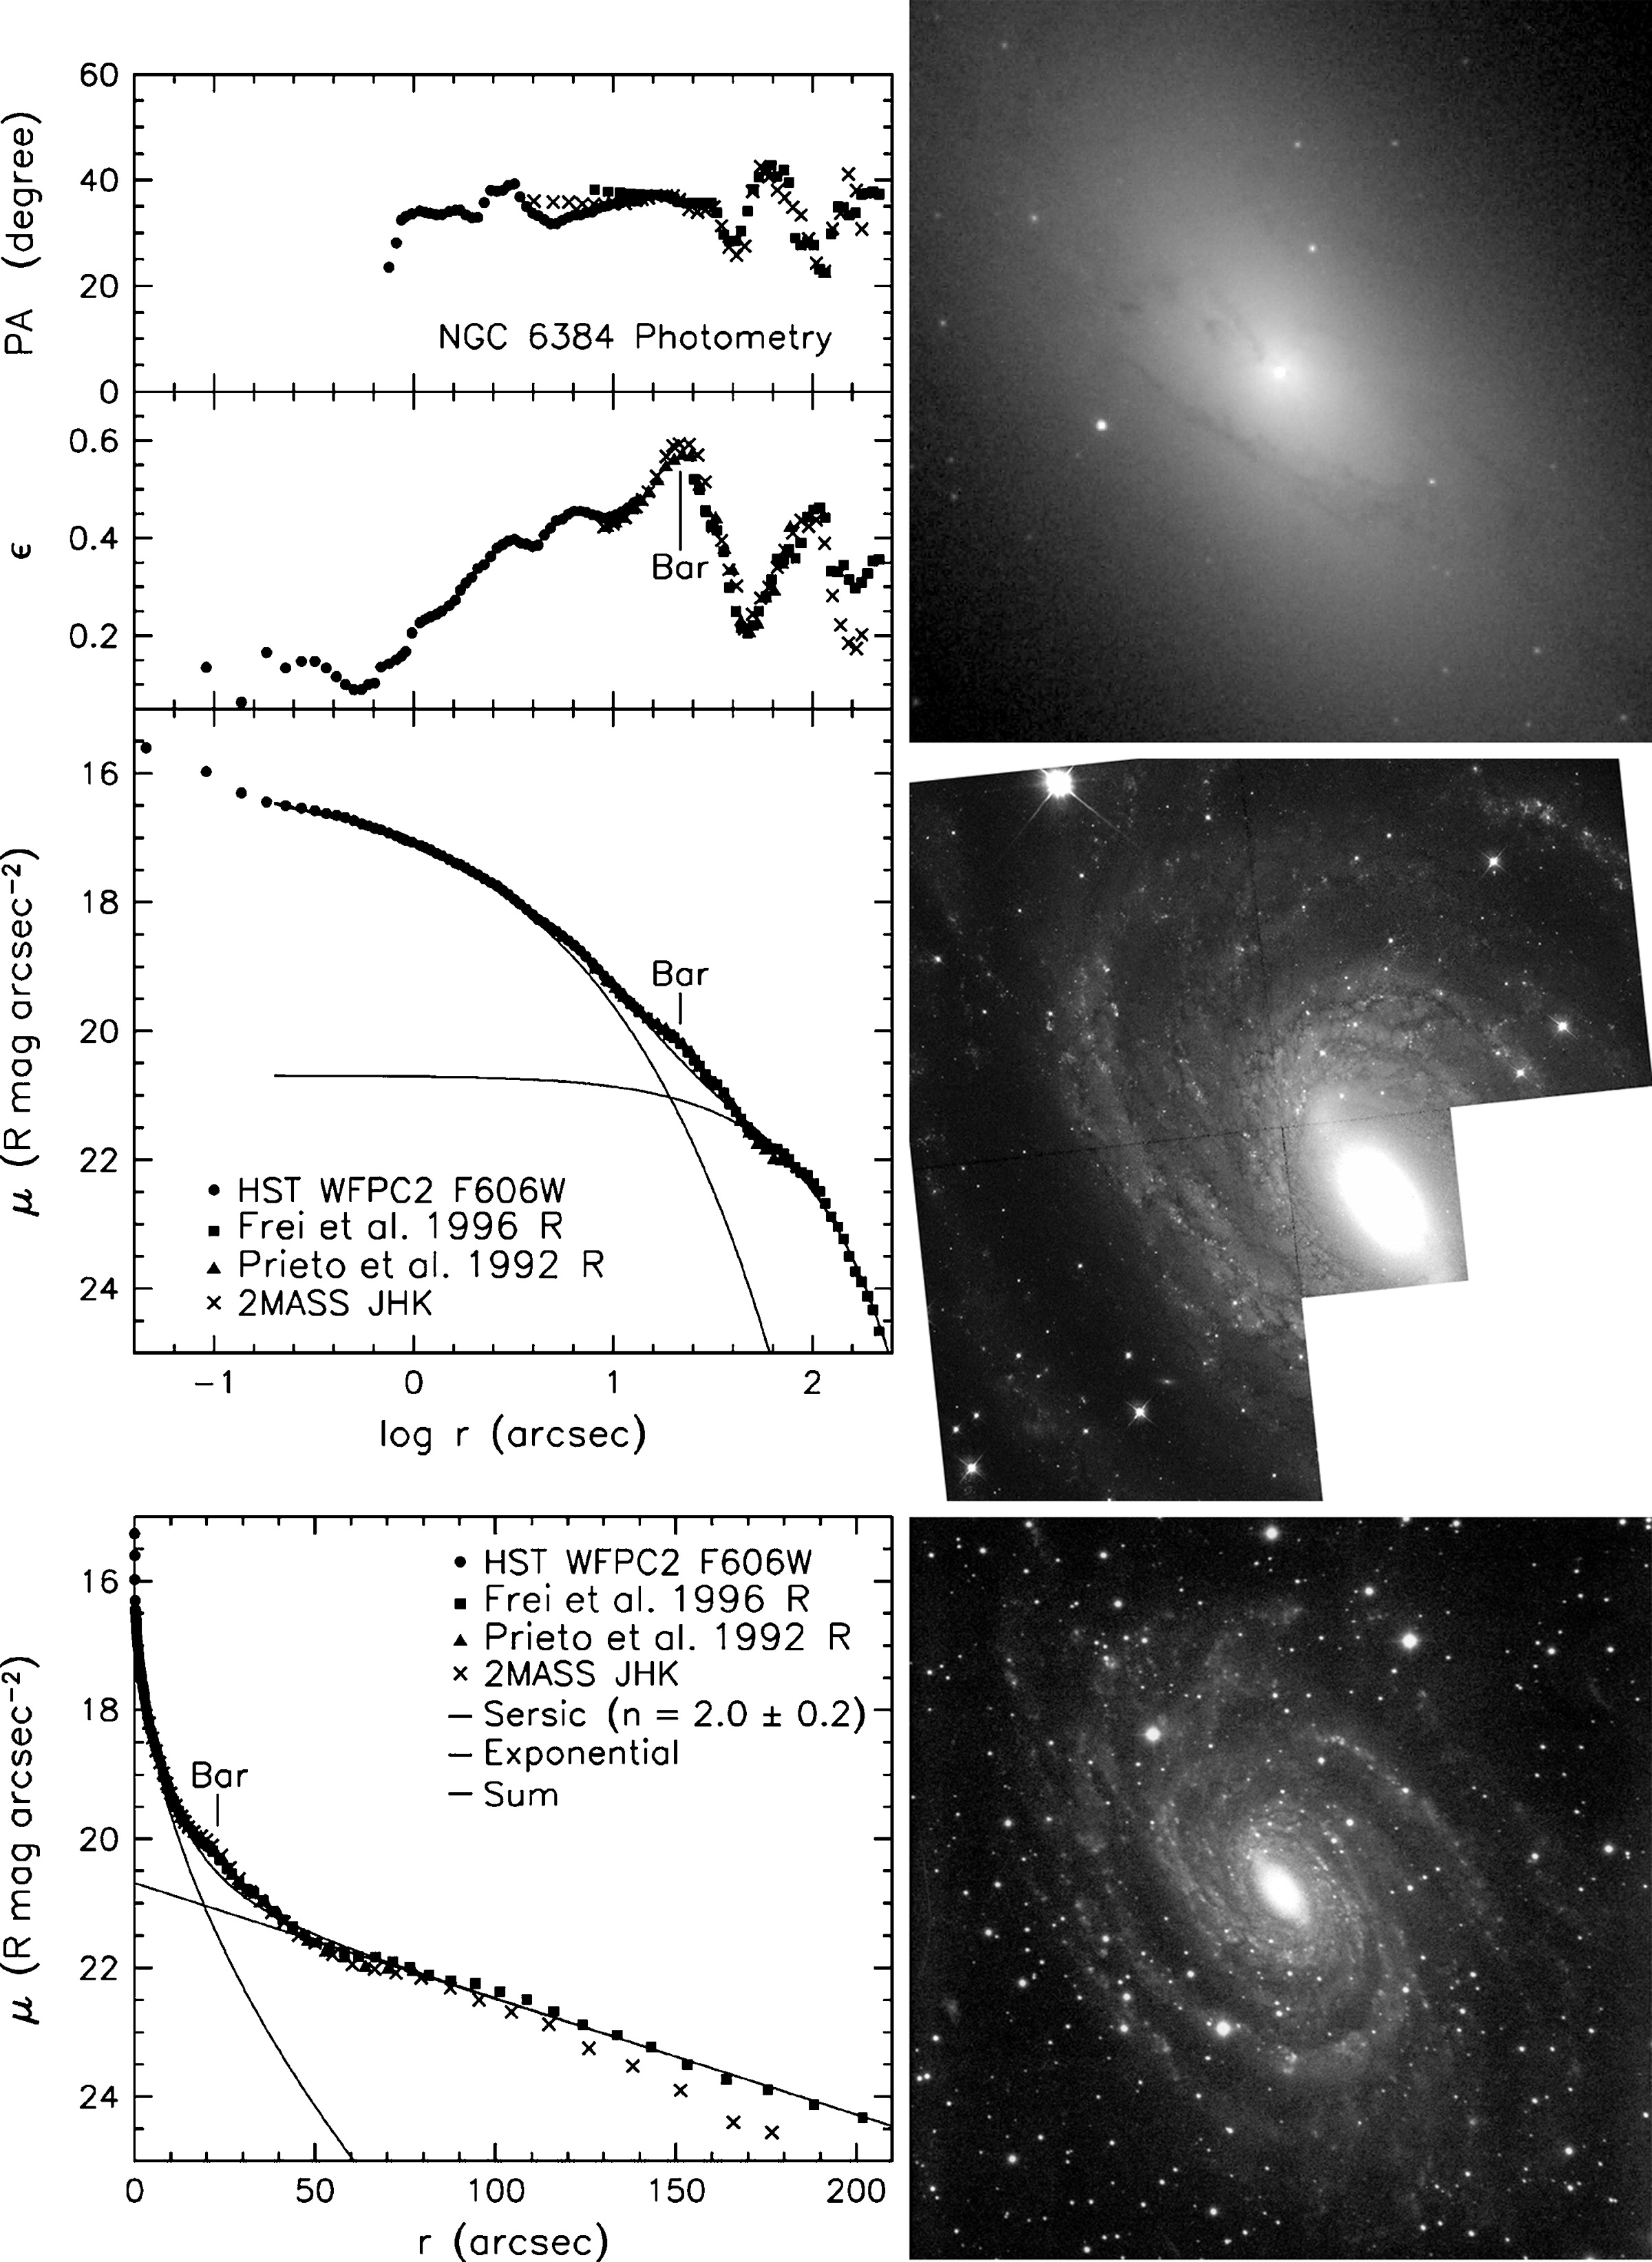 |
Figure 12. NGC 6384 pseudobulge. Top image: 18" × 18" zoom; middle: full WFPC2 F606W image taken with HST by Carollo et al. (1998). At the bottom is the B-band image from the Carnegie Atlas of Galaxies (Sandage & Bedke 1994). The top, middle, and bottom panels are shown with logarithmic, square root, and linear stretches. The plots show surface photometry of the HST and other images identified in the key, all shifted to the R-band zeropoint. The decomposition into a Sérsic function bulge and exponential disk is done over a radius range that omits the region 12" < r < 40" affected by the bar. |
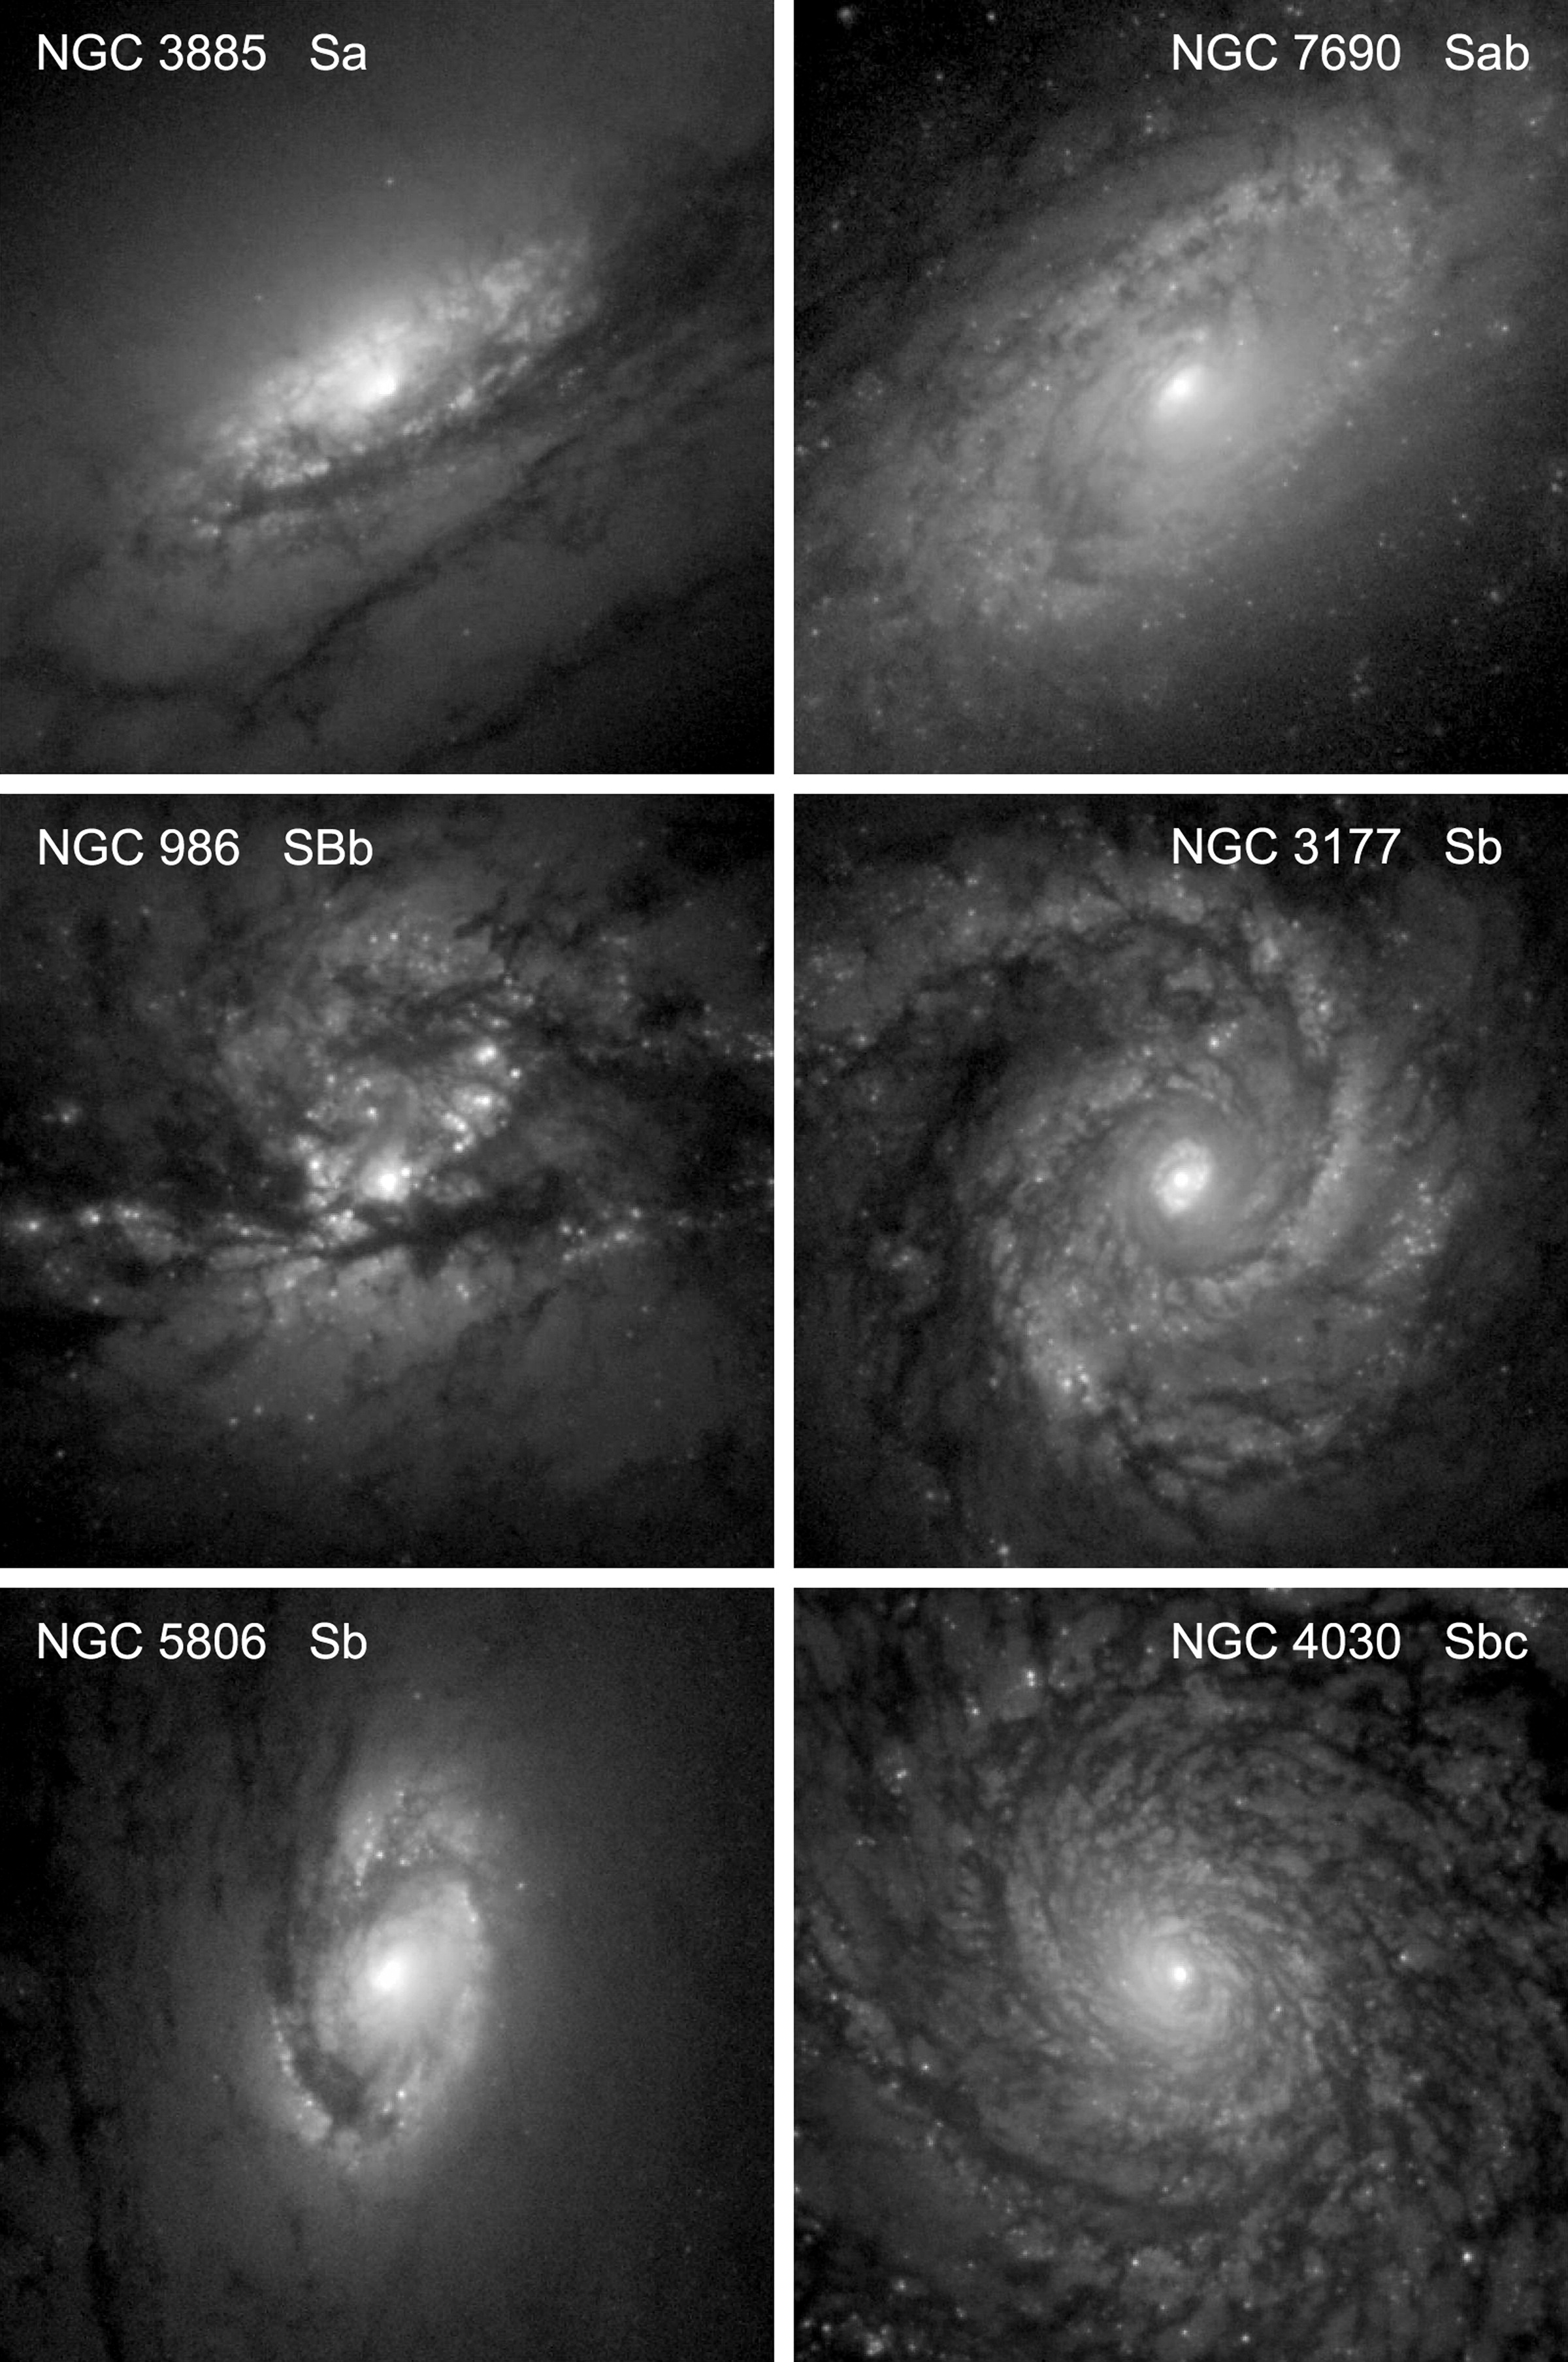 |
Figure 13. Sa-Sbc galaxies whose "bulges" have disk-like properties. Each panel shows an 18" × 18" region centered on the galaxy nucleus and extracted from HST WFPC2 F606W images taken and kindly provided by Carollo et al. (1998). North is up and east is at left. Displayed intensity is proportional to the logarithm of the galaxy surface brightness. Hubble types are from Sandage & Bedke (1994), except for NGC 4030; its type is from the RC3 and was checked using high-quality images posted on NED. |
NGC 1353 (Figure 10) is one
of the clearest examples. The top-right panel shows the central 18"
× 18" of the PC image
(Carollo et al. 1997,
1998).
The middle panel is the full WFPC2 field of view, and the bottom image
is a JHK-band composite from the 2MASS survey
(Jarrett et al. 2003).
The images show, as Carollo and collaborators concluded, that the
central structure in NGC 1353 is a disk with similar flattening and
orientation as the outer disk. To make this quantitative, we measured
the surface brightness, ellipticity, and position angle profiles in the
PC and 2MASS images using the PROFILEtool in the image processing system
VISTA
(Lauer 1985).
The left panels show that the apparent flattening at 2"
 r
4" is the same as that of the main disk at large radii. The position
angle is the same, too. So the part of the galaxy shown in the
top-right panel really is a disk. The brightness profile shows that
this nuclear disk is responsible for much of the central rise in
surface brightness above the inward extrapolation of an exponential
fitted to the outer disk. Presented only with the brightness profile or
with the bottom two panels of images, we would identify the central
rise in surface brightness as a bulge. Given
Figure 10, we identify it as a pseudobulge.
r
4" is the same as that of the main disk at large radii. The position
angle is the same, too. So the part of the galaxy shown in the
top-right panel really is a disk. The brightness profile shows that
this nuclear disk is responsible for much of the central rise in
surface brightness above the inward extrapolation of an exponential
fitted to the outer disk. Presented only with the brightness profile or
with the bottom two panels of images, we would identify the central
rise in surface brightness as a bulge. Given
Figure 10, we identify it as a pseudobulge.
We have decomposed the major-axis profile into an exponential outer disk
plus a
Sérsic (1968)
function, I(r)
 e-K[(r / re)1 / n - 1]. Here
n = 1 for an exponential, n = 4 for a
de Vaucouleurs (1948)
r1/4 law, and K(n) is chosen so that
radius re
contains half of the light in the Sérsic component. In
Section 4.2, we
discuss evidence that (pseudo)bulges in late-type galaxies are
generally best described by Sérsic functions with n ~
1. That is, they are nearly exponential. This behavior is
characteristic of many pseudobulges. Here we note that NGC 1353 is an
example. The best fit gives n = 1.3 ± 0.3.
e-K[(r / re)1 / n - 1]. Here
n = 1 for an exponential, n = 4 for a
de Vaucouleurs (1948)
r1/4 law, and K(n) is chosen so that
radius re
contains half of the light in the Sérsic component. In
Section 4.2, we
discuss evidence that (pseudo)bulges in late-type galaxies are
generally best described by Sérsic functions with n ~
1. That is, they are nearly exponential. This behavior is
characteristic of many pseudobulges. Here we note that NGC 1353 is an
example. The best fit gives n = 1.3 ± 0.3.
The 2MASS image and the
 and PA profiles
show that NGC 1353 contains a weak bar with a projected radius
of ~ 15" and an approximately NS orientation. This is one example among
many of the association between pseudobulges and nonaxisymmetric
features that can drive secular evolution. In visible light, the galaxy
is classified SBb by
de Vaucouleurs et
al. (1991)
and Sbc by
Sandage & Bedke
(1994).
and PA profiles
show that NGC 1353 contains a weak bar with a projected radius
of ~ 15" and an approximately NS orientation. This is one example among
many of the association between pseudobulges and nonaxisymmetric
features that can drive secular evolution. In visible light, the galaxy
is classified SBb by
de Vaucouleurs et
al. (1991)
and Sbc by
Sandage & Bedke
(1994).
Figure 11
shows another example. NGC 5377 is classified SBa or Sa by Sandage and
(R)SBa by de Vaucouleurs, and it easily satisfies the photometric
criteria for recognizing an oval outer disk. It is one of the
earliest-type galaxies discussed in this paper. An Sa should be
dominated by a bulge. Indeed, the brightness profile at r
1" and at about 6" to 10" is bulge-like. But the galaxy
also contains a
high-surface-brightness embedded nuclear disk that is seen as the shelf
in the brightness profile at r
 1" to 3". Again, this has approximately the same apparent flattening
and position angle as the outer disk. If a bulge is defined to be the
extra light at small radii above the inward extrapolation of the outer
disk profile, then that definition clearly includes the nuclear disk.
We prefer not to adopt this definition but rather to identify NGC 5377
as a galaxy with a substantial pseudobulge component. Whether this is
embedded in a classical bulge or whether the whole of the central rise
in surface brightness is a pseudobulge, we cannot determine from the
available data.
1" to 3". Again, this has approximately the same apparent flattening
and position angle as the outer disk. If a bulge is defined to be the
extra light at small radii above the inward extrapolation of the outer
disk profile, then that definition clearly includes the nuclear disk.
We prefer not to adopt this definition but rather to identify NGC 5377
as a galaxy with a substantial pseudobulge component. Whether this is
embedded in a classical bulge or whether the whole of the central rise
in surface brightness is a pseudobulge, we cannot determine from the
available data.
Figure 12
shows a third case study, NGC 6384. Its bar is subtle; the galaxy is
classified Sb by Sandage and SABbc by de Vaucouleurs. But the bar is
clearly visible in the WFPC2 image (middle panel).
Sandage & Bedke
(1994)
note that, "There is a smooth inner bulge ...". The
Carollo et al. (1998)
image (top panel in Figure 12)
confirms that the central brightness distribution is smooth
enough - ignoring dust - that one would ordinarily identify this as a
classical bulge. However, photometry of the PC image shows that the PA
and apparent flattening are essentially the same at 2"
r
12" as in
the outer disk. So the central component is quite flat. Also, it is
quite different from a de Vaucouleurs r1/4 law.
Carollo et al. (1998)
concluded that it is exponential. We get n
= 2.2 ± 0.2, but this does not take into account the light in the bar.
If bar stars that pass through the outer bulge were subtracted from the
profile, then n would get smaller. So the flatness of the
central component is enough to identify this as a pseudobulge, and its
small value of n contributes to the identification of
exponential profiles as a pseudobulge characteristic
(Section 4.2). NGC 6384 demonstrates that
pseudobulges can be subtle enough so that
photometry, and not just morphology, is needed to recognize them.
Further examples from Carollo et al. (1997, 1998) of disky centers in Sa-Sbc galaxies are shown in Figure 13. They look like miniature late-type galaxies. But they occur where the surface brightness rises rapidly above the inward extrapolation of the outer disk profile. This is not obvious in Figure 13 because we use a logarithmic intensity stretch so that we can show the structure over a large range in surface brightness. Spiral structure is a sure sign of a disk. Carollo et al. (1997) conclude that these observations "support scenarios in which a fraction of bulges forms relatively late, in dissipative accretion events driven by the disk."
The statistics of the Carollo sample suggest that
pseudobulges are surprisingly common. In the following summary, we
distinguish classical bulges that are well described by
r1/4
laws from pseudobulges that show at least one of the following
characteristics: they are flat or are dominated by disk morphology such
as spiral structure; they are vigorously forming stars; or they have
surface brightness profiles that are best described by Sérsic
functions with n
2. In a few
cases, observing n
1 caused us to
reclassify a "regular bulge" in Carollo et al.
(1997,
1998)
as a pseudobulge. Also, we use the mean of the classifications given in
the RC3 and in the UGC/ESO-LV
(Nilson 1973,
Lauberts &
Valentijn 1989).
Then in the above sample of 75 galaxies, classical bulges are seen in
69% of 13 S0-Sa galaxies, 50% of 10 Sab galaxies, 22% of 23 Sb
galaxies, 11% of 19 Sbc galaxies, and 0% of 10 Sc and later-type
galaxies. Most of the rest are pseudobulges or have a substantial
pseudobulge component added to a classical bulge. In some cases, there
is only a compact nuclear star cluster added to a late-type disk; it is
not clear whether the same secular evolution processes make these (see
Section 4.9). Distinguishing classical bulges from
pseudobulges is
still an uncertain process. Even the morphological types are sometimes
inconsistent between the RC3 and the UGC by several Hubble stages.
However, it is unlikely that the conclusions implied by the above
statistics are seriously wrong. As noted by Carollo et al.
(1997,
1998),
most early-type galaxies appear to contain classical bulges; these
become uncommon at types Sb and later, and essentially no Sc or
later-type galaxy has a classical bulge.
Kormendy (1993)
reached similar conclusions.
So an HST V-band survey shows that disky bulges are more common than ground-based data suggested. Clearly it is desirable to check this result. An H-band HST NICMOS survey by Carollo et al. (2002) and by Seigar et al. (2002) complements the V-band survey in several ways. The images are less affected by dust. Classification of nuclear disks is easier. The infrared images are less sensitive to star formation, but Carollo et al. (2002) compensate by including V - K color images. The infrared survey confirms the V-band results. Additional imaging studies that reveal central disk structures, dust, or star formation in disk galaxies include van den Bosch, Jaffe & van der Marel (1998); Peletier et al. (1999); Erwin & Sparke (1999, 2002, 2003); Hughes et al. (2003); Martini et al. (2003); Fathi & Peletier (2003), Erwin et al. 2003, and Erwin (2004).
We do not mean to imply that a bulge is always either purely classical or purely pseudo. We cannot tell from available data how much of a classical bulge underlies the pseudobulge component in S0-Sbc galaxies. Indications (e.g., Figure 11) are that the classical bulge component in many early-type galaxies is significant even when an embedded disky structure is recognized. If our formation picture is correct, then there is every reason to expect that secular evolution often adds disky material to a classical bulge that formed in a prior merger. The relative importance of mergers and secular evolution needs further investigation.
At a more subtle level, some galaxies that are dominated by classical bulges contain nuclear disks that contribute a negligible fraction of the galaxy luminosity. These may be cases in which secular evolution produced only a trace effect. Alternatively, they may be later-type examples of the embedded disks seen in elliptical galaxies. If so, they cannot be a result of disk-driven secular evolution. They are discussed in Section 8.3.
The pseudobulge galaxies NGC 1353 and NGC 6384
(Figures 10 and )
have nearly exponential bulge profiles.
Andredakis & Sanders
(1994)
discovered that this is a general phenomenon: The bulges of late-type
galaxies are better described by exponentials than by
r1/4-law surface brightness profiles.
Andredakis, Peletier
& Balcells (1995)
generalized this result and showed that the index n of a
Sérsic (1968)
function fitted to the central profile varies from n
3.7 (standard deviation
= 1.3) in S0 and S0/a bulges to n
2.4 (standard deviation
= 0.66) in Sa-Sb galaxies to n
1.6 (standard deviation = 0.52) in Sbc-Sd galaxies. "For Sc and later,
the profiles are very close to pure exponentials." An example of an Sbc
with an exponential bulge is our Galaxy
(Kent, Dame &
Fazio 1991).
The above trend parallels the trend that pseudobulges get more common in
later-type galaxies. Evidently small n values are pseudobulge
signatures.
The time was right for Sérsic functions to become the canonical fitting function for bulges and ellipticals. Caon, Capaccioli & D'Onofrio (1993) had recently demonstrated that Sérsic functions fit ellipticals and bulges better than do r1/4 laws. They note that this is not a surprise, because r1 / n profiles have three parameters, while r1/4 laws have only two. The argument that n has physical meaning is the observation that it correlates with the effective radius re and total absolute magnitude MB, bulge of the elliptical or bulge. This was confirmed by D'Onofrio, Capaccioli & Caon (1994); Graham et al. (1996); Binggeli & Jerjen (1998); Graham (2001); Trujillo et al. (2002) and numerous subsequent papers.
The idea that late-type (pseudo)bulges have n
1 to 2 immediately gained acceptance and got simplified in many
people's minds (and in our title) to the notion that they are
exponential. One reason was that confirmation followed quickly.
Courteau, de Jong
& Broeils (1996)
carried out bulge-disk decompositions for 243 galaxies from
Courteau (1996a)
and 86 galaxies from
de Jong & van der
Kruit (1994)
and from de Jong
(1996a,
b).
For the Courteau sample, they conclude that "about 85% of [the] Sb's
and Sc's are best fitted by the double exponential, while the remainder
[are] better fitted with an r1/4 bulge profile." For
the de Jong sample, they conclude that 60% of the galaxies are best
modeled by a double exponential, ~ 25% (mostly Sa's and Sb's) are best
modeled with n = 2 and only ~ 15% are best fitted by an
r1/4
law. These results are broadly consistent with the statistics in
Section 4.1, which refer to a different galaxy sample
and which are partly based on morphology and partly on Sérsic
function indices.
As a diagnostic of formation processes, Courteau et al. (1996) went on to examine the ratio hb / hd of the scale lengths of the inner and outer exponentials. For the combined sample, they found that hb / hd = 0.08 ± 0.05, and for the de Jong sample, they found that hb / hd = 0.09 ± 0.04. From this, they concluded, "Our measurements of exponential stellar density profiles [in bulges] as well as a restricted range of [bulge-to-disk] scale lengths provide strong observational support for secular evolution models. Self-consistent numerical simulations of disk galaxies evolve toward a double exponential profile with a typical ratio between bulge and disk scale lengths near 0.1 (D. Friedli, private communication) in excellent agreement with our measured values" (see Courteau et al. 1996 for details). MacArthur, Courteau & Holtzman (2003) found that hb / hd = 0.13 ± 0.06 for late-type spirals and again noted the connection with secular evolution. We can add one more connection. The above ratios of hb / hd, together with the observation that bars are typically about 1 scale length hd long (e.g., Kormendy 1979b), imply that the scale length of the inner exponential is similar to the radius of star-forming rings (Figure 8) discussed in Section 2.3. We suggested there that these rings are building pseudobulges.
There is a caveat: An examination of the above papers shows that many bulges in late-type galaxies rise above the disk profile by only small amounts. Leverage is limited. Even the conclusion that some bulges are exponential can be uncertain.
HST confirmation of the above results has therefore been very welcome (e.g., Phillips et al. 1996, Balcells et al. 2003, Fathi & Peletier 2003). Carollo et al. (2002) provide the best statistics. Their table 1 classifies central components as "r1/4-law," "exponential," or "not fitted" based on the V-band images. Galaxies were "not fitted" when the brightness distribution was badly affected by dust, young stars, or patchiness. One galaxy, NGC 2344, is classified as an Sc by the RC3 but has an r1/4-law bulge. Images posted on the NASA/IPAC Extragalactic Database (NED) make it clear that this galaxy is not an Sc. We adopt the UGC classification, which is Sb. With this correction, the V-band statistics are as follows: r1/4-law bulges, exponential pseudobulges, and galaxies not fitted account for the following percentages of the Hubble types indicated. S0 + Sa: 50%, 10%, 40%; Sab: 60%, 0%, 40%; Sb: 17%, 11%, 72%; Sbc: 0%, 28%, 72%; Sc: 0%, 60%, 40%; and Scd to Sm: 0%, 50%, 50% of the galaxies. When we classify the 45 galaxies that were not fitted in V-band using the H-band images and V - H images, we get 11 classical bulges and 34 pseudobulges. In most cases the classification is clear-cut; when it is not, we try to err equally often in favor of classical bulges and pseudobulges. The statistics on classical and pseudobulges then become as follows: S0 + Sa: 50%, 50%; Sab: 60%, 40%; Sb: 44%, 56%; Sbc: 6%; 94%; and Sc to Sm: 0%, 100%. The V + H-band results are in satisfactory agreement with the optical results. The majority of early-type galaxies have classical bulges; there is a sharp transition at Hubble type Sb, and later-type galaxies mostly contain pseudobulges.
Balcells (2001) reviewed implications. Andredakis (1998) commented that "The exponential bulges ... remain essentially unexplained; [the results] suggest that they ... were probably formed, at least in part, by different processes from those of early-type spirals." Even though we do not understand quantitatively how inner exponentials are built, their close association with other disky bulge phenomena supports our tentative conclusion and that of many other authors that Sérsic indices n ~ 1 are a signature of secular formation.
4.3. Some Bulges Are As Flat As Disks
In Section 4.1, we repeatedly noted that pseudobulge examples were very flat, based on observed axial ratios or spiral structure. Secular formation out of disks does not require them all to be flat (Section 7.1), but it appears that we are fortunate and that many are flat.
This is seen in the distribution of observed bulge ellipticities derived by Kent (1985, 1987a, 1988). He decomposed major- and minor-axis profiles of disk galaxies into r1/4-law bulges and exponential disks. The bulge and disk ellipticities were fit parameters that were allowed to be different. Figure 8 in Kormendy (1993) shows the following:
bulge
/ disk,
is smallest for Sas and increases toward later Hubble types. This
agrees with other evidence that pseudobulges are more common in
later-type galaxies.
bulge /
disk
for S0 galaxies is similar to that for Scs, not Sas. Kinematically
disklike bulges also are more common in S0s than in Sas
(Sections 4.6
and 4.7). Similar effects led
van den Bergh (1976b)
to develop his parallel sequence classification.
Bulge-disk decompositions should be interpreted with caution. The bulge and disk parameters are strongly coupled. Even when the bulge ellipticity is a fit parameter, it is assumed to be constant with radius; this is necessary for computational stability. But Figures 10 to 12 and other data show that this is a serious oversimplification. Also, most decompositions in the literature are not suitable. Some have too little leverage on the bulge. Nonparametric decompositions depend on the assumption that the bulge and disk have different flattenings; they force the bulge to be rounder than the disk. So we have few checks of the above results. Those that are available are consistent with points 1 to 5 but show a large dispersion in numbers. Here are two examples:
Fathi & Peletier
(2003)
carried out bulge-disk decompositions for 35 S0-Sb and 35 Sbc-Sm
galaxies based on HST NICMOS H-band images. The high
spatial resolution provides good leverage on small bulges. The results
show that
bulge /
disk
> 0.9 in 36% of S0-Sb galaxies and 51% of Sbc-Sm galaxies. This is
consistent with Kent's decompositions and confirms that flat
pseudobulges are more common in late-type galaxies.
In contrast,
Möllenhoff &
Heidt (2001)
found that only 10% of their decompositions imply
bulge /
disk >
0.9. These are K-band
measurements of a sample of S0-Sc galaxies weighted toward late Hubble
types. The galaxies are relatively face-on; this reduces sensitivity to
the flattening. However, the above results refer to the 39 galaxies
that meet the selection criterion used for points 1 to 5,
disk <
0.14. So different authors get
substantially different distributions of bulge flattening. Nevertheless,
Figures 10 - 12
clearly show that some pseudobulges are as flat as disks.
Figure 14 shows galaxies that have a secondary bar interior to the main bar. The inner bar is the component that conventionally would be identified as a bulge - its surface brightness increases rapidly toward the center, far above the inward extrapolation of the disk brightness profile. However, bars are disk phenomena. Seeing a nuclear bar is strong evidence that a galactic center is dominated by a pseudobulge.
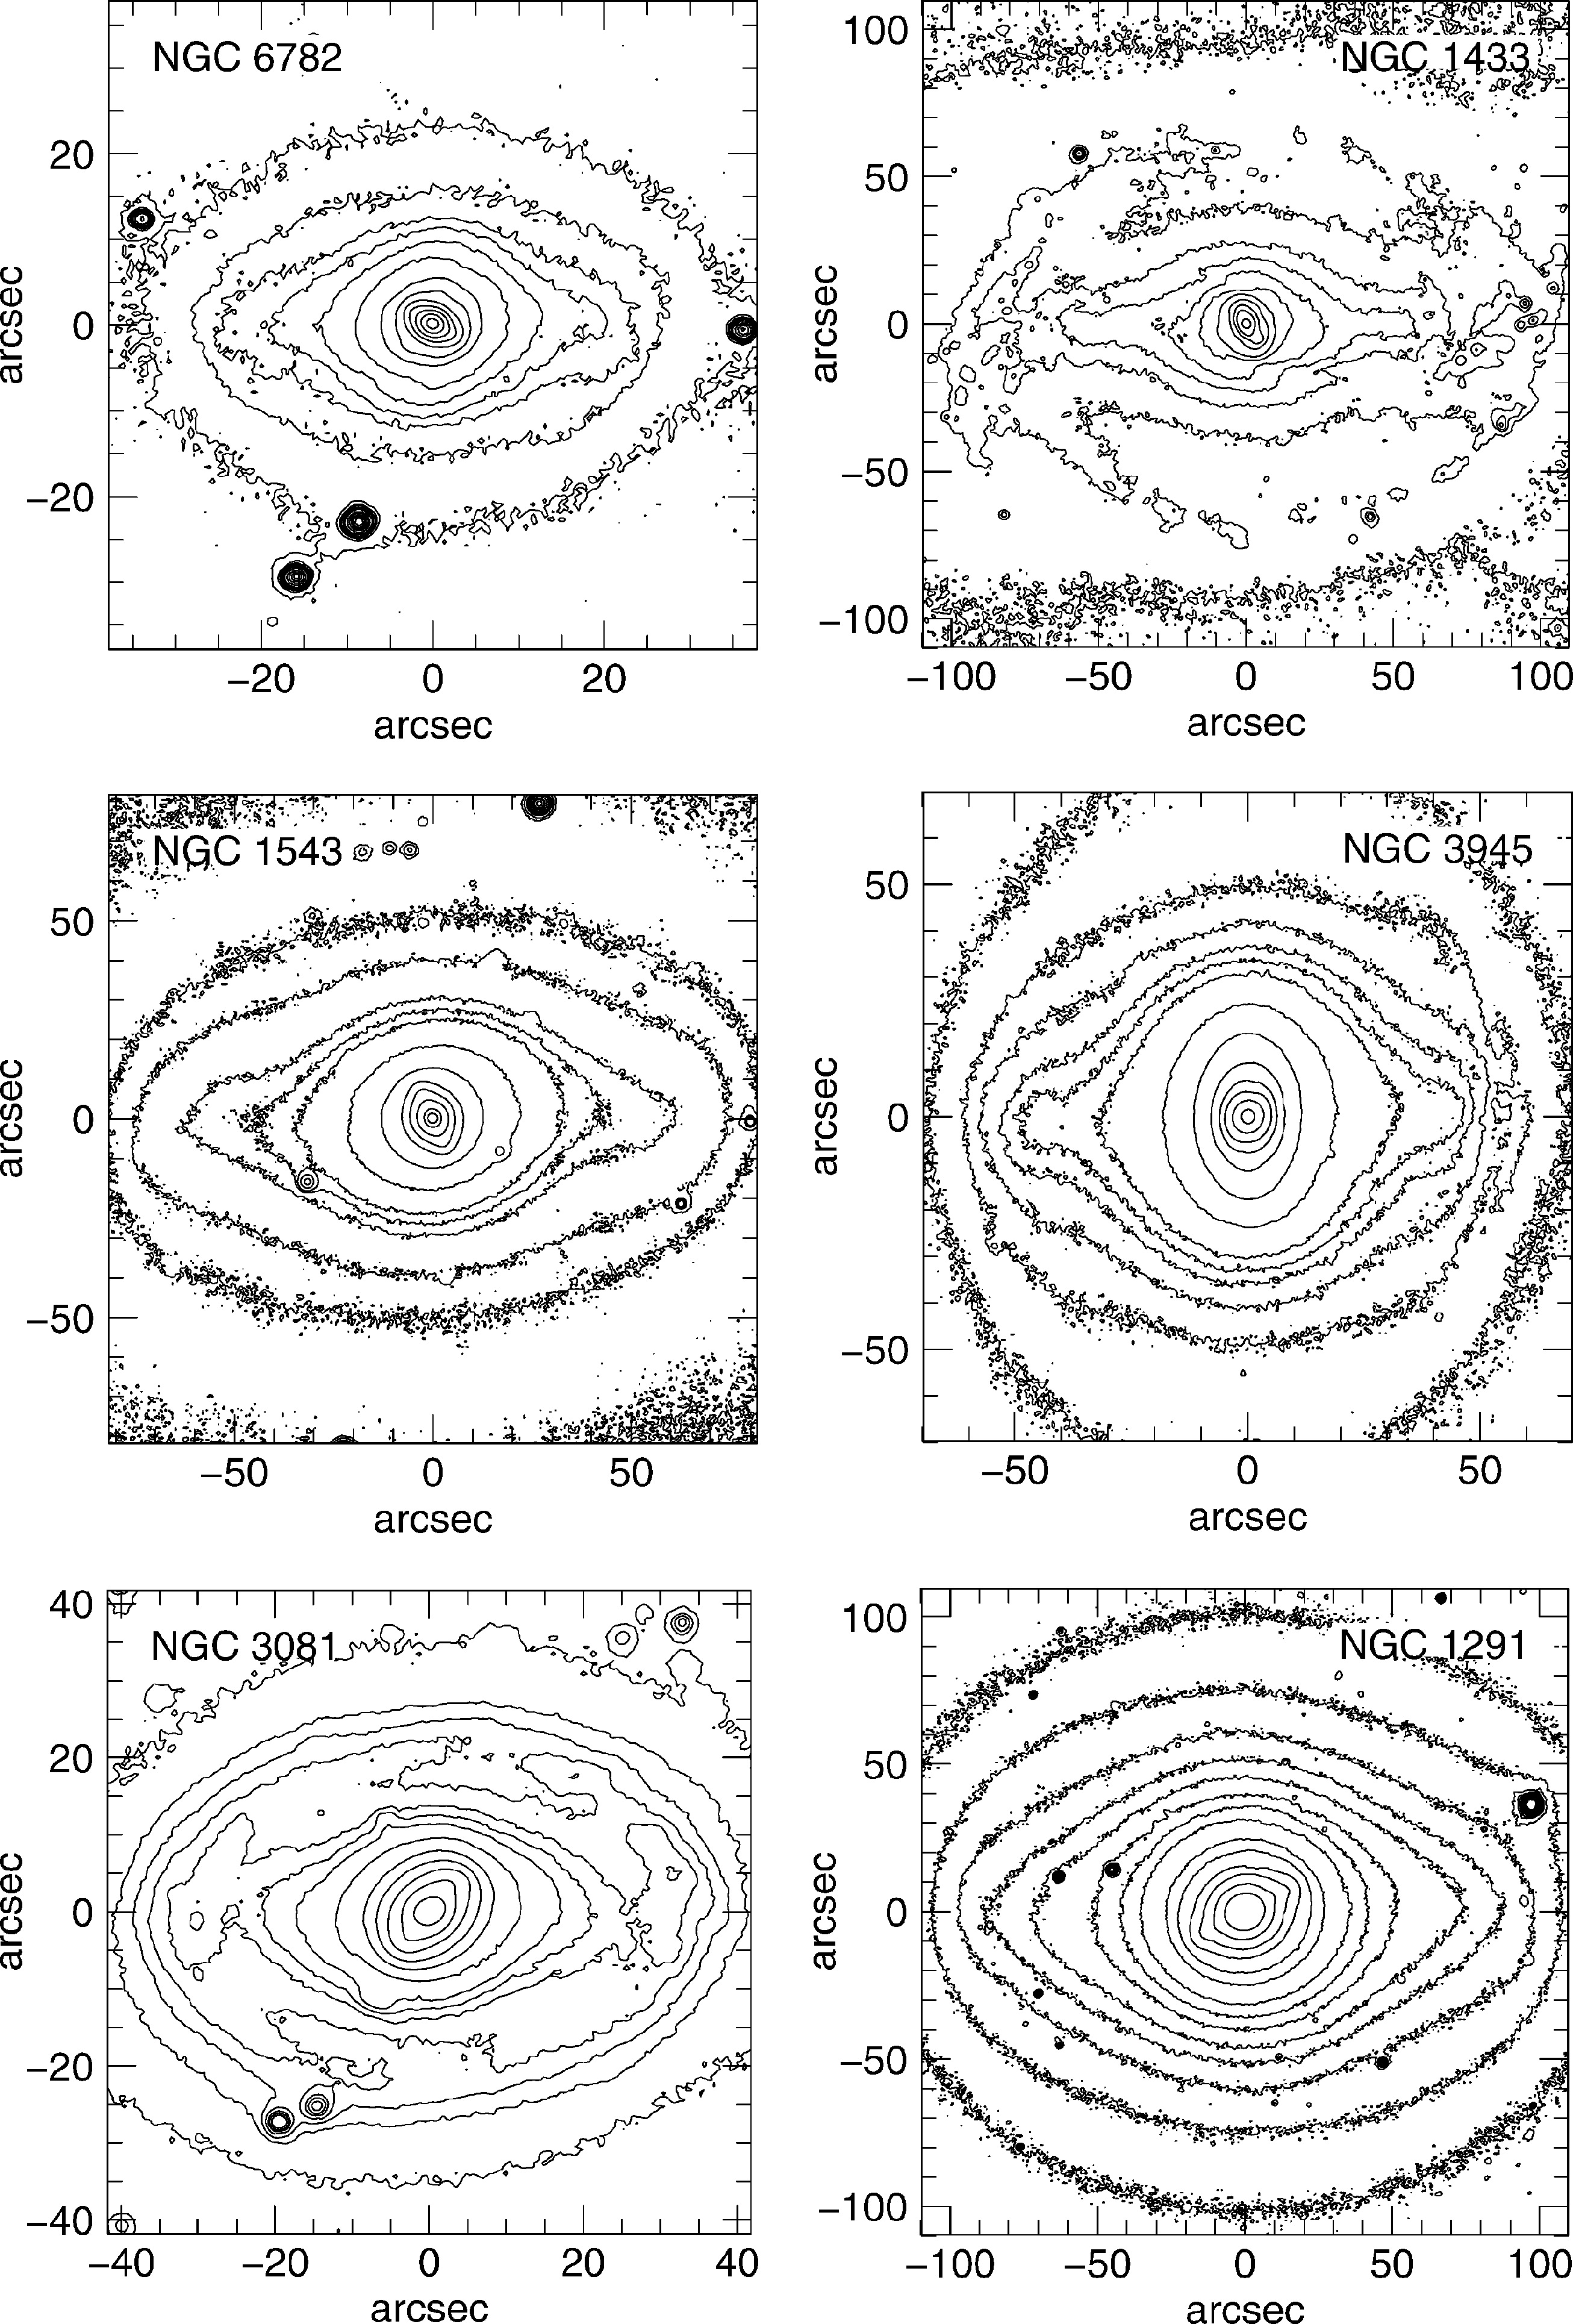 |
Figure 14. Bars within bars. Each galaxy image is rotated so that the main bar is horizontal. Contour levels are close together at large radii and widely spaced in the nuclear bars. NGC 3081 and NGC 1433 have inner rings. NGC 1291 is also shown in Figure 2, NGC 3081 and NGC 3945 in Figure 5, and NGC 6782 in Figure 8. The images are courtesy of Ron Buta. |
The nuclear bar in NGC 1291 was seen as long ago as Evans (1951). de Vaucouleurs (1975) saw nuclear bars in four of the six galaxies illustrated in Figure 14: NGC 1291, NGC 1433 (see also Sandage & Brucato 1979), NGC 1543 (see de Vaucouleurs 1959), and NGC 3081.
Other early examples are NGC 1326 (de Vaucouleurs 1974), NGC 2859, NGC 3945, NGC 7743 (Kormendy 1979b), NGC 1543 (Sandage & Brucato 1979), NGC 1317 (Schweizer 1980), and NGC 2950 (Kormendy 1981, 1982a, b). Kormendy concluded that "triaxial SB bulges and bars rotate rapidly and are therefore dynamically similar. Both are different from elliptical galaxies, which rotate slowly" [emphasis in original]. We return to these points in Section 4.6.
The number of known examples grew rapidly as work on barred galaxies accelerated (Jarvis et al. 1988; Buta 1990; Buta & Crocker 1993; Shaw et al. 1993b, 1995; Wozniak et al. 1995; Friedli et al. 1996; Jungwiert, Combes & Axon 1997; Mulchaey et al. 1997; Erwin & Sparke 1999, 2003; Márquez et al. 1999; Martini & Pogge 1999; Greusard et al. 2000; Rest et al. 2001). Erwin (2004) has compiled a catalog, and Friedli (1996) and Erwin (2004) provide reviews.
Recent studies focus on larger and more representative samples and therefore yield better estimates of what fraction of SB galaxies contain nuclear bars. Erwin & Sparke (2002) found nuclear bars in 26 ± 7% of their sample of 38 SB galaxies. They remarked that the true fraction could be as large as 40%; they could not detect nuclear bars in the (many) objects that have central dust. As in the previous section, pseudobulge features are surprisingly common. The galaxies in the above survey are S0-Sa; these are the Hubble types that are most likely to contain classical bulges.
Laine et al. (2002) analyzed HST NICMOS H-band images of a matched sample of Seyfert and non-Seyfert galaxies. The sample is slightly biased toward early Hubble types but otherwise is representative. They found that 28 ± 5% of their barred galaxies have a nuclear bar. They also found several indications that nuclear and main bars have a different origin, most notably that main bar sizes are proportional to the scale length of the disk, while nuclear bar sizes are uncorrelated with the size of the disk and almost always smaller than ~ 1.6 kpc in radius. Nuclear bars and nuclear star-forming rings have similar size distributions when normalized by the galactic diameter D25. They argued plausibly that this means that nuclear bar radii, like nuclear ring radii, are bounded approximately by ILR (see also Pfenniger & Norman 1990, Friedli & Martinet 1993).
Observations like these support the cononical hypothesis that nuclear bars form when infalling disk gas builds up a central, cold, and disky system that is sufficiently self-gravitating to become barred. How this happens is not known. One possibility is that a cold nuclear disk suffers its own bar instability, independent of that of the main bar (Friedli & Martinet 1993, Combes 1994).
A good sign that we understand the essence of nuclear bar dynamics is
the observation (Figure 14) that inner bars are
oriented randomly with respect to main bars
(Buta & Crocker
1993,
Friedli & Martinet
1993,
Shaw et al. 1995,
Wozniak et al. 1995,
Friedli et al. 1996,
Erwin & Sparke
2002).
This can be understood within the dynamical framework of
Section 2.2. At small radii,
 (r) -
(r) -
 (r)/2 reaches a
high peak in galaxies that have such high central mass concentrations. A
bar's pattern speed
p
seeks out approximately the local angular velocity
-
/ 2 at which
closed ILR orbits precess. Therefore, the pattern speeds of inner bars
are almost certainly much higher than those of main bars
4 (see
Pfenniger & Norman
1990,
Friedli & Martinet
1993,
Buta & Combes 1996,
and
Maciejewski &
Sparke 2000
for further discussion). Kinematic decoupling of main and nuclear bars
is observed by
Emsellem et al. (2001)
and by
Corsini, Debattista
& Aguerri (2003).
(r)/2 reaches a
high peak in galaxies that have such high central mass concentrations. A
bar's pattern speed
p
seeks out approximately the local angular velocity
-
/ 2 at which
closed ILR orbits precess. Therefore, the pattern speeds of inner bars
are almost certainly much higher than those of main bars
4 (see
Pfenniger & Norman
1990,
Friedli & Martinet
1993,
Buta & Combes 1996,
and
Maciejewski &
Sparke 2000
for further discussion). Kinematic decoupling of main and nuclear bars
is observed by
Emsellem et al. (2001)
and by
Corsini, Debattista
& Aguerri (2003).
Shlosman, Frank & Begelman (1989) suggested that bars within bars are a primary way to transport gas farther inward than the gravitational torque of the main bar can achieve. To fuel nuclear activity in galaxies, they envisaged a hierarchy of bars within bars. Triple bars have been seen (Friedli 1996 and Erwin & Sparke 1999 provide reviews).
NGC 4736 is an example of a nuclear bar in an unbarred but oval galaxy (Block et al. 1994; Möllenhoff, Matthias & Gerhard 1995). It emphasizes again the similarity between bars and ovals as engines for secular evolution.
Bulges with box-shaped isophotes (Figure 15) are well known (Burbidge & Burbidge 1959, Sandage 1961, de Vaucouleurs 1974). Clear examples are seen in approximately one fifth of edge-on galaxies (Jarvis 1986; Shaw 1987; de Souza & dos Anjos 1987; Lütticke, Dettmar & Pohlen 2000a). Numerical simulations universally show that bars heat themselves in the vertical direction; they suggest that box-shaped bulges are edge-on bars. If this is correct, then observing box-shaped isophotes is a sufficient criterion for identifying a pseudobulge. Probably independently of this, boxy bulges also present us with a serious collision between simulations and observations. There are at least two problems. (a) Observations imply that bars are flat in the edge-on galaxies in which they can reliably be identified. (b) Bars and boxy bulges that are clearly distinct from each other occur together in several galaxies. In these galaxies, the major-axis radii of the boxy bulges are much shorter than the lengths of the bars.
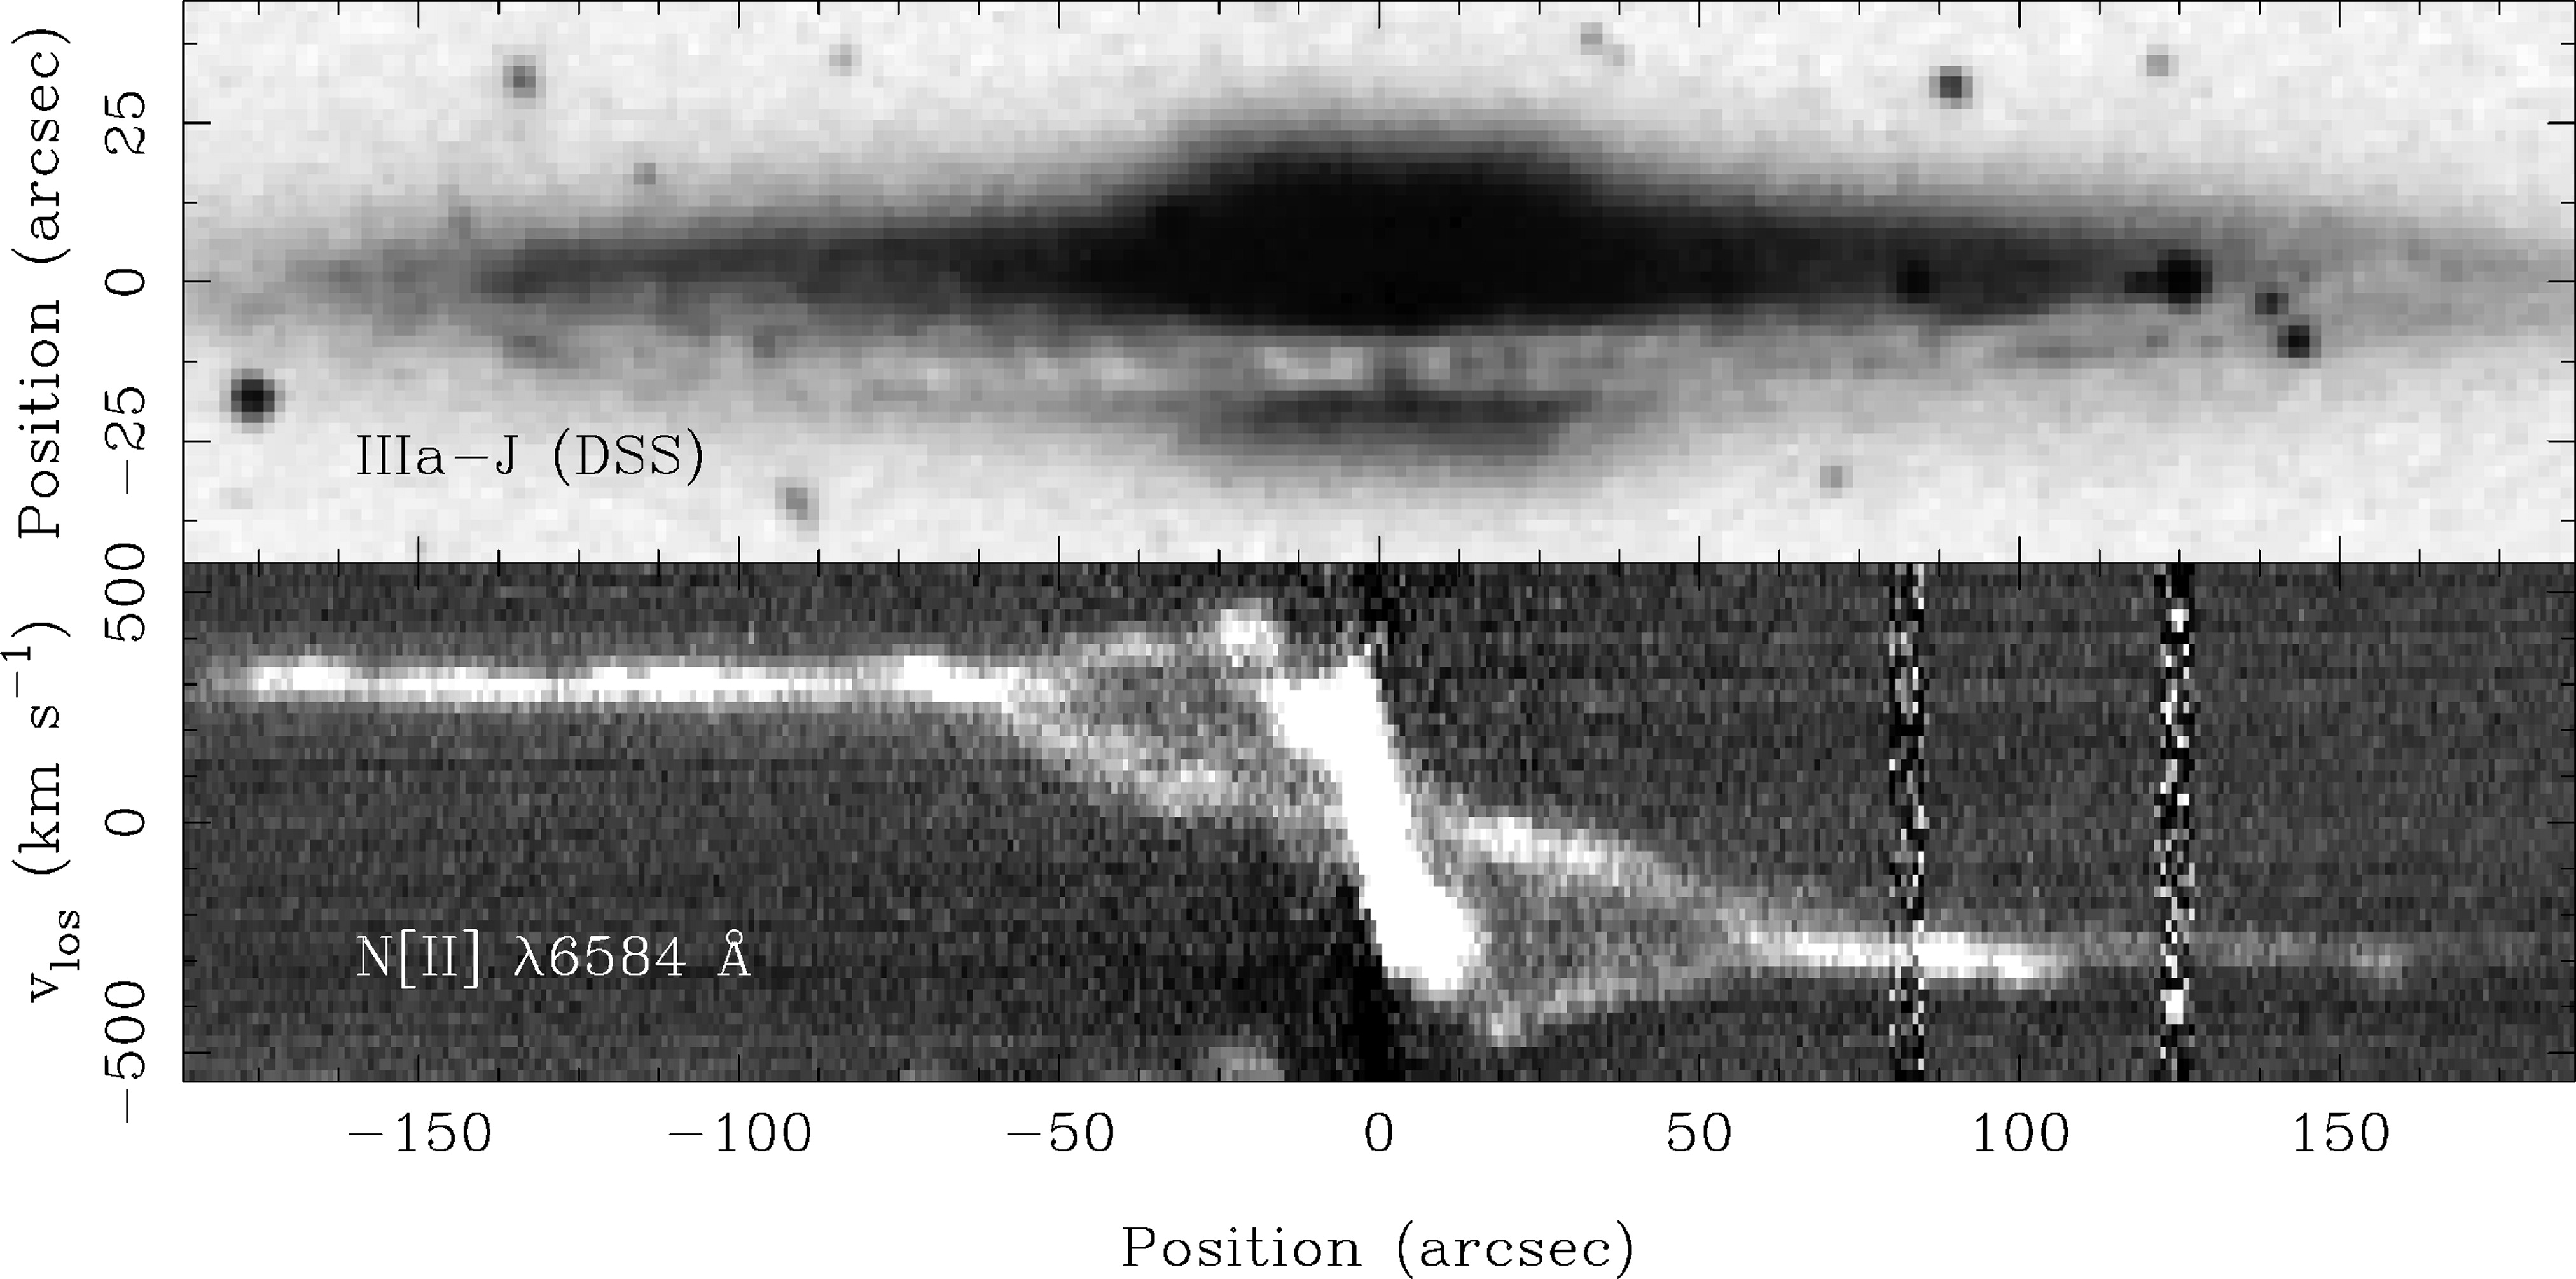 |
Figure 15. (Top) NGC 5746 (Sb) has a
prominently box-shaped bulge (see also
Sandage & Bedke
1994).
(Bottom) Position-velocity diagram of the [NII]
|
That bars heat themselves in the axial direction was an immediate result of the first three-dimensional n-body simulations of unstable disks; it has been a robust theoretical prediction ever since (see Sellwood & Wilkinson 1993 for a review). Combes & Sanders (1981) were the first to point out that n-body bars look like boxy bulges (e.g., NGC 7332) when seen end-on and like peanut-shaped bulges (e.g., NGC 128) when seen side-on (both galaxies are illustrated in Sandage 1961 and in Sandage & Bedke 1994). Edge-on n-body bars looked boxy in some previous papers (e.g., Miller & Smith 1979), but these resulted from the collapse of spherical stellar systems, so it was not clear that their vertical structure was relevant to the evolution of disks. The Combes & Sanders (1981) results have been confirmed and extended by many authors (e.g., Combes et al. 1990, Pfenniger & Friedli 1991, Berentzen et al. 1998, Athanassoula & Misiriotis 2002, Athanassoula 2003). Early papers concluded that the orbits that contribute most to the boxy structure are in vertical ILR with the bar. With two vertical oscillations for each revolution, it is easy to arrange that a star be at its maximum height above the disk plane when it is near apocenter. Then it contributes naturally to a box-shaped structure. The importance of vertical resonant heating was emphasized by Pfenniger (1984, 1985) and especially by Pfenniger & Norman (1990). From sticky-particle simulations, Pfenniger & Norman (1990) found both the mass inflow discussed earlier and vertical heating that fed stars into a component with the scale height of a bulge. Timescales were short, on the order of one tenth of a Hubble time.
In contrast, Raha et al. (1991) showed that buckling instabilities thicken bars in the axial direction. These are collective phenomena, so they are different from resonant heating. Raha et al. (1991) suggested that buckling instabilities also occurred in the above simulations; Pfenniger & Friedli (1991) acknowledged this possibility. Additional examples of buckling instabilities are in Sellwood (1993b), Kalnajs (1996), and Griv & Chiueh (1998). Further discussion is provided by Toomre (1966), Merritt & Sellwood (1994), Pfenniger (1996a), and Merrifield (1996).
However the heating happens, all of the simulators agree that bars and boxy bulges are connected. A few papers suggest only that disk stars are heated vertically and fed into the bulge (pre-existing or not), giving it a box-shaped appearance. But most authors advocate a stronger conclusion, namely that boxy bulges are nothing more nor less than bars seen edge-on.
What do the observations say? Persuasive observations show that boxy bulges occur in SB galaxies. However, they also suggest that box bulges are not identical to edge-on bars.
The obvious sanity check - that boxy bulges are seen in edge-on galaxies as frequently as well-developed bars are seen in face-on galaxies - is passed with flying colors. References are in the first paragraph of this subsection.
A link between n-body bars and boxy bulges is the observation in both of cylindrical rotation to substantial heights above the equatorial plane (see Bertola & Capaccioli 1977; Kormendy & Illingworth 1982, Jarvis 1990; Shaw, Wilkinson & Carter 1993a; Shaw 1993; Bettoni & Galletta 1994; Fisher, Illingworth & Franx 1994; D'Onofrio et al. 1999; and Falcón-Barroso et al. 2004 for the observations and Combes et al. 1990; Sellwood 1993a; Athanassoula & Misiriotis 2002 for simulations). Classical bulges and ellipticals do not rotate cylindrically, as evident from early long-slit spectroscopy (Illingworth & Schechter 1982; Kormendy & Illingworth 1982; Binney, Davies & Illingworth 1990) and now beautifully shown by integral-field spectroscopy (de Zeeuw et al. 2002; Verolme et al. 2002, Bacon et al. 2002; Copin, Cretton & Emsellem 2004; Falcón-Barroso et al. 2004).
Kuijken &
Merrifield (1995)
and
Merrifield (1996)
suggest that a kinematic signature of edge-on bars is a splitting in
the gas velocities just interior to corotation because the gas there is
depleted by radial transport. They observe such velocity splitting in
NGC 5746 and NGC 5965 and argue that both galaxies are barred.
Merrifield &
Kuijken (1999)
and
Bureau & Freeman
(1999)
show additional examples. NGC 5746 from the latter paper is shown in
Figure 15.
The "figure 8" pattern in the emission line is the bar signature. The
rapidly rotating gas is identified with a nuclear disk of
x2
orbits, and the slowly rotating component shows the line-of-sight
velocities in the disk beyond the end of the bar. The lobes of the
"figure 8" are empty because an annulus between the nuclear disk and
the end of the bar contains little gas. The idea is that the missing
gas has been transported to the center or to an inner ring at the end
of the bar. This is an interpretation: an axisymmetric disk containing
an annulus devoid of gas would also show the "figure 8." The connection
with bars is indirect: (a) in face-on galaxies, gasless annuli
are seen only in mature SB(r) galaxies, and (b)
[NII]  6584 Å
emission is much stronger than
H
6584 Å
emission is much stronger than
H in the
steep-rotation-curve central disk; this is a possible diagnostic of the
shocks expected in the inner parts of the bar
(Bureau & Freeman
1999).
On the other hand, we noted in
Section 2.1 that mature SB(r)
galaxies - the ones in which an annulus interior to the inner ring has
been cleared of gas - do not have the radial dust lanes that are
characteristic of shocks. Despite these uncertainties, the almost
universal detection of figure-8-like line splitting in boxy bulges and
(equally important) the lack of such splitting in elliptical bulges
argues that the former are found in barred galaxies.
in the
steep-rotation-curve central disk; this is a possible diagnostic of the
shocks expected in the inner parts of the bar
(Bureau & Freeman
1999).
On the other hand, we noted in
Section 2.1 that mature SB(r)
galaxies - the ones in which an annulus interior to the inner ring has
been cleared of gas - do not have the radial dust lanes that are
characteristic of shocks. Despite these uncertainties, the almost
universal detection of figure-8-like line splitting in boxy bulges and
(equally important) the lack of such splitting in elliptical bulges
argues that the former are found in barred galaxies.
A third observation that connects boxy bulges with bars is the detection in the disks of a few edge-on examples of density enhancements that plausibly are inner rings (Aronica et al. 2003).
Galaxy mergers probably create a minority of boxy bulges (Jarvis 1987). Also, Patsis et al. (2002) illustrated a simulation that makes a boxy-bulge-like structure in the absence of a bar. However, the conclusion that galaxies with boxy bulges generally contain bars seems reasonably secure.
This is not proof that they are the same things. There are two problems with the simple, well-motivated, and almost universally accepted notion that boxy bulges are edge-on bars.
First is the observation that at least some edge-on bars are flat. The "Rosetta stone" object for this subject is NGC 4762. It is studied in an important paper by Wakamatsu & Hamabe (1984) and is illustrated in Figure 16.
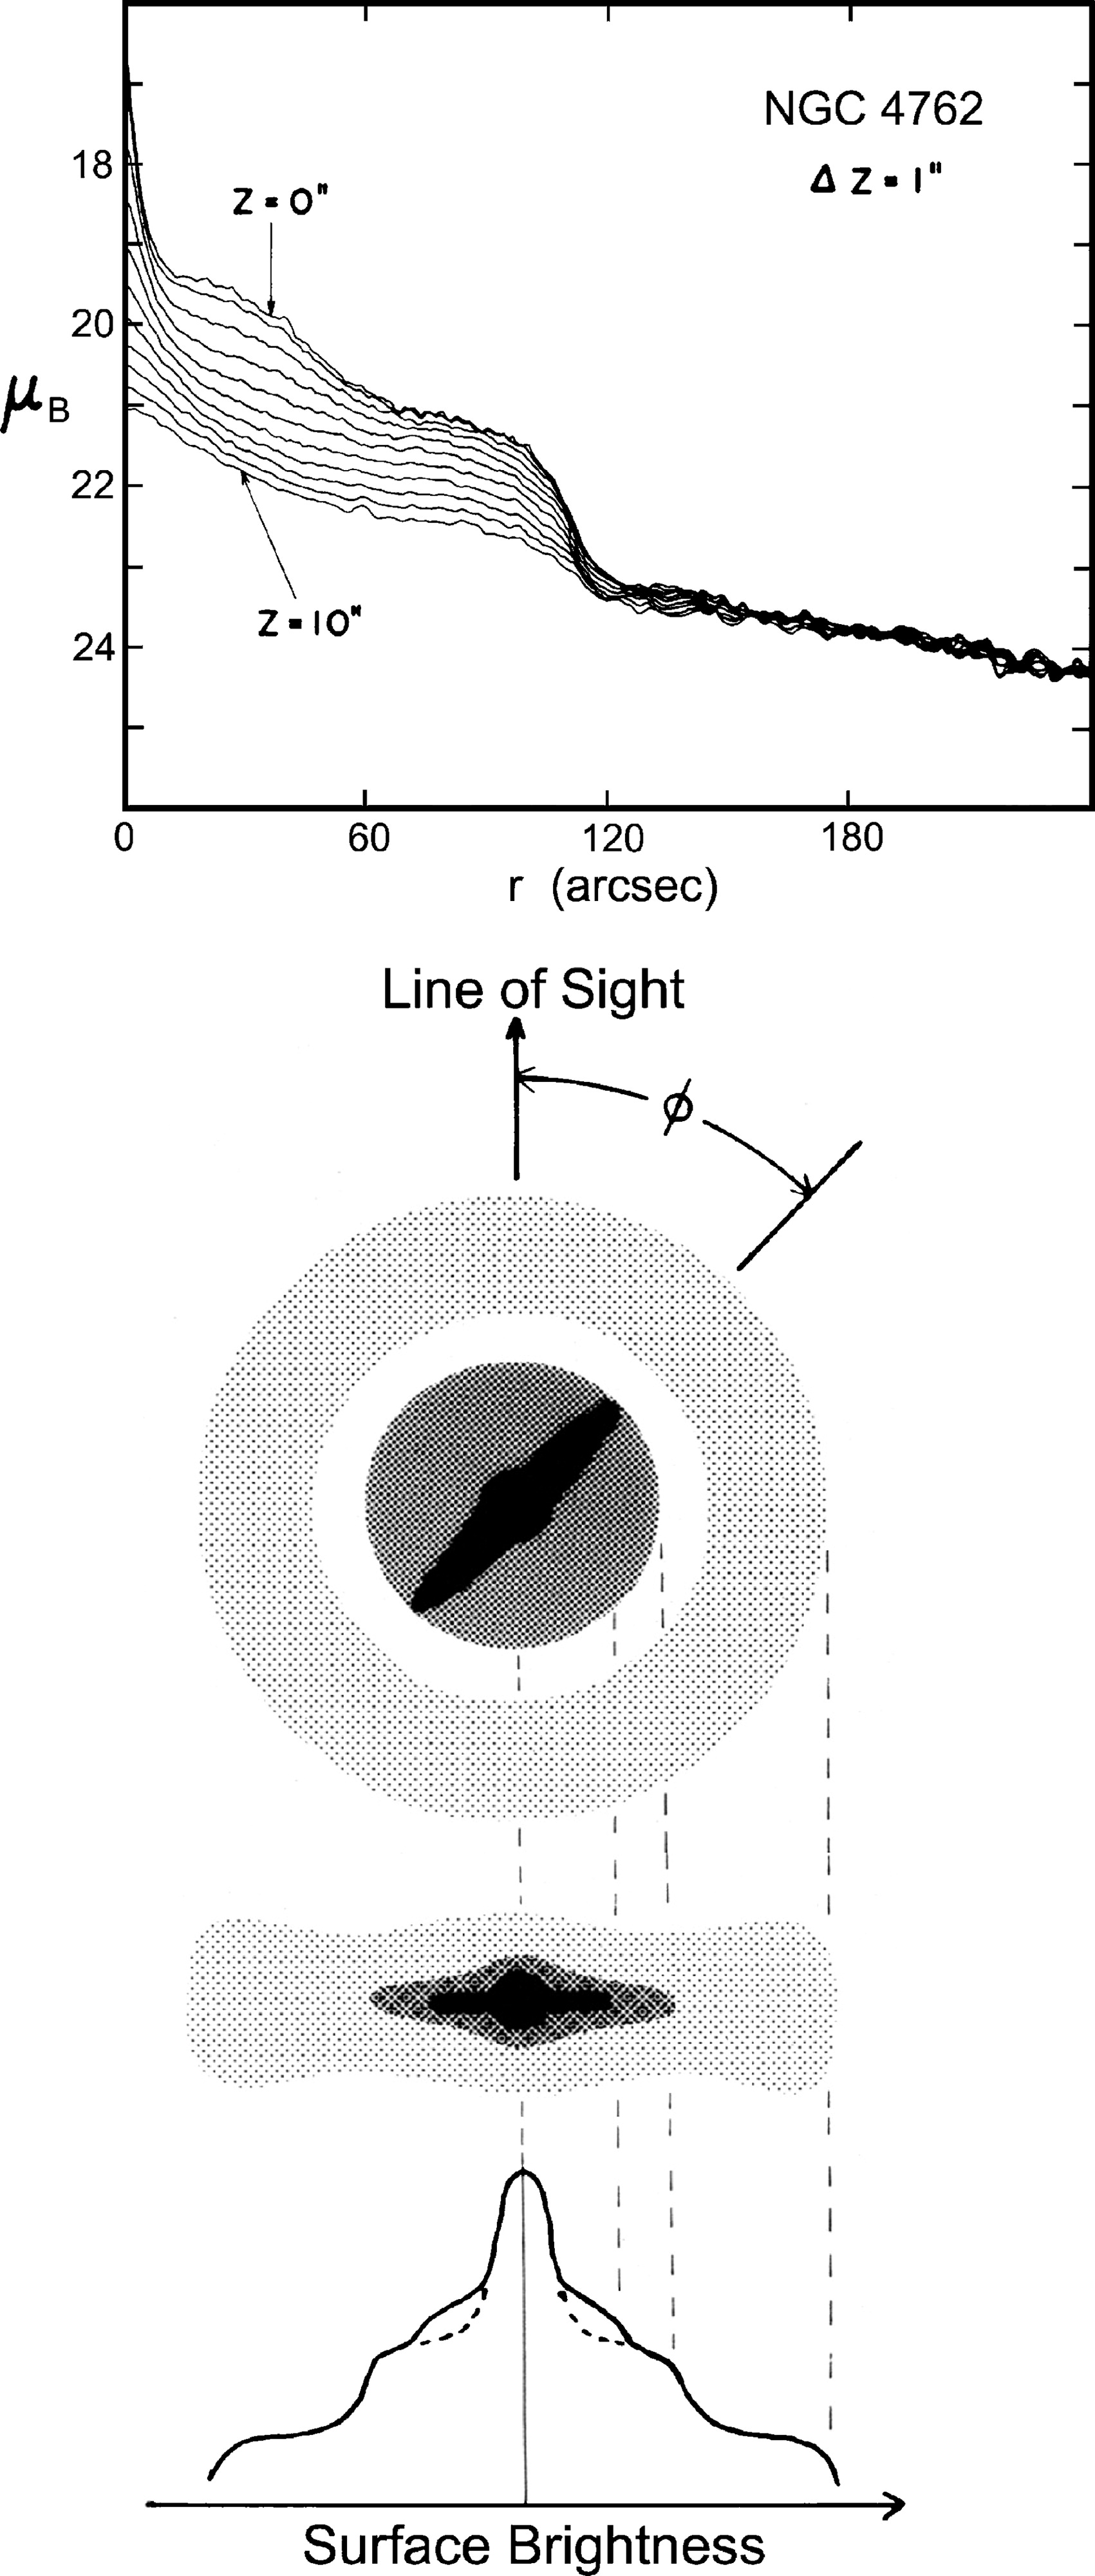 |
Figure 16. (Top) Brightness cuts
parallel to the major axis of NGC 4762 and displaced from it by
|
NGC 4762 is unique among edge-on galaxies studied so
far because it has, in addition to a bulge, three clear-cut shelves in
its major-axis brightness distribution. All three shelves are visible in
the Hubble Atlas images
(Sandage 1961),
which also show that the bulge is slightly boxy. More face-on galaxies
show us that three shelves in the surface brightness profile are common
in early-type galaxies that contain a bar, a lens, and an outer ring
(see NGC 1291 in
Figure 2,
NGC 3945 in
Figure 5,
and NGC 2217 and NGC 2859 in the Hubble Atlas).
Lenses and outer rings have shallow brightness gradients interior to a
sharp outer edge; their two nested ovals are exactly analogous to those
in later-type oval galaxies
(Figure 9).
Kormendy (1979b)
emphasized that the bar almost always fills the lens in its longest
dimension. Because SB(lens)0 galaxies are common and because they are
the only S0s with three prominent shelves in the brightness profile,
interpreting NGC 4762 is reasonably straightforward.
Wakamatsu & Hamabe
(1984)
suggested that the outer shelf is an outer ring, that the middle shelf
is a lens, and that the inner shelf is a bar. Because the inner shelf
has a smaller radius than the middle shelf, the bar must be seen at a
skew orientation
 (Figure 16). Wakamatsu and Hamabe pointed out
that their interpretation is supported by four observations: (a)
The deprojected profile of the outer shelf is that of a ring: It has a
minimum interior to an outer maximum. (b) The radius of the outer
shelf satisfies the correlation between outer ring radii and galaxy
luminosity. (c) The radius of the inner shelf satisfies the
correlation between lens radii and galaxy luminosity; both correlations
are from
Kormendy (1979b).
(d)
The ratio of the radius of the outer shelf to the radius of the inner
shelf is 2.4 ± 0.2, consistent with the average ratio of outer ring to
lens radii, 2.21 ± 0.12
(Kormendy 1979b;
Buta & Combes 1996
and references therein).
(Figure 16). Wakamatsu and Hamabe pointed out
that their interpretation is supported by four observations: (a)
The deprojected profile of the outer shelf is that of a ring: It has a
minimum interior to an outer maximum. (b) The radius of the outer
shelf satisfies the correlation between outer ring radii and galaxy
luminosity. (c) The radius of the inner shelf satisfies the
correlation between lens radii and galaxy luminosity; both correlations
are from
Kormendy (1979b).
(d)
The ratio of the radius of the outer shelf to the radius of the inner
shelf is 2.4 ± 0.2, consistent with the average ratio of outer ring to
lens radii, 2.21 ± 0.12
(Kormendy 1979b;
Buta & Combes 1996
and references therein).
We belabor these points because it is critically important to know that
the inner shelf is the bar. The reason is illustrated in the top panel
of Figure 16.
Wakamatsu & Hamabe
(1984)
show convincingly that the bar is flat. In the series of brightness
cuts parallel to the disk major axis and displaced from it by
 z = 0", 1",
2", ... 10", the bar disappears as a feature distinct from the lens by
z
5". That is, its scale height is less than that of the lens and much
less than that of the bulge. The bar is the flattest component in the
galaxy.
z = 0", 1",
2", ... 10", the bar disappears as a feature distinct from the lens by
z
5". That is, its scale height is less than that of the lens and much
less than that of the bulge. The bar is the flattest component in the
galaxy.
Also, the bar and the bulge are photometrically distinct. The boxy outer part of the bulge (which is not evident in the brightness cuts in Figure 16) has a radius about half as big as the projected radius of the bar. If the bar fills the lens, then this is about one-fifth of the true radius of the bar.
Similar evidence for flat bars is presented in de Carvalho & da Costa (1987); Lütticke, Dettmar & Pohlen (2000b); and Quillen et al. (1997).
The second problem with the assumption that boxy bulges are edge-on bars
is the observation that both occur together but are distinct from each
other in NGC 7582
(Quillen et al. 1997).
We see this galaxy at an inclination i
65°
that is close enough to edge-on so that the boxy bulge is visible in
the infrared but far enough from edge-on so that the bar can be
recognized
(Sandage & Bedke
1994).
In fact, the galaxy has the morphology of a typical oval disk with the
bar filling the inner oval along its apparent major axis. Therefore the
bar is seen essentially side-on. However, the bar is very flat, the
boxy bulge is clearly distinct from it, and the maximum radius of the
boxy structure along the disk major axis is about one-third of the
radius of the bar.
These observations suggest that boxy bulges and edge-on bars are not exactly equivalent.
An interesting alternative not previously considered is this: Observations and theory are consistent with the hypothesis that at least some and possibly most box-shaped bulges are edge-on nuclear bars. For example, the two nested triaxial components in our Galaxy proposed by Blitz & Spergel (1991, see their figure 1) are similar to the bar-within-bar structure in Section 4.4. If the inner bar has a radius of 1-2 kpc (Binney et al. 1991; Blitz & Spergel 1991; Binney & Gerhard 1993; Sellwood 1993b; Dwek et al. 1995), then it is more nearly the length of typical nuclear bars than of typical main bars. (Scaling our Galaxy to other Sbcs, a normal bar should be ~ 3.5 kpc in radius.) It is the inner bar that looks boxy in COBE images (Weiland et al. 1994; Dwek et al. 1995). We may live in a weakly barred or oval galaxy with a boxy nuclear bar. However, only one-quarter of strongly barred galaxies contain nuclear bars. There may be too few of them to account for all boxy bulges.
Another solution may be the indication noted in figure 1.1b of Shen & Sellwood (2004) that the boxy part of their n-body bar is smaller than the bar as a whole. We are indebted to Jerry Sellwood for pointing this out.
The safest conclusion - and one that is sufficient for our purposes - is that boxy bulges are connected with bars and owe their origin to them. All mechanisms under discussion build the box structure out of disk material. We therefore conclude that detection of boxy bulge isophotes is sufficient for the identification of a pseudobulge. However, the disagreement between the bar simulations and the above observations needs attention.
4.6. Bulges with the Dynamics of Disks: The V /
 -
Diagram
-
Diagram
Figure 17, the Vmax /
-
diagram
(Illingworth 1977;
Binney 1978a,
b),
shows that pseudobulges (filled symbols) are more rotation dominated
than are classical bulges (open circles), which are more rotation
dominated than are giant elliptical galaxies (crosses). This is disky
behavior.
 |
Figure 17. The relative dynamical
importance of rotation and random motions as a
function of observed ellipticity for various kinds of stellar systems.
Here Vmax /
|
The essential features of the Vmax /
-
diagram are as
follows:
is a surrogate for the
(square root of) the ratio of ordered to random kinetic energies and
is the apparent
flattening.
<<
1) and if the system is flattened, then it must be anisotropic
(Binney 1976;
1978a,
b;
1980;
1982).
Stars climb farthest out of their mutual gravitational potential well
in the direction in which the velocity dispersion is largest.
that is shown by the
line labeled "oblate" in Figure 17.
Binney (1978a)
gave it implicitly;
Fall (1981)
provided an explicit equation for the projected configuration seen
edge-on, and
Kormendy (1982a)
gave an approximation formula, Vmax /
[ / (1 -
)]1/2,
that is good to 1% for 0  0.95.
0.95.
0.5, projection moves an isotropic oblate spheroid almost parallel to
the oblate line. If an isotropic spheroid with
= 0.5 is seen at a
skew orientation so that it looks like an
= 0.3 system seen
edge-on, then both systems have approximately the same value of
Vmax /
. However, an edge-on
disk that is near the oblate line at
~ 0.9 ± 0.1
projects well above the oblate line when it is seen other than edge-on.
The above papers show that anisotropic giant ellipticals are triaxial. We emphasize that this triaxiality is different from that of bars. Ellipticals are triaxial because they have little angular momentum. They are made largely out of "box orbits" that have no net angular momentum (see Binney & Tremaine 1987 for a review). Rotation is provided by "z-axis tube orbits" that encircle the z = rotation axis; in a triaxial elliptical, these are somewhat elongated in the direction of the longest axis. Other orbits, including chaotic ones, are present as well. But the essential character of an elliptical is defined by its box orbits.
In contrast, a barred galaxy is barred not because it has little angular momentum but rather because it has too much for the combination of its velocity dispersion and its central concentration. This is why the disk made a bar. Bars are not made of box orbits; they are made of x1 orbits. These are very elongated z-axis tubes that, in some cases, include baroque decorations such as loops. They have lots of angular momentum. It is important to keep in mind the distinction between bars and ellipticals. They are not different versions of each other, and they virtually never occur together. A bar is fundamentally a disk phenomenon.
Contrast now the behavior of the bulges that are plotted in Figure 17 as filled symbols. They are above the oblate line and even more above the distribution of classical bulges plotted with open symbols. Rotation is more important in these objects than it is in classical bulges and ellipticals. Point 4, above, shows why this is disk-like behavior. It indicates an admixture of stars that are flattened, dynamically cold, and rapidly revolving around the galactic center - that is, a disk contribution that would appear near the oblate line if seen edge-on but that lies well above the oblate line when the galaxies are viewed at skew inclinations. The filled symbols include barred galaxies and the prototypical unbarred oval galaxy NGC 4736 (Figures 2 and 8). These are objects in which we argued that secular evolution has been important. Another prominent example is NGC 3945; its rapidly rotating bulge is the nuclear bar shown in Figure 14 (see Erwin et al. 2003 for a detailed discussion). Another is NGC 2950, which also contains a nuclear bar. Thus the dynamical evidence agrees with other evidence that these are pseudobulges.
Two pseudobulges from
Kormendy &
Illingworth (1982)
deserve comment. They are plotted as filled diamonds in
Figure 17. NGC 1553 contains the prototypical
lens in an unbarred galaxy (point 7 of
Section 2.1).
Figure 17 shows that it has an unusually high
value of (Vmax /
)* for an unbarred
galaxy. Consistent with the suggestion that the lens is a defunct bar
(Kormendy 1979b,
1984)
(Section 3.3), the hint is that the
galaxy grew a pseudobulge while it
was still barred. In contrast, the boxy bulge of NGC 4565 has (Vmax /
)* = 0.86 ±
0.16. This is smaller than (Vmax /
)* values for other
pseudobulges. However, a box-shaped pseudobulge rotates cylindrically,
so (Vmax /
)* underestimates the
dynamical importance of rotational kinetic energy compared with
ellipsoidal bulges.
The difference between classical and pseudobulges need not always be large.
It is entirely implausible that secular evolution sometimes augments a
classical bulge with new, disky material. We also point out in
Section 7.1 that pseudobulges can heat
themselves in the vertical direction,
thereby decreasing their dynamical difference from classical bulges.
Therefore, large (Vmax /
) is evidence for a
pseudobulge, but values comparable to those on the oblate line do not
guarantee that the bulge is classical.
4.7. Velocity Dispersions and the Faber-Jackson Relation
Figure 18
shows the correlation between the velocity dispersion and absolute
magnitude for elliptical galaxies and for bulges of disk galaxies. Most
early-type galaxy bulges are consistent with the well-known correlation
LB
4
(Faber & Jackson
1976;
see
Minkowski 1962
for an early hint). But a few early-type (pseudo)bulges and a large
majority of Sbc-Sm (pseudo)bulges fall well below the correlation. One
possible interpretation is that these have small velocity dispersions
and are similar to disks. Alternatively, the centers of late-type
galaxies may actively be forming stars and therefore have small
mass-to-light ratios. Figure 18
would then imply that the central parts of most late-type galaxies have
young stellar populations. Therefore, star formation must be secular,
not episodic. In either case, Figure 18
suggests that most late-type galaxies contain pseudobulges. In
contrast, most early-type bulges are similar to elliptical galaxies.
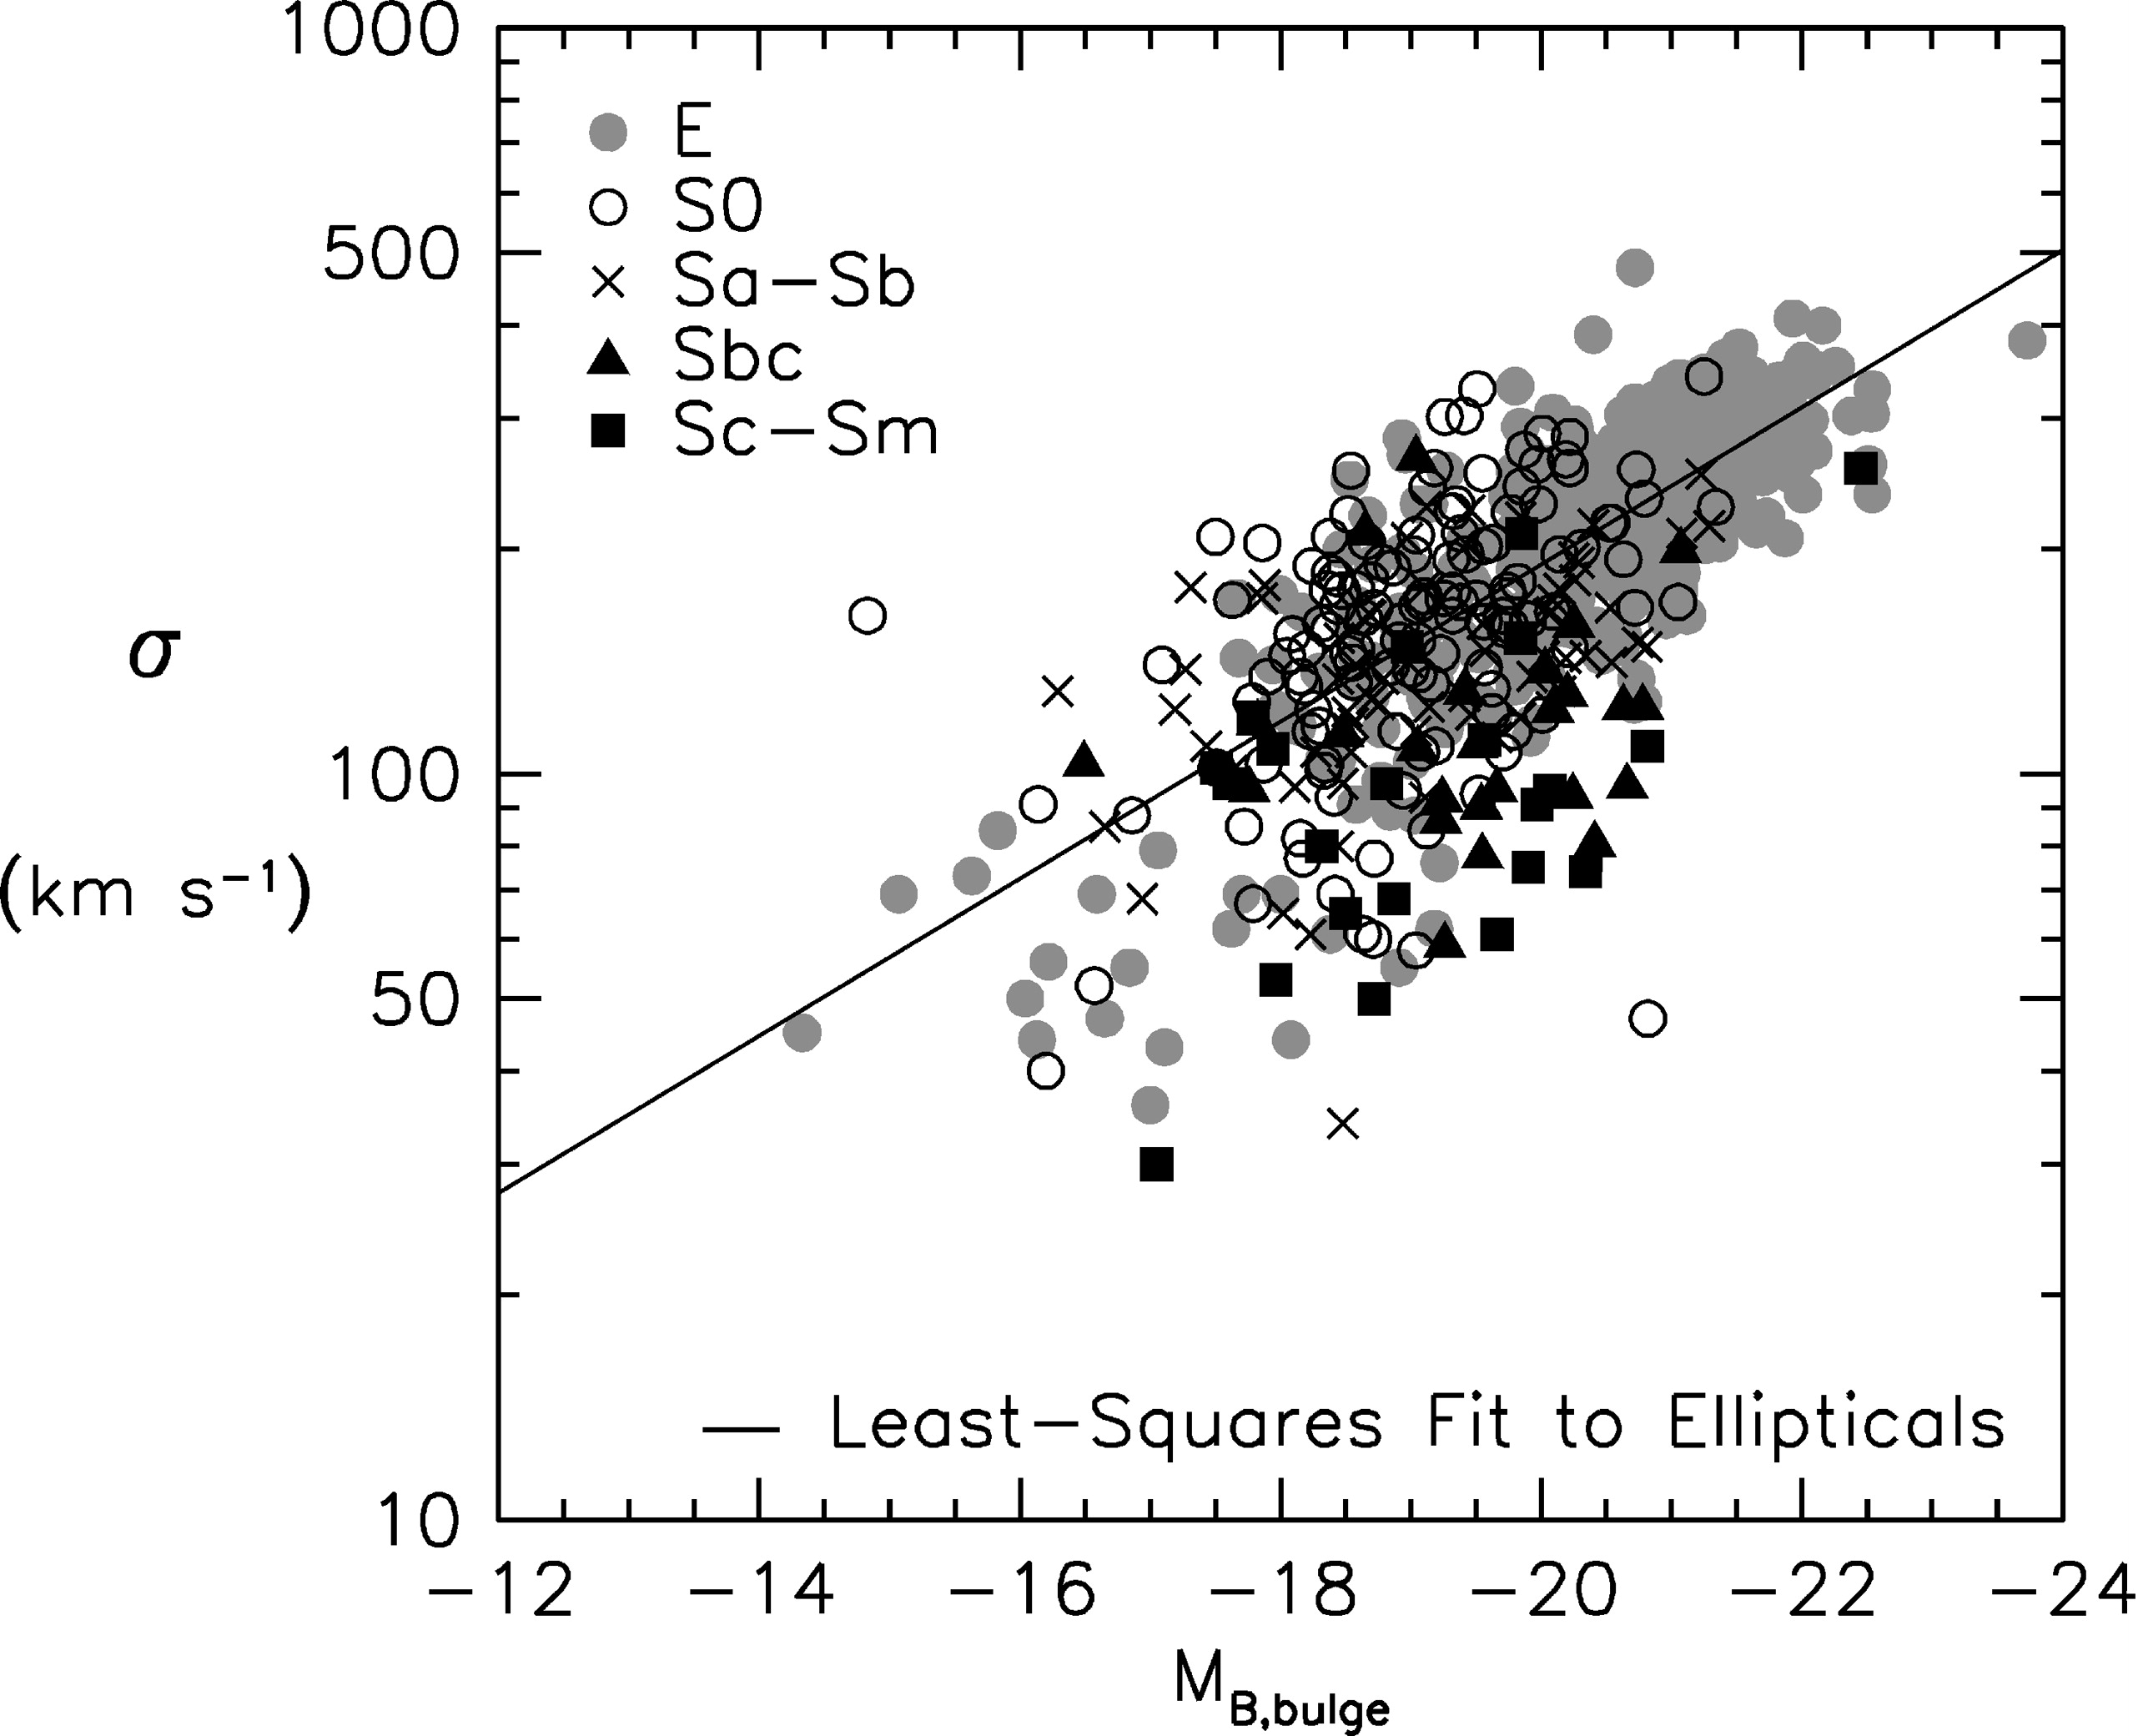 |
Figure 18. Correlation between central velocity dispersion and bulge absolute magnitude for all galaxies of the indicated Hubble types that have velocity dispersions tabulated in Hypercat. The straight line is a least-squares fit to the ellipticals. Updated from Kormendy & Illingworth (1983), this figure is from Kormendy & Cornell (2004). |
4.8. Pseudobulges and the Fundamental Plane Correlations
If pseudobulges have Sérsic indices (n ~ 1) that are smaller
than those of elliptical galaxies (n ~ 4),
then this signals a breakdown in the homology that, together with the
virial theorem, is the reason why classical bulges and ellipticals
satisfy the Fundamental Plane (FP) correlations (e.g.,
Djorgovski & Davis
1987;
Dressler et al. 1987;
Faber et al. 1987;
Lauer 1987;
Djorgovski, de
Carvalho & Han 1988;
Kormendy &
Djorgovski 1989;
Bender, Burstein &
Faber 1992,
1993;
Burstein et al. 1997);
that is, bulges and ellipticals lie in an inclined plane, R
1.4 ±
0.15 I-0.9 ± 0.1 in the space of observed
radius R, surface brightness I, and velocity dispersion
. The scatter of
ellipticals around the FP is small
(Saglia, Bender &
Dressler 1993).
Therefore deviations from the FP are a sensitive test of whether the
structure of a bulge-like component is or is not similar to that of an
elliptical.
Carollo (1999)
found that pseudobulges deviate from the FP of classical bulges and
elliptical galaxies in the direction of having lower densities (see also
Kent 1985;
Andredakis, Peletier
& Balcells 1995).
They lie closer to the locus of disks than to that of hot stellar
systems. Similar studies of larger samples may provide an additional
quantitative way to recognize pseudobulges.
Nuclei are compact star clusters 5 at galactic centers (see Kormendy & Djorgovski 1989 for a review). They should not be confused with steep density cusps that are the central parts of nearly featureless power-law profiles (Lauer et al. 1995). For example, M32 does not have a nucleus (Lauer et al. 1992, 1998). Rather, nuclei are clearly differentiated from the surrounding (pseudo)bulge and disk in the sense that they have much smaller effective radii re and much higher effective surface brightnesses µ(re) than their surroundings. Figure 20 illustrates the prototypical example in M33 (Kormendy & McClure 1993). Tremaine & Ostriker (1982) have shown that the nucleus and bulge of M31 are dynamically independent; we assume that the same is true for other nuclei. Local Group examples are found in M31 (e.g., Lauer et al. 1993, 1998), M33, and NGC 205 (Jones et al. 1996). Not much farther away are the nuclei in IC 342 (Böker et al. 1997, 1999a) and in NGC 7793 (Díaz et al. 2002).
Late-type disk galaxies usually contain nuclei. Many of these have young stellar populations. They imply episodic star formation over long periods of time and so are consistent with secular growth in a manner that is similar to the proposed formation of pseudobulges. But the "smoking gun" that is most compelling is not the one that points at secular evolution. Rather, the observations are screaming that there is another physical process taking place that we do not understand. This is clear because nuclei are not just the low-luminosity limit of pseudobulges. Also, compact nuclei and fluffy pseudobulges often occur in the same galaxy. If they form similarly, why are they so different? Our review highlights a remarkable list of enigmas.
Surveys of late-type galaxies and detailed studies of individual objects provide the following list of properties:
 (Kormendy &
McClure 1993,
Matthews et al. 1999a,
Carollo et al. 2001,
Matthews &
Gallagher 2002,
Böker et
al. 2002).
Effective radii are typically 101 ± 0.5 pc
(Carollo et al. 1999,
Böker et
al. 2003b).
Observed central densities are high and are limited by the spatial
resolution of the images; they are 104 to 105
L
pc-3 in examples in
Matthews et
al. (1999a)
and are even higher, at least 107
L
pc-3, in M33
(Lauer et al. 1998).
These values are enormously higher than the surrounding disk densities.
(Kormendy &
McClure 1993,
Matthews et al. 1999a,
Carollo et al. 2001,
Matthews &
Gallagher 2002,
Böker et
al. 2002).
Effective radii are typically 101 ± 0.5 pc
(Carollo et al. 1999,
Böker et
al. 2003b).
Observed central densities are high and are limited by the spatial
resolution of the images; they are 104 to 105
L
pc-3 in examples in
Matthews et
al. (1999a)
and are even higher, at least 107
L
pc-3, in M33
(Lauer et al. 1998).
These values are enormously higher than the surrounding disk densities.
, 40
Myr ago and the other with a mass of 76,000
M, 1 Gyr
ago. [The total nuclear mass is 2 × 10⁶
M
(Kormendy &
McClure 1993)].
The spectra are insensitive to still older starbursts. Additional
examples of nuclei with blue colors indicative of young stars are
discussed in
Díaz et
al. (1982);
Bica, Alloin &
Schmidt (1990)Shields &
Filippenko (1992);
Böker et al.
(1997,
1999);
Matthews et
al. (1999a);
Davidge & Courteau
(2002);
Böker et al.
(2001,
2003b);
see also
Ho, Filippenko &
Sargent (1997).
Carollo et al. (2001)
observe colors that are consistent with a range of ages; there is some
tendency for bluer nuclei to be associated with bluer surrounding
disks. In fact, "brighter nuclei (MV
-12) are typically found ... in the centers of galaxies with
circumnuclear rings/arms of star formation or dust and an active, i.e.,
H II or AGN-type ... spectrum"
(Carollo 1999,
consistent with
Ho, Filippenko &
Sargent 1997).
Since so many nuclei contain young stars, star formation does not
happen over only a small fraction of the life of the cluster but rather
is secular.
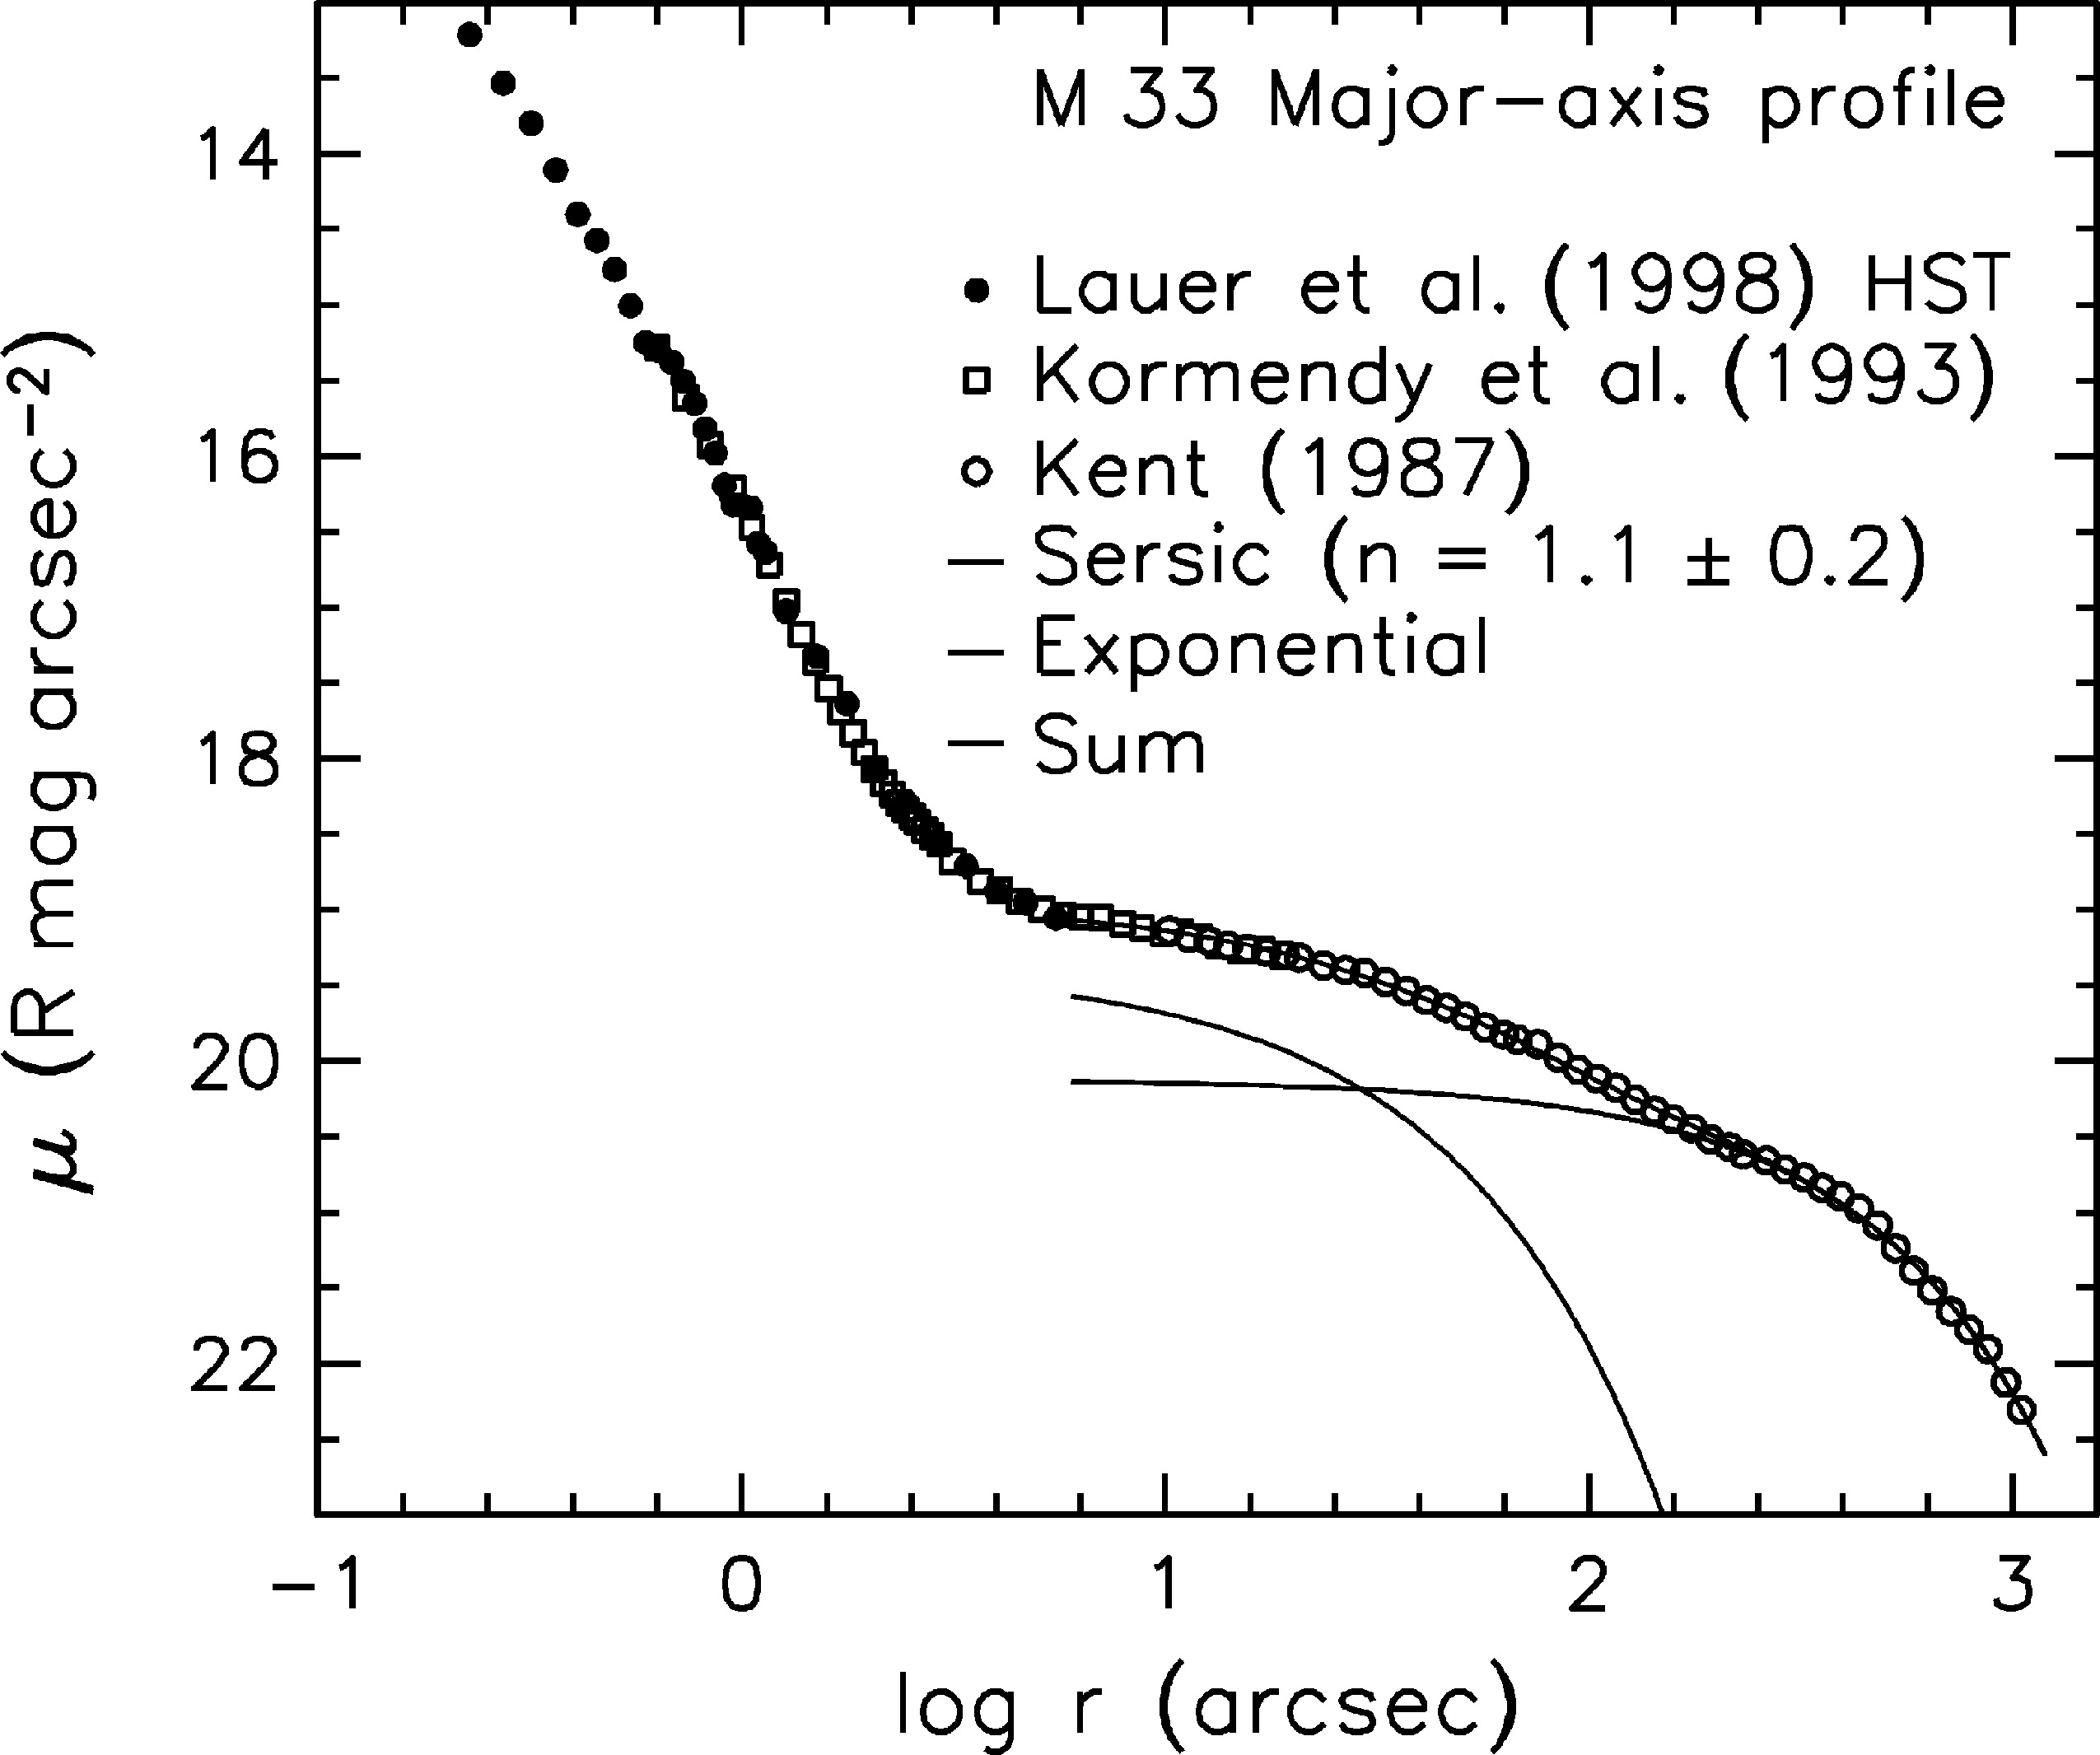 |
Figure 19. Major-axis surface brightness profile of M33. The steep rise in surface brightness near the center is the nucleus. The rest of the profile has been decomposed into an inner Sérsic function plus an exponential. We thank S. Faber and the Nuker team for suggesting a discussion of M33. |
What does all of this mean? Point 5 provides the strongest evidence that nuclei are built by secular processes like those that we suggest make pseudobulges. Point 8 also seems consistent. So is observation 1 that nuclei are more common in later-type galaxies; they are approximately as common as pseudobulges. However, points 2, 3, 4, 6, and 7 either are major puzzles or suggest that nuclei and pseudobulges are fundamentally different.
The prudent conclusions are these: Nuclei are not a problem for our picture of pseudobulge formation by inward secular transport of gas. In fact, many authors have argued that this is how they grow. But nuclei are not a secure argument for secular evolution, either. We find it compelling that nuclei and pseudobulges are very different in their parameters but occur together in the same galaxies. Nuclei appear to be related to globular clusters and to young clusters in merger starbursts. Several mysteries would be easier to understand if they got their start as such clusters and then sank to the center by dynamical friction. In particular, our problem with points 3 and 4 - that nuclei are tiny and dense compared with pseudobulges and disks - would vanish.
4.10. In Which Pseudobulges Fade Out into Disks
Böker, Stanek & van der Marel (2003c) have investigated how pseudobulges fade out into disks. Their most subtle examples of pseudobulges also highlight fundamental uncertainties about the meaning of profile decomposition. M33 (Figure 19) provides an example. The disk has somewhat irregular but global-pattern spiral structure (Sandage 1961, Sandage & Bedke 1994). There is no sign of an ILR, i.e., the spiral arms become radial near the center and pass through it. At the center, a very distinct nucleus (Kormendy & McClure 1993) is representative of the ones discussed in Section 4.9. Figure 19 shows that the disk surface brightness profile has a subtly two-component look; it is well fitted by the sum of two exponentials. The figure shows a decomposition into a Sérsic function plus an outer exponential; it confirms that n = 1.09 ± 0.18 for the inner component. This inner component is essentially the bulge discussed by Minniti, Olszewski & Rieke (1993). It is also visible as a subtle upturn in surface brightness at r < 150" in the JHK profiles posted at the 2MASS Web site. What does this mean? Does M33 contain a pseudobulge?
The inner component is consistent with, although on the low-density side of, the parameter distribution for exponential bulges given in Carollo (1999). The effective radius of the inner component is re = 0.31 ± 0.05 kpc, and the mean surface brightness within re is 20.7 ± 0.2 R mag arcsec-2. (All errors quoted take account of parameter coupling in the decomposition.) If one applies profile decomposition in the canonical way, then one could reasonably conclude that this is a pseudobulge not unlike the fluffiest ones discussed in the literature.
On the other hand, we are uneasy about the decomposition in
Figure 19.
The distinction between the components is subtle. The inner one is at
most a factor of 2 brighter than the outer one, and it is so only at
r
< 10" where the outer exponential has already been extrapolated far
inward. The stars in both components are presumably in nearly circular
orbits; stars that define the outer exponential do not, by and large,
visit the inner exponential and vice versa. Does it really make sense
to say that half of the disk stars at r
25" belong to the main disk and half belong to a pseudobulge? If we
could observe each star, how would we decide which ones belong to the
bulge and which to the disk? It is difficult to believe, given
substantial spread in kinematic and composition properties, that there
would be such a clean separation into two components that we could
label each star correctly. Another way to put it is this: Given that
the fitting functions used for each component are not physically
motivated or explained, is there any reason to believe that each one
extrapolates without change into the part of the galaxy that is
dominated by the other? And still another way: No theory of the
formation of exponential disks explains why an exponential is so magic
and so required that modest departures from it cry out for explanation.
We already accept
Freeman (1970a)
"Type II profiles" as canonical disk behavior, even though we can
explain it in only a few cases (e.g.,
Talbot, Jensen &
Dufour 1979).
We accept outer cutoffs (e.g.,
van der Kruit &
Searle 1981a,
b;
1982).
Oval disks are only piecewise exponential
(Section 3.2). Would it be a
surprise if disks also knew how to deviate above an inward
extrapolation to small radii?
We believe that it is not possible, given the available information, to distinguish between the following possibilities: It is entirely plausible that the inner exponential is a protopseudobulge. Alternatively, disk profiles can have a variety of wiggles and this is one of them. Interestingly, the inner component is significant out to a radius that is comparable to the width of the spiral arms. Spiral arms pass through the center when there is no ILR. This means that the profile near the center measures light only from a spiral arm crest, while the profile farther out is an average over arm crests and arm troughs. This could be part of the explanation of the inner component.
This discussion highlights a fundamental conceptual uncertainty with the blind application of profile decomposition. In the case of a big, classical bulge plus an obvious disk, we can be confident that a decomposition has physical meaning. We know this from edge-on galaxies. The bulge in the Sombrero galaxy clearly extends into and beyond the radii where we would see the disk if the galaxy were face-on; at these radii, we would see bulge stars in front of and behind the disk. Bulge formation via mergers guarantees that this be so, because some stars in a merger always splash out to large radii. But secular evolution involves the slow transport of gas that is never far from dynamical equilibrium. No substantial splashing occurs. The concept that a pseudobulge coexists, at some radius of interest, with a disk that was already in place has much less physical meaning than it does in the case of a classical bulge. It is not clear to us that decomposition has any meaning at all in distinguishing pseudobulges from disks. It may be more meaningful to fit the profile piecewise.
Decomposition remains a useful way to derive diagnostic parameters. We should not overinterpret the results. Further work is needed to define the boundaries between what deserves interpretation and what does not.
What are the implications? We believe that the conclusions about well-developed pseudobulges - the ones whose profiles rise well above the inward extrapolation of the disk profile, as in Figures 10 to 12 - are unchanged. The FP correlations then tell us that the dividing line between pseudobulges and disks is just as fuzzy as the one between classical bulges and pseudobulges. The reason is not that our machinery is inadequate. The reason is that there is a physical continuum between disks and pseudobulges, as suggested by Kormendy (1993) and by Böker, Stanek & van der Marel (2003c). The sequence of pseudobulges fades out not where they become tiny, like nuclei, but where they become large, low in surface brightness, and indistinguishable from disks.
4 Similarly, because
-
/ 2 decreases outward,
the pattern speeds of spiral arms are likely to be slower than those of
bars
(Sellwood 1985,
Sparke & Sellwood
1987,
Sellwood & Sparke
1988,
Sellwood &
Wilkinson 1993).
This accounts for the comment in
Section 2.1 that the spiral arms of
SB(r) galaxies "often [begin] downstream from the ends of the bar"
(Sandage & Bedke
1994).
Back.
5 Many galaxies have active centers that are dominated by nonthermal radiation and by emission from hot gas. These are universally called active galactic nuclei. They are quite distinct from star clusters. When we speak of nuclei, we expressly exclude radiation from active galactic nuclei. Caution: Not all authors do this. Back.