


A major development in the last decade has been the advent of new observing facilities and large surveys at all wavelengths of the spectrum, enabling astronomers for the first time to observe the full SEDs of galaxies from the UV to the FIR, from the local universe out to redshifts beyond 6. While databases such as those referenced in Table 1 make it tempting to simply go ahead and fit full galaxy SEDs, it is important to pause for a moment and review which are the difficulties associated with the construction of a single SED. Indeed, the "true SED" of a galaxy as defined in the models considers the sum of all photons emitted from inside the volume defining the galaxy. To make the observed SED of a galaxy, however, this "true SED" is then filtered through the spectral response curve of the instruments and is redistributed spatially over the point spread function (PSF). Additionally, the measurement process not only adds noise, but also makes it necessary to join data from different instruments.
The construction of multi-wavelength SEDS is a complex and rich subject and a dedicated review would be a welcome addition to the literature. In keeping with the scope of the present text we can here only give a very cursory treatment of the issue. As a starting point for further reading we suggest consulting some of the major multi-wavelength surveys and their overview articles provided in Table 1 below.
3.1. Spectral response curve and resolution
Be it in spectroscopy or in photometry, one identifies the SED as a
series of wavelengths and associated fluxes. In both cases, this is only
a simplification of the fact that the measurement process convolves the
true SED with a spectral response curve, yielding a transmitted flux at
an effective wavelength. In spectroscopy, the response curve is almost
invariably assumed to be Gaussian, with a
 determined by the slit
width and the dispersing device. Therefore, in practice the distinction
between the instrumental broadening and the broadening due to the
intrinsic velocity dispersion of the astronomical object is not very
sharp. To mimic the instrumental broadening, one should first convolve
with the appropriate Gaussian and then resample onto the spectral
bins. Care needs to be taken that the wavelength calibration of both
models and data are better than a tenth of a pixel over the full
wavelength range (this is not always the case, see e.g.
Koleva et
al. 2008).
determined by the slit
width and the dispersing device. Therefore, in practice the distinction
between the instrumental broadening and the broadening due to the
intrinsic velocity dispersion of the astronomical object is not very
sharp. To mimic the instrumental broadening, one should first convolve
with the appropriate Gaussian and then resample onto the spectral
bins. Care needs to be taken that the wavelength calibration of both
models and data are better than a tenth of a pixel over the full
wavelength range (this is not always the case, see e.g.
Koleva et
al. 2008).
In photometry, the response curve is much broader and therefore needs to be represented with more care, i.e. tabulated as a response function. The response function in turn depends on the detector quantum efficiency, the instrument transmission and the filter in use. Photometric calibration and response characterization is a vital task (see Koornneef et al. 1986, Landolt 1992 for just two prominent examples).
The signatures available for determination of the physical properties of
galaxies of course depend on wavelength and on the achieved
resolution. For example, in the optical many of the strongest features
of galaxies can be adequately resolved at a resolution of
R =  /
/
 ~ 2000, while
the low-resolution part of the
Spitzer IRS can easily resolve PAH features at R ~ 100. However,
spectroscopy is more expensive in terms of telescope time, making
photometry very attractive for obtaining large samples. In the last
decade, successful use of narrow-band filters have blurred the
distinction between spectroscopy and photometry, see for example
COMBO-17
(Wolf et al. 2003),
COSMOS
(Scoville et
al. 2007)
and NEWFIRM
(van Dokkum et
al. 2009).
Narrow-band filters have even been used to
directly measure emission line equivalent widths (e.g.
Kakazu et
al. 2007).
~ 2000, while
the low-resolution part of the
Spitzer IRS can easily resolve PAH features at R ~ 100. However,
spectroscopy is more expensive in terms of telescope time, making
photometry very attractive for obtaining large samples. In the last
decade, successful use of narrow-band filters have blurred the
distinction between spectroscopy and photometry, see for example
COMBO-17
(Wolf et al. 2003),
COSMOS
(Scoville et
al. 2007)
and NEWFIRM
(van Dokkum et
al. 2009).
Narrow-band filters have even been used to
directly measure emission line equivalent widths (e.g.
Kakazu et
al. 2007).
3.2. Spatial resolution, aperture bias and matching
One of the main tasks when assembling a multi-wavelength SED, indeed any catalog that contains more than one measurement, is to control whether what is measured in each band is actually physically the same. Due to either the seeing of the atmosphere or the diffraction of the telescope, the flux from a point-like source is re-distributed over the point spread function (PSF) of a width that typically depends on the time of observation and on the wavelength used. Moreover, galaxies are intrinsically extended and their morphology may depend on the wavelength in which they are observed.
One of the main problems in the process of matching is the size of the PSF. Typically, the PSF is narrowest at optical wavelengths, while UV and IR PSFs are broader. This can lead to situations in which there is more than one optical counterpart to the UV, IR or sub-mm source. The agnostic way to deal with this is to simply exclude such objects from the sample, however, this may introduce a bias if the multiple optical counterparts are actually physically associated. A more intricate, but also more uncertain, way is to redistribute the flux according to optical priors (Guillaume et al. 2006). Finally, the use of all available information, spatial as well as spectral, seems to provide a promising way forward for multiwavelength datasets (Roseboom et al. 2009).
Another problem related to the resolution of the telescope are aperture biases. A rather simple manifestation of this is that objects that are further away will be seen as smaller on the sky. Therefore, in order to construct comparable samples at different redshifts, one has to adapt the size of the extracted aperture to the same physical size. A more complicated problem is the definition of the "total light" from an object. Indeed, the surface brightness profiles (SBP) of galaxies usually extend much beyond the threshold observational surface brightness. In the case of specific objects, such as cD galaxies, these extended wings might contain a significant part of the total light from a galaxy (Oemler 1976, Carter 1977). Different strategies have been developed to avoid these biases, such as either integrating over a full model for the SBP or simply using specific apertures to integrate the light only inside some physical radius, but each method has its own problems. One of these is also that galaxies have different intrinsic morphology in different bands, thus complicating the application of consistent procedures, even when using data with comparable angular resolution.
A particular concern with fibre spectroscopic surveys such as the SDSS is that the fibre apertures (3" in SDSS) only sample part of the object, with this fraction different at each redshift. The effect of this can be tested by comparing result of a fit to the photometry of the whole galaxy against the photometric fit corresponding to the area of the fibre only (e.g Gómez et al. 2003, Brinchmann et al. 2004).
3.3. Examples of multi-wavelength datasets
We now describe three "real-life" examples of assembled multi-wavelength datasets. It would here be impossible to describe all existing datasets, we therefore chose just three that highlight different goals and methods.
3.3.1. The Spitzer Local Volume Legacy - spatially resolved SEDs
The Local Volume Legacy (LVL) is a Spitzer legacy program built upon a
foundation of GALEX ultraviolet and ground-based
H imaging of 258
galaxies within 11 Mpc. The goal of the LVL survey is to fill a vital
niche in existing multi-wavelength surveys of present-day galaxies with
a statistically robust, approximately volume-complete study of our
nearest star-forming neighbors. Although star formation rates based on
optical spectroscopy as well as GALEX ultraviolet and Spitzer infrared
imaging have been measured for many thousands of galaxies, most
currently available datasets are derived from flux-limited samples, and
thus suffer from well-known biases against low-mass, low surface
brightness systems. Multi-wavelength datasets that do include such
systems often only provide representative samples of this galaxy
population (e.g., SINGS;
Kennicutt et
al. 2003),
and are thus not suitable for studies that both seek to probe the low
metallicity dwarf galaxy regime and require datasets which are true to
the statistics rendered by volume-limited sampling. LVL consolidates and
builds upon recent Local Volume galaxy surveys which have acquired
ground-based narrowband H
(Kennicutt et
al. 2008),
GALEX ultraviolet (Lee et al., in prep.) and HST resolved
stellar population imaging
(Dalcanton et
al. 2009),
by collecting Spitzer IRAC and MIPS infrared imaging for a sample of 258
galaxies derived from these programs. The collection of these
observations enable a wealth of spatially-resolved and
spatially-integrated studies probing present-day star formation,
chemical abundance, stellar structure, and dust properties as well as
galaxy evolution, particularly for metal-poor, low-mass galaxies which
dominate the LVL sample by number. The coupling of the infrared and
ultraviolet data in this survey are explored in
Section 6.2.3.
imaging of 258
galaxies within 11 Mpc. The goal of the LVL survey is to fill a vital
niche in existing multi-wavelength surveys of present-day galaxies with
a statistically robust, approximately volume-complete study of our
nearest star-forming neighbors. Although star formation rates based on
optical spectroscopy as well as GALEX ultraviolet and Spitzer infrared
imaging have been measured for many thousands of galaxies, most
currently available datasets are derived from flux-limited samples, and
thus suffer from well-known biases against low-mass, low surface
brightness systems. Multi-wavelength datasets that do include such
systems often only provide representative samples of this galaxy
population (e.g., SINGS;
Kennicutt et
al. 2003),
and are thus not suitable for studies that both seek to probe the low
metallicity dwarf galaxy regime and require datasets which are true to
the statistics rendered by volume-limited sampling. LVL consolidates and
builds upon recent Local Volume galaxy surveys which have acquired
ground-based narrowband H
(Kennicutt et
al. 2008),
GALEX ultraviolet (Lee et al., in prep.) and HST resolved
stellar population imaging
(Dalcanton et
al. 2009),
by collecting Spitzer IRAC and MIPS infrared imaging for a sample of 258
galaxies derived from these programs. The collection of these
observations enable a wealth of spatially-resolved and
spatially-integrated studies probing present-day star formation,
chemical abundance, stellar structure, and dust properties as well as
galaxy evolution, particularly for metal-poor, low-mass galaxies which
dominate the LVL sample by number. The coupling of the infrared and
ultraviolet data in this survey are explored in
Section 6.2.3.
3.3.2. The Herschel ATLAS - unresolved SEDs
ATLAS (Astrophysical Terahertz Large Area Survey) intends to provide the
first unbiased survey of cool dust and obscured star formation in the
local Universe. ATLAS will detect ~ 250,000 sources with a median
redshift of ~ 1 over ~ 550 square degrees of sky in five bands covering
the wavelength range 110-500 µm. The five photometric
bands cover the peak of the dust SED for local galaxies and, crucially,
can probe the cold dust component (T
 20 K) which
makes up
20 K) which
makes up  90% of the
dust mass in most galaxies
(Dunne and Eales
2001).
Herschel can simultaneously provide an accurate measure of the bolometric
far-infrared luminosity (related to the current star formation rate) and
the total mass of dust (related to the gas mass).
Figure 7 shows the improvements expected to be
made to the measurements of the dust mass function and the need for a
multi-wavelength approach to understanding the properties of galaxies.
90% of the
dust mass in most galaxies
(Dunne and Eales
2001).
Herschel can simultaneously provide an accurate measure of the bolometric
far-infrared luminosity (related to the current star formation rate) and
the total mass of dust (related to the gas mass).
Figure 7 shows the improvements expected to be
made to the measurements of the dust mass function and the need for a
multi-wavelength approach to understanding the properties of galaxies.
 |
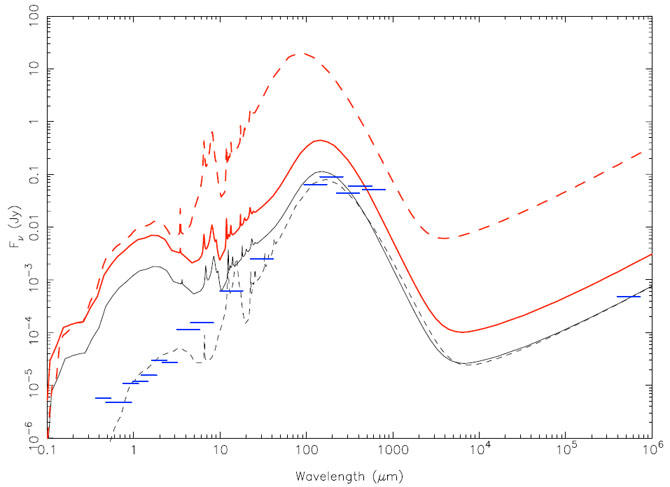 |
Figure 7. Top: Recent estimates of the dust
mass function from targeted observations of an IRAS sample (triangles;
Dunne et al. 2000)
and an optical sample (stars;
Vlahakis et
al. 2005).
The error bars at the bottom show the accuracy and range
for the dust mass function that will be measured with ATLAS. Bottom:
Optical-radio SEDs from GRASIL
(Silva et al. 1998)
for M51 (solid) - a typical spiral, and Arp 220
(dashed) - the archetypal ULIRG. Thick red lines show the SEDs at
z = 0.05 where they have a similar optical/ultraviolet flux but
very different infrared-radio SED. Optical / ultraviolet fluxes alone
are therefore unreliable as a measure of a galaxy's star formation rate
in dusty galaxies. Thin black lines show each SED at the redshift where
it is just detected at 250 µm. This is z ~ 0.1 for
M51 and z ~ 1 for Arp 220. The far-infrared-radio SEDs are now
identical, while the optical fluxes are very different. Photometric
redshifts from far-infrared/radio alone are totally unreliable without
templates and optical / infrared fluxes to break the degeneracy
between dust temperature and redshift. Horizontal dashes show the
5 |
The ATLAS will be unbiased as it does not rely on prior detection in other wavebands. Nevertheless, the ATLAS fields contain > 105 redshifts and are the best studied fields of this size; they are the targets of surveys being carried out with GALEX, VST, VISTA, UKIRT and the South Pole Telescope and will be the natural targets of many future surveys, including ones carried out by DES, WISE, LOFAR and the two SKA precursor telescopes in the south.
The greatest challenge for the Herschel ATLAS is likely to be the matching of the submillimeter sources to the correct optical / infrared counterparts. At very low redshift this is fairly straightforward as the density on the sky of bright optical galaxies is low enough that associations are unlikely to be random. At intermediate-high redshifts the number of potential matches increases dramatically and the large Herschel beam (18-36) means that correct identification cannot simply be a matter of probability and distance. This will require a multi-wavelength SED modeling code which can `join together' the ultraviolet / optical / near-infrared portion of the spectrum with the far-infrared/submillimeter `bump' in a self-consistent way.
Polletta et al. (2007) published a set templates that combine the SEDs of galaxies with those of AGN and thus fill an important hole in many SED fitting template sets 2. The library contains 20 templates including 1 elliptical, 7 spirals, 3 starbursts, 6 AGNs, and 3 composite (starburst+AGN) templates covering the wavelength range between 1000Å and 1000 µm. The elliptical, spiral and starburst templates were generated with the GRASIL code (Silva et al. 1998). Templates of moderately luminous AGN, representing Seyfert 1.8 and Seyfert 2 galaxies, were obtained by combining models, broad-band photometric data, and ISO-PHT-S spectra of a random sample of 28 Seyfert galaxies. Four additional AGN templates represent optically-selected QSOs with different values of infrared/optical flux ratios and one type 2 QSO. The QSO1 templates are derived by combining the SDSS quasar composite spectrum and rest-frame infrared data of a sample of SDSS/SWIRE quasars divided in three groups, all, and the 25% brightest and 25% weakest measurements per rest-frame wavelength bin. The type 2 QSO template (QSO2) represents the SED of the red quasar FIRST J013435.7-093102 (Gregg et al. 2002). The composite (AGN+SB) templates are empirical templates that well reproduce the SEDs of the following sources: the heavily obscured BAL QSO Mrk 231 (Berta 2005), the Seyfert 2 galaxy IRAS 19254-7245 South (Berta et al. 2003), and the Seyfert 2 galaxy IRAS 22491-1808 (Berta 2005).
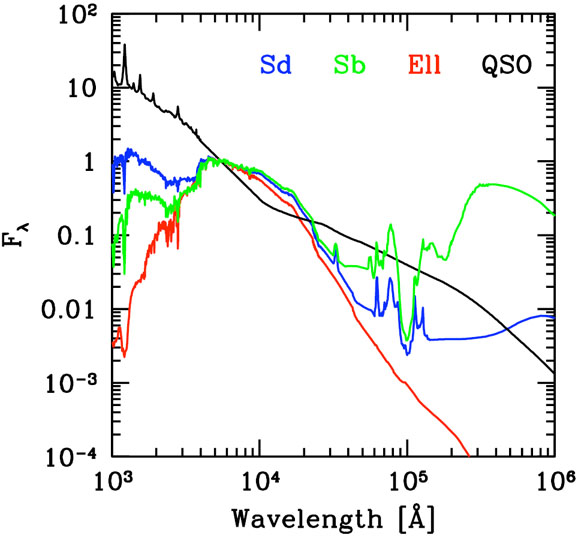 |
Figure 8. Four of the 20 templates from Polletta et al. (2007), as an example of a set of empirically calibrated, multi-wavelength templates [Courtesy M. Polletta]. |
While we presented above only three examples, the number of public datasets (potentially) useful for SED fitting is truly staggering. Many science projects can be carried out without ever writing an observing proposal, the prime example being use of the SDSS database. This is possible thanks to the work of a countless number of individuals on survey planning, data reduction and quality insurance. Below we provide a table of some of the major datasets, for exploration and further reading. We will keep a similar table online on sedfitting.org and we hope to expand it in the future.
| Acronym | Full name | Reference | Website |
| AEGIS | All-wavelength Extended Groth Strip International Survey | Davis et al. (2007) | aegis.ucolick.org |
| COMBO-17 | Classifying Objects by Medium-Band Observations | Wolf et al. (2003) | www.mpia.de/COMBO |
| COSMOS | Cosmic Evolution Survey | Scoville et al. (2007) | cosmos.astro.caltech.edu |
| GAMA | Galaxy And Mass Assembly | Driver et al. (2009) | www.eso.org/~jliske/gama |
| GOLDMINE | Galaxy On Line Database Milano Network | Gavazzi et al. (2003) | goldmine.mib.infn.it |
| GOODS | Great Observatories Origins Deep Survey | Giavalisco et al. (2004) | www.stsci.edu/science/goods |
| LVL | Local Volume Legacy | Dale et al. (2009) | www.ast.cam.ac.uk/research/lvls/ |
| MUSYC | Multiwavelength Survey by Yale-Chile | Taylor et al. (2009) | www.astro.yale.edu/MUSYC |
| SDSS | Sloan Digital Sky Survey | Abazajian et al. (2009) | www.sdss.org |
| SINGS | Spitzer Infrared Nearby Galaxies Survey | Kennicutt et al. (2003) | sings.stsci.edu |
| SSGSS | Spitzer SDSS GALEX Spectroscopic Survey | Treyer et al. (2010) | www.astro.columbia.edu/ssgss |
| SWIRE | Spitzer Wide-area InfraRed Extragalactic survey | Lonsdale et al. (2003) | swire.ipac.caltech.edu |
| VVDS | Vimos VLT Deep Survey | Le Fèvre et al. (2005) | cencosw.oamp.fr |
2 The full library can be downloaded from: http://www.iasf-milano.inaf.it/polletta/templates/swire_templates.html. Back.