


SED fitting is a very versatile tool. From a rough estimation of the stellar masses of distant galaxies to the search for small subpopulations of stars in high S/N spectra, it can be applied to a large part of the problems in galaxy evolution. This is the strength and the weakness of the SED fitting technique: it does it all at once.
We highlight here a few significant results. The intention is not to be complete or to mention the work that has been most in view, but rather to highlight the diversity of questions that can be adressed from fitting the integrated SEDs of stellar populations. Particular importance has been given to supply cautionary remarks, as it is easy to overinterpret the significance of the derived properties, in view of the complexity of the physical mechanisms and our frequent lack of detailed understanding.
Stellar masses are computed by multiplying a mass-to-light ratio M / L with a luminosity L. While the uncertainties on L depend on the quality of the data, the estimate over M / L and its associated uncertainties depend mostly on the care taken with SED fitting. It is a good idea to search for a reference band that minimizes the effects of M / L variations due to stellar populations (age, metallicity, chemical abundances) and due to dust absorption. While the common notion that the NIR (e.g. the H band at 1.65 µm) is close to ideal is correct in some cases, problems can arise because of thermally pulsing asymptotic giant branch stars (discussed in section 2.1.3) if young ages ( < 2 Gyr) are well represented in the SED. That reliable M / L from SED fitting cannot be dispensed with is evident when looking at IRAC 3.6µm data of nearby galaxies, where star formation regions are evidently prominent.
Stellar Mass Maps of Resolved Galaxies In the work of Zibetti et al. (2009) a "data-cube" approach is introduced to investigate the SEDs of nearby, resolved galaxies, aimed at preserving the maximum spatially-resolved information. One feature of the approach is that it allows to compare "global" quantities, which are notoriously difficult to determine, with the integral over the local quantities, a useful test of how meaningful global quantities can be. A large part of the effort concentrated on developing a reliable method to obtain stellar surface mass density maps from a minimum set of broad-band observations.This method relies on Bayesian inference, as discussed in Section 4.5.
The effective mass-to-light ratio correlates with optical / near-infrared colors (e.g., Bell and de Jong 2001), so M / L can be expressed as a function of color(s). A better estimate is obtained if M / L is mapped as a function of two colors, instead of one. The colors adopted are g - i and i - H. Their large wavelength separation allows to robustly describe the shape of the SED over the entire optical-near-infrared range, in a way that as insensitive as possible to photometric and modeling uncertainties.
To study the dependence of M / L on (g-i, i-H) the authors use a Monte Carlo library of 50,000 models created from the 2007 version of BC03, which include also dust in different amounts and spatial distributions. The (g-i, i-H) space is binned in cells of 0.05 mag × 0.05 mag and marginalized over M / L in each cell. The median is chosen as the fiducial M / L at each position of the color-color space. A look-up table is created to derive M / Lh as a function of (g-i, i-H). Figure 23 illustrates that the information in the second color improves the M/L determinations systematically by ± 0.3-0.4 dex.
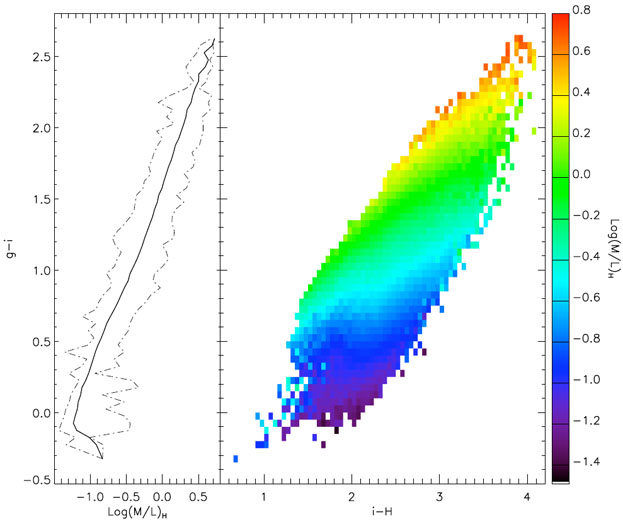 |
Figure 23. Monte Carlo library of 50,000 models created from the Version 2007 of Bruzual and Charlot (2003). The (g-i, i-H) space is binned in cells of 0.05 mag × 0.05 mag and marginalized over M / L in each cell. The right panel shows M / Lh as a function of (g-i, i-H). The scatter at each position is typically 0.11 dex, with peaks at ~ 0.2 dex in the bluest corner. The left panel shows M / L as a function of g-i (median value marginalized in a given g-i bin). The minimum and maximum M / L values derived from the right panel at given g-i are displayed by dashed lines. Figure from Zibetti et al. (2009) [Courtesy S. Zibetti]. |
The method described above is applied to each pixel of the image of a galaxy, where "pixel" implies the pixel that results after matching the images in the three bands to a common resolution. In order to provide sensible results, it is crucial that color measurements do not exceed 0.1 mag errors, which requires S/N ~ 20. The results for M 100 (NGC 4321) are displayed in Figure 24.
 |
Figure 24. Panel a) shows the color-composite RGB image (H in red channel, i in green and g in blue) after adaptive smoothing. Panel b) plots the distribution of pixels in color-color space (log intensity scale). The cross marks the position of the global colors of the galaxy. The over-plotted contours show the number density distribution of models from the library described above. Interestingly, observed colors are reproduced by the models over the full range. Panel c) shows the mass-to-light ratio map derived with the method described above. Finally, Panel d) displays the stellar mass surface density map, obtained by multiplying the H band surface brightness times M / L. Images a) and d) show that the galactic structure is much smoother in the mass image, where spiral arms have much less contrast with respect to what the light shows. Figure from Zibetti et al. (2009) [Courtesy S. Zibetti]. |
An important result appears from the comparison between total stellar mass as obtained by integrating the stellar mass surface density maps (Figure 24d) and the one obtained using global colors to estimate the "average" M / L ratio to be multiplied by L(H). This second method, the one commonly adopted in extragalactic studies, agrees within ~ 10% of the mass map integral only when the color distribution is quite homogeneous, i.e., for early type galaxies. When substantial color inhomogeneities and especially heavily obscured regions are present within a galaxy, using global colors and fluxes can lead to underestimates of the actual stellar mass of a galaxy by up to 60%. This can be understood if dust-obscured regions can contribute a significant amount of mass but are heavily under-represented in the global color, which is flux weighted and hence biased toward the brightest (and bluest) parts of the galaxy. While the pixel-by-pixel M / L gives the correct mass weight to these obscured regions, the globally computed M / L severely underestimates their mass contribution.
Stellar mass functions One of the holy grails of current observational efforts in galaxy evolution studies is a consistent picture of the build-up of stellar mass over the age of the universe. An important constraint on this is the stellar mass function, or its integral, the stellar mass density. A comprehensive discussion of these results would warrant a review of its own. Suffice it here to point out that not only the local mass function has been measured with great precision (e.g. Bell et al. 2003a), but these results have also been extended to redshifts of 1 (Pozzetti et al. 2007, Bundy et al. 2006). At redshifts above 1.2 an observed-frame optical selection corresponds to a rest-frame UV selection, subject to large biases. These therefore have to be circumvented by a K-band selection (e.g. Cirasuolo et al. 2007) or, better, by a selection at 3.6µm (e.g. Arnouts et al. 2007, Ilbert et al. 2010). For observational and conceptual reasons (detailed in Sections 4.5.2 and 4.6), determining stellar masses and therefore mass function at redshifts higher than z=2 is very difficult. Most authors thus prefer to restrict themselves to luminosity functions instead (see e.g. Cirasuolo et al. 2010 for just one very recent example), thus leaving the burden of transforming luminosities to stellar masses to the interpreting model (but see e.g. Kajisawa et al. 2009).
Stellar masses of high redshift galaxies Many authors have used some kind of Bayesian inference-based method (Section 4.5) to determine stellar masses for high redshift galaxies (e.g. Sawicki and Yee 1998, Papovich et al. 2001, Förster Schreiber et al. 2004). There is good hope that these mass estimates are reasonably good (Drory et al. 2004), despite important caveats on the methodology that become more important with improving data quality (see e.g. Section 4.1). A recent result has been the discovery and study of high redshift galaxies with high stellar masses and low star formation rates (early type galaxies, ETGs). In the following we describe only one "family" of papers, as presented at the workshop, but see Cimatti (2009) for a review. Massive ETGs are the first objects to populate the red sequence (see e.g. Kriek et al. 2008b). Objects in the redshift range 2-3 can be identified by multi-band photometry (e.g. van Dokkum et al. 2006). For determining the physical properties however, significant uncertainties are due to photometric redshift determinations. For example Kriek et al. (2008) conclude that while stellar masses are reasonably robust to small errors arising from photometric redshifts, the actual star formation history is generally very poorly constrained with broad band data alone.
The obvious next step is thus to analyze these galaxies with spectroscopy, despite this being an expensive undertaking in terms of telescope time. When doing this, Kriek et al. (2008) also go further in blurring the limits between spectroscopy and photometry by binning their "low" S/N spectra into bins of 400 Å. While the information content remains unchanged, this certainly leads to improvements in presentability and fitting speed. Kriek et al. (2009a) then show explicitly that provided enough photons can be assembled through either exposure time or telescope size, the spectra of galaxies at redshifts 2-3 are amenable to the same kind of analysis as in the local universe. The upshot of these studies is that massive, compact ETGs with very little residual star formation are in place already at redshifts between 2 and 3.
Despite these successes, the study of Muzzin et al. (2009a), Muzzin et al. (2009b) confirms that even using spectroscopic data, model uncertainties mean that SED-derived stellar masses are affected with uncertainties of factors 2-3 at these redshifts. For further discussion on stellar mass determinations the reader is also referred to the review by de Jong & Bell (in prep.).
6.1.2. Deriving SFHs from spectroscopy
Comparing observations to semi-analytic models Trager and Somerville (2009) extend the semi-analytic model of Somerville et al. (2008) to predict the line absorption strengths (Section 4.2) of the resulting galaxies. This allows them to use the same analysis tools that would be used in the analysis of the measured line strengths of an observed sample of galaxies on objects with known properties, in particular star formation histories. They select in particular early type galaxies from the mock catalogues they produce and compute the index strengths of the resulting spectra. These index strengths can then be plotted on the same plots as real data. They come to the sobering conclusion that while the sample of Trager et al. 2008 is of sufficient quality do do a meaningful comparison, it remains too small. On the other hand large samples of galaxies, as the one of Moore et al. (2002), still lack the required precision.
The archeology of the universe The database of the SDSS spectra has been used to derive the SFH of galaxies from their current spectra (e.g. Heavens et al. 2004 see also Section 4.4), a procedure sometimes called "unlocking the fossil record" or simply "astro-archeology". A recent update on this has been presented in Tojeiro et al. (2007), who applied VESPA (see Section 4.4) to the SDSS sample of spectra and derived a catalogue that was made available to the community at http://www-wfau.roe.ac.uk/vespa/. It provides detailed star formation histories and other parameters for SDSS's latest data release (DR7) of the Main Galaxy Sample and the Luminous Red Galaxies sample. Details of the catalogue, including description, basic properties and example queries can be found in Tojeiro et al. (2009).
Combining spectroscopic and dynamic ages The use of spectroscopy in combination with dynamical arguments to understand the evolution of a single object was presented in Pappalardo et al. (2010). The galaxy NGC 4388 is a member of the Virgo cluster and sports a huge trail of HI gas (Oosterloo and van Gorkom 2005). It represent an ideal study case for the effects of ram stripping on a galaxy moving in the intra-cluster medium (Vollmer and Huchtmeier 2003). The stripping age has been estimated to be of order 200 Myr from dynamical arguments. Using VLT/ FORS spectroscopy of the outer and inner regions of the galaxy and the STECKMAP program Ocvirk et al. (2006), Pappalardo et al. (2010) were able to show that, while the inner region of the galaxy is of solar metallicity and has continued forming stars to the present day, the outer regions of the galaxy have sub-solar metallicity and have stopped forming stars roughly 200 Myrs ago, in accordance with the dynamical estimate. Single cases like this can thus help identify the processes and timescale associated with shutting down the star formation in galaxies, one of the most profound changes a galaxy can experience.
Star formation rates Star formation rates from SED fitting have been little used, with most authors preferring to rely on single tracers (see Section 4.5.3 for a comparison). Walcher et al. (2008) have used stellar masses and star formation rates consistently derived from the same SED fit to compare the predicted evolution of the stellar mass function to the observed one. The main result is that while stars form in blue cloud galaxies, most of the growth of the stellar mass function occurs in quiescent galaxies, in agreement with studies based on different tracers of star formation (e.g. Bell et al. 2007). From comparison with merger studies in the same field, Walcher et al. (2008) conclude that about half of the mass growth on the red sequence comes from major mergers and half from minor mergers.
Salim et al. (2007) have compared their SED-fitting SFRs to SFRs determined from emission lines. They find that some galaxies with no detected emission lines nevertheless have substantial SED-based SFRs. They attribute this result to "recent" star formation, i.e. stars that formed long enough ago that their emission lines already vanished, but still recently enough to be revealed in the galaxy SED. Recent HST imaging in the UV which clearly shows SF structures seems to confirm this (Salim & Rich 2010, ApJ submitted).
6.1.3. Identifying and studying outliers
This is an underexplored use of SED fitting, in the opinion of the authors. One example, objects with differing SFR measurements from emission lines and SED fitting has been covered in the last section.
Finding Wolf-Rayet stars The availability of large databases of spectra, such as from the SDSS, and of accurate stellar population model predictions enables the search for rare objects or systematic deviations that are not predicted by the model itself. An example of this are Wolf-Rayet stars, evolved, massive stars with characteristic features. These have ages between 2 × 10⁶ and 5 × 10⁶ years, and are thus a transient feature of galaxy spectra. They are useful as a tracer of recent star formation history as well as the metallicity of their host galaxies. As shown in Brinchmann et al. (2008), a systematic search in the SDSS database yields a sample several times larger than previous serendipitous searches. The essential ingredient of such a search is the accuracy of the stellar population model that allows an inversion technique (Section 4.4) to be applied on a large sample. Indeed, either a smooth correction or residual features from inaccurate models would severely impair the identification of the specific features. As an example Brinchmann et al. (2008) show that the use of the Bruzual and Charlot (2003) models produced a large number of false positives, while an updated version of the same model using different stellar spectra (CB09) provides much better fits.
Dust cannot be ignored when fitting a galaxy's SED, as shown by the cosmic infrared background, which has comparable power to the distinct peak of the cosmic UV-optical background (Hauser and Dwek (2001)). The relative strength of the cosmic background in the infrared suggests a significant processing of the galactic stellar light over the age of the universe. This processing must have also been more significant with increasing redshift as the percentage of stellar light re-radiated by dust is only ~ 30% locally (Popescu and Tuffs 2002), as supported by the increasing number density of luminous IR galaxies up to z ~ 1.3 (Magnelli et al. 2009).
As discussed in section 2, the absorption and emission of light by dust are generally treated as separate processes in modelling, and this is similarly true in SED fitting.
Dust between the observer and the individual stars of a galaxy acts to extinguish and redden the light from those stars. When the stars in our own Galaxy were examined it was found that a simple relation with wavelength was able to describe the extinction and reddening by dust for a wide range of galactic environments, with the only strong feature occurring at ~ 2175Å (Cardelli et al. 1989). A similar but steeper extinction law was found for the Magellanic Clouds, with weaker or non-existent feature at 2175Å (Gordon and Clayton 1998, Misselt et al. 1999). It is these extinction laws that have given rise to the contemporary model of dust in the ISM (i.e. Mathis et al. 1977), and the understanding that the dust composition between the Milky Way and Magellanic clouds is different.
Yet when integrated over the whole of a galaxy the situation becomes
complex, with the geometry of the stars and dust strongly affecting the
resulting spectrum. The effects of varying amounts of extinction of
the different stellar populations due to the spatial distribution of
stars and clumpy dust, and the scattering of blue stellar
light into our line of sight act to flatten the effects of dust on the
spectrum, creating an attenuation law, where the amount of reddening
with extinction is less (or `greyer') than we observe locally
(Witt et al. 1992).
This was exactly what was found in starburst galaxies by
Calzetti et
al. (1994),
and
Charlot and Fall
(2000)
found that a simple screen effective attenuation (i.e. a screen of
dust between the galaxy and observer) with a power-law relation,
 ISM
ISM

 -0.7, was
able to account reasonably well for
the diffuse ISM attenuation in galaxy observations.
It is this complexity that makes disentangling the effects of geometry
and differing dust difficult, and thus the extraction of physical dust
properties from galaxy SEDs problematic. There are two areas where some
progress has been made.
-0.7, was
able to account reasonably well for
the diffuse ISM attenuation in galaxy observations.
It is this complexity that makes disentangling the effects of geometry
and differing dust difficult, and thus the extraction of physical dust
properties from galaxy SEDs problematic. There are two areas where some
progress has been made.
The 2175Å feature The 2175Å feature has been associated with small carbonaceous grains in the ISM (Mathis et al. 1977), and is observed in both the Milky way, M33 (Gordon et al. 1999), and (weakly) in the LMC, but is almost non-existent in the SMC. This feature is not observed in the attenuation law of starburst galaxies (Calzetti et al. 1994). Whether this lack is due to the clumpy geometry of dust and stars (Fischera et al. 2003) or is actually indicative of SMC-like dust in starburst galaxies (Gordon et al. 1999) is still under debate, yet this feature is generally not needed to fit the attenuation of galaxies. In QSOs, which, being dominated by a nuclear source, are closer to the galactic extinction situation, an average attenuation curve does not show this feature, suggesting processing of the ISM in these active objects (Czerny et al. 2004). However, in a few non-local galaxies where direct extinction lines of sight are available, this feature has been observed, suggesting it may be more common than the attenuation curves of local galaxies suggest (Wang et al. 2004, Elíasdóttir et al. 2009). At higher redshifts, where UV spectra are more commonly observed, recent studies find evidence for the existence of the 2175Å bump (e.g. Noll et al. 2007, Noterdaeme et al. 2009).
Young versus old attenuation One important progress made in the treatment of galaxy attenuation is the realisation that the effective attenuation of a galaxy is dependent upon its star formation history. Calzetti (1997) found that in starburst galaxies the effective attenuation of the stellar continuum was less than that suffered by the nebula emission, as measured through emission lines. This clear indication of the clumpiness of the dust in galaxies has been interpreted as an indication of differential attenuation of different stellar populations, with young stars, and their associated ionized nebula, strongly attenuated by the clouds from which the stars formed, while older stars have evolved out of their `birth clouds' either through cloud or stellar dispersion, and are only attenuated by the diffuse ISM dust, which acts on both the young and old stars (see e.g. Charlot and Fall 2000). Exactly what is the clearing time of these clouds and the differential attenuation is still uncertain, and may be galaxy specific, but this forms a basis for current galaxy SED models as discussed in section 2.
Extracting physical properties from dust emission in the IR is difficult for both theoretical and observational reasons: excluding the mid-IR, there are no observed dust features, most being washed out due to the broad shape of the blackbody emission; the IR suffers from strong observational constraints, with most data coming from space- and balloon-based observations; associated with this is the, until recently, limited sensitivity and spatial resolution and in the far-IR, at wavelengths > 100µm, the sparsity of data.
With ISO and, especially, Spitzer space telescopes this situation has recently improved, and will improve more so in the near future with the recent launch of Herschel and ALMA beginning to take form. So we touch upon here some of the galaxy physical properties that have been determined from the dust IR emission.
PAH emission in the Mid-IR As mentioned in section 2, the 5-20µm mid-infrared spectrum of galaxies is generally dominated by broad emission features arising from large molecules, polycyclic aromatic hydrocarbons (see e.g. Smith et al. 2007). Underlying these features is the stellar continuum at short wavelengths and hot dust emission. Confusing the interpretation of the emission features are strong ionic emission lines arising from species such as Ne+ and Ne++ and strong, broad absorption features from silicate grains at 9.8µm and 18µm.
A recent tool, PAHFIT, has been developed to decompose the mid-infrared spectra into its stellar, PAH, dust continuum, and line emission constituents, using functional forms and templates for the features in this wavelength range (Smith et al. 2007). An example of this can be seen in figure 25. The PAH feature luminosity has been used as star formation rate tracers (see section 6.2.4), and the relative strength of these features to the continuum have been found to be strongly linked to the presence of AGN (see e.g. Spoon et al. 2007 and below), and to the gas phase metallicity (see e.g. Smith et al. 2007). The relative strengths of these features can also be used to diagnose the mean size and ionization state of the PAHs, which is related to the average radiation field and dust size distribution (Draine and Li 2007a).
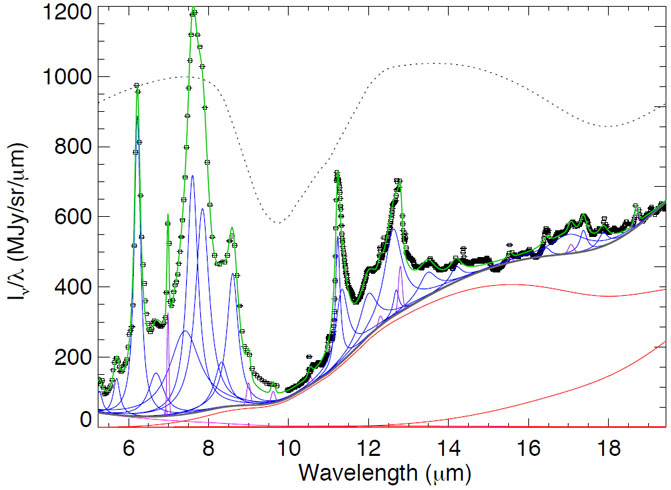 |
Figure 25. An example of combining Spitzer-IRS data with a PAHFIT mid-infrared model. The IRS data arise from the central region of M82 and are marked by the boxes. The PAHFIT final spectrum passes through these points (green line) and can be seperated into PAH features (broad blue curves), fine-structure emission lines (purple narrow cuves), hot dust continuum (underlying red cuves) all experiencing broad dust extinction, especially the pronounced silicate 10 and 18 µm features (represented by the dotted curve). Data are from Beirão et al. (2008). |
Diagnosing the energy source in ULIRGs Due to the high obscuration by dust in IR bright galaxies, especially ultra luminous IR galaxies (ULIRGs), diagnosing the dominant heating source is problematic. The diagram put forward by Spoon et al. 2007 helps resolve this issue by using the strength of the strong silicate absorption feature that is determined from fitting the mid-IR SED (as discussed above in Section 6.2.2) in association with the equivalent width of the PAH features. This diagram cleanly separates different classes of ULIRGs, from obvious Seyfert galaxies, strongly starbursting galaxies, and to deeply buried AGN ULIRGs and represents one of the strengths of IR SED fitting, extracting information from objects which are heavily obscured at shorter wavelengths.
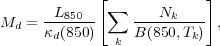
Dust masses One of the more important properties obtained by fitting the IR SED is the dust mass. Through fitting of the far-IR SED the temperature(s) and the relative contributions of the different dust components that make up the SED can be constrained. Then, using knowledge of the emissivity per unit mass of dust, the total dust mass (Md) can be determined, using an equation such as (based on Dunne and Eales 2001);
 |
(5) |
with L850 the 850µm luminosity, and
Nk and Tk the
relative contribution and temperature of dust component
k. The sum of dust components is usually limited
( 3) by the
sparse observational points at long wavelengths, but can also be
represented by an integral of temperatures, parametrized by the
strength of the heating radiation field (such as used by, e.g.
Dale and Helou 2002,
Draine and Li
2007a).
3) by the
sparse observational points at long wavelengths, but can also be
represented by an integral of temperatures, parametrized by the
strength of the heating radiation field (such as used by, e.g.
Dale and Helou 2002,
Draine and Li
2007a).
 d(850) is the
dust mass opacity coefficient, taken to be 0.077 m2
kg-1 by
Dunne et al. (2000),
Dunne and Eales
(2001),
an intermediate value between graphite and
silicate. It is generally with this parameter that most of the
uncertainties in determining dust masses remain.
d(850) is the
dust mass opacity coefficient, taken to be 0.077 m2
kg-1 by
Dunne et al. (2000),
Dunne and Eales
(2001),
an intermediate value between graphite and
silicate. It is generally with this parameter that most of the
uncertainties in determining dust masses remain.
Longer wavelength fluxes (> 300µm, such as 850µm) are preferable to shorter wavelengths when determining dust masses as these sample the Rayleigh-Jeans part of the Planck curve, where the flux is least sensitive to temperature. Longer wavelengths are also more sensitive to the mass of the emitting material, as they are sensitive to cold dust as well as warm.
Clear examples of fitting the far IR SED using simple, emissivity-modified black-bodies and determining the total dust masses can be found in Dunne et al. (2000), Dunne and Eales (2001) and more recently in Clements et al. (2009) (see also da Cunha et al. 2010 Section 6.3 below). These works detail nicely the pertinent issues with both the data and fitting the far-IR SEDs. One of the best examples of determining the total dust mass, as well as other parameters, using the full IR SED was done by Draine et al. (2007b). Their physically based SED models (described in detail in Draine et al. 2007b) were fitted to the far-IR SEDs of galaxies from the SINGS sample, and gave determinations of the total dust mass, PAH fraction and information on the interstellar radiation field heating the dust. They found that dust in spiral galaxies resembled that found in the local Milky Way ISM, with similar dust-to-gas ratios, and that generally it is the diffuse ISM that dominates the total IR power, excluding strong starbursting systems. These results thus confirmed the earlier ISO discoveries (see the review by Sauvage et al. 2005). Note also that even earlier detailed radiative transfer modelling of individual galaxies had pointed to the dominance of the diffuse component (Popescu et al. 2000).
Sub-mm excess emission
SED fitting can not only return physical properties, but can also
indicate where our current knowledge is failing.
As mentioned above, the long wavelength dust emission is a good
handle for the total dust mass. However, when fitting the IR SED of
several dwarf galaxies it has been found that the sub-mm flux is in
excess to a standard cool dust-body emission, requiring additional dust
components at a unreasonably low temperatures
( 7 K) to fit
the SED (e.g.
Lisenfeld et
al. 2002,
Israel et
al. 2010).
While very cold large grains could be one possible cause, other
suggestions have included small stochastic grains that spend most of
their time at cold temperatures
(Lisenfeld et
al. 2002),
rotating dust grains
(Israel et
al. 2010),
or some modification of the dust emissivity at these
wavelengths or temperatures
(Draine and Lee
1984,
Weingartner
and Draine 2001).
Either way until this issue is resolved on the cause of this excess, the
dust mass of these dwarf galaxies such as NGC 1569 will have large
uncertainties. It is hoped that telescopes such as Herschel and ALMA may
find more of these objects in the near future and help find the cause of
this excess emission.
7 K) to fit
the SED (e.g.
Lisenfeld et
al. 2002,
Israel et
al. 2010).
While very cold large grains could be one possible cause, other
suggestions have included small stochastic grains that spend most of
their time at cold temperatures
(Lisenfeld et
al. 2002),
rotating dust grains
(Israel et
al. 2010),
or some modification of the dust emissivity at these
wavelengths or temperatures
(Draine and Lee
1984,
Weingartner
and Draine 2001).
Either way until this issue is resolved on the cause of this excess, the
dust mass of these dwarf galaxies such as NGC 1569 will have large
uncertainties. It is hoped that telescopes such as Herschel and ALMA may
find more of these objects in the near future and help find the cause of
this excess emission.
The infrared-to-ultraviolet ratio is a coarse measure of dust extinction in the ultraviolet, and thus should be related to the amount of reddening in ultraviolet spectra. Indeed, starbursting galaxies follow a tight correlation between the ratio of infrared-to-ultraviolet emission and the ultraviolet spectral slope (e.g. Calzetti 1997, Meurer et al. 1999). Compared to the relation defined by starbursts, normal star-forming galaxies are offset to redder ultraviolet spectral slopes, exhibit lower infrared-to-ultraviolet ratios, and show significantly larger scatter (Kong et al. 2004, Buat et al. 2005, Burgarella et al. 2005, Seibert et al. 2005, Cortese et al. 2006, Boissier et al. 2007, Gil de Paz et al. 2007, Dale et al. 2007). Offsets from the locus formed by starbursting and normal star-forming galaxies can be particularly pronounced for systems lacking significant current star formation, such as elliptical galaxies, systems for which the luminosity is more dominated by a passively evolving older, redder stellar population.
Using a sample of 1000 galaxies with spectroscopy from the SDSS and homogeneous photometric coverage from the UV to 24µm from SDSS and the Galex and Spitzer satellites, Johnson et al. (2007a) found that the sample galaxies span a plane in the three-dimensional space of NUV-3.6µm colour, Dn(4000) index (as defined by Balogh et al. 1999), and infrared excess, IRX (= LIR / LFUV). The three-dimensional relation can be expressed in terms of empirical functions, where IRX is a function of NUV-3.6µm (or more weakly with other colours) and Dn(4000). They suggest that this relation can be explained primarily through SFH and dust attenuation, with both acting to steepen the optical-UV slope (as measured by the NUV-3.6µm color), but only attenuation increasing the IR flux and hence IRX (Johnson et al. 2006).
A similar analysis was presented at the workshop by D. Dale using the
LVL survey (see Section 3.3.1), which
consists of a statistically complete set of star-forming
galaxies, nearly two-thirds of which are dwarf/irregular systems.
Figure 26 shows the ratio of
far-ultraviolet-to-near-infrared luminosity as a function of the
(perpendicular) distance from the starburst curve (e.g.
Calzetti 1997,
Meurer et al. 1999)
for the LVL galaxies, with the far-ultraviolet emission is corrected for
attenuation using the infrared-to-ultraviolet-based recipe formulated in
Buat et al. 2005.
By correcting for dust, the FUV/3.6 µm ratio measures only
the ratio of past-to-present star formation,
sometimes referred to as the birthrate parameter (see also
Boselli et
al. 2001,
Cortese et
al. 2006,
for example). This ratio represents the birthrate parameter since the
far-ultraviolet traces star formation over 100 Myr timescales whereas
the near-infrared probes the total stellar mass built up over much
longer timescales. This plot is as such a compression of the plane
discussed by
Johnson et
al. 2007a,
and shows a clear trend, with lower birthrate systems exhibiting larger
distances from the starburst trend, consistent with the study of
Kong et al. (2004).
To further quantify this, theoretical models with solar metallicity,
1 M yr-1 continuous star formation curves assuming a double
power law initial mass function, with
yr-1 continuous star formation curves assuming a double
power law initial mass function, with
 1,IMF
= 1.3 for 0.1 < m /
M <
0.5 and 2,IMF
= 2.3 for 0.5 < m /
M < 100
were run
(Vázquez and
Leitherer 2005)
and were matched with their determined FUV/3.6 µm ratio on
the right axis, demonstrating that those with the oldest SFH
(i.e. lowest birthrate parameters) lie furthest from the
theoretical starburst curve.
1,IMF
= 1.3 for 0.1 < m /
M <
0.5 and 2,IMF
= 2.3 for 0.5 < m /
M < 100
were run
(Vázquez and
Leitherer 2005)
and were matched with their determined FUV/3.6 µm ratio on
the right axis, demonstrating that those with the oldest SFH
(i.e. lowest birthrate parameters) lie furthest from the
theoretical starburst curve.
 |
Figure 26. The dependence of galaxy star formation history as a function of distance from the starburst relation of Calzetti (1997), Meurer et al. (1999). The lefthand axis is an observable diagnostic of the birthrate parameter, the current star formation rate normalized to the average star formation rate. The righthand axis shows the number of years (continuous) star formation has been occurring, as measured from theoretical spectra. |
6.2.4. Star Formation Rate from the IR
One of the most commonly extracted galaxy properties from the IR is the star formation rate. As discussed above, recently formed stellar populations tend to be more obscured than older stellar populations. They are also more luminous and emit more in the ultraviolet where dust opacity peaks, and thus dust emission is in principle a good tracer of recent star formation, assuming a simple calorimetric situation. It is these assumptions that lead to the widely-used Kennicutt (1998) relation between total IR luminosity (8-1000µm) and star formation rate.
Of course the situation is more complex than this, as discussed in the same work. A range of ages contribute to dust heating (Kennicutt et al. 2009), and star forming regions in galaxies suffer a range of obscurations, from totally obscured (ULIRGs) to unobscured (blue compact dwarfs). It is for this reason that this relation has been re-examined and empirically calibrated with new data from Spitzer. In general, all recent studies have found that the IR can be used as a SFR indicator, albeit without a direct one-to-one connection. Complications arise due to the correlation of SFR, luminosity, and galaxy gas and dust masses, and possible non-linearities due to metallicity effects (Wu et al. 2005).
More specifically,
Calzetti et
al. (2007)
using spatially resolved
observations, found strong correlations between the 24µm and
P luminosity densities
(a proxy for SFR, assuming little attenuation in
the near-IR), and a correlation between the 8µm and
P
luminosity densities, though this failed at low metallicities.
Using these, they were able to create new calibrations for SFR versus
24 µm luminosity, and SFR versus 24 µm and
observed H
luminosities, with the latter relation accounting better for the
escaping radiation not accounted for by the dust emission.
[2992009Rieke et
al.]
took this further, showing that for higher IR luminosity objects,
P was no longer a good
tracer for SFR as even it was obscured, and gave their own calibrations
for SFR with the IR luminosities.
On galactic scales,
Zhu et al. (2008)
showed with a larger galaxy sample from SWIRE that the
Calzetti et
al. (2007)
relations between 24µm luminosity and extinction corrected
H luminosity hold, and
thus L(24µm) is a good SFR indicator. In addition they also
showed that 24µm is well correlated with 70µm
and total IR luminosities, indicating that these too can be used as SFR
indicators, albeit with larger scatter.
The 8µm (and other PAH bands) and longer wavelength observations, such as the Spitzer 160 µm band, are observed to be correlated with each other (Bendo et al. 2008), and are thought to be more associated with the cooler diffuse ISM. While the diffuse ISM is heated by the radiation from star forming regions, it is also heated by the diffuse radiation field from older stars, meaning that these bands are not as strong SFR traces, especially at low SFRs.
6.3. Fitting the full UV to FIR SED
Fitting a self-consistent model over the divide between stellar and dust emission in the SED is of course one of the ultimate goals of SED fitting. However, while modelling efforts are well-underway (see Section 2.2.3), unfortunately, few authors have attempted to apply these to large samples of galaxies. Inversion techniques are not applicable here, as the problem is highly non-linear with many free parameters and therefore time consuming. Even for calculation of a library of model galaxies, it is challenging to provide models that are sufficiently simple, complete and fast to make this a practical possibility.
We here need to bypass instances where modellers test their codes on
single galaxies (e.g.
Silva et al. 1998,
Popescu et
al. 2000,
Groves et
al. 2008).
This is of course a most valuable and necessary step to make sure that
the model does bear on our understanding of reality and to further our
knowledge of the underlying physics. Most of the results from these
studies have been presented above in
Section 2. For the potential novice reader
of this manuscript we nevertheless emphasize at this point that proper
filter convolution and
 2 fitting cannot
be replaced by by-eye passing of spectra through photometric data points.
2 fitting cannot
be replaced by by-eye passing of spectra through photometric data points.
Using the model by
da Cunha et
al. (2008),
in a follow-up paper
(da Cunha et
al. 2010)
have demonstrated the
strength of fitting the full SED from UV to IR wavelengths. By fitting
the full SEDs of ~ 3000 galaxies with GALEX, SDSS, 2MASS, and IRAS
data, they were able to determine the star formation rate, the star
formation history as measured by the specific star formation
( s = current
0-108Myr star formation rate divided by the past average star
formation rate), dust and stellar masses and other parameters. They found a
strong correlation of dust mass (Md) to star formation
rate (, in
M
yr-1), shown below in equation 6), as well as relations
between the dust to stellar mass ratio and
s, and the
fraction of IR emission arising from the diffuse ISM and
s.
s = current
0-108Myr star formation rate divided by the past average star
formation rate), dust and stellar masses and other parameters. They found a
strong correlation of dust mass (Md) to star formation
rate (, in
M
yr-1), shown below in equation 6), as well as relations
between the dust to stellar mass ratio and
s, and the
fraction of IR emission arising from the diffuse ISM and
s.
 |
(6) |
This work demonstrates clearly the connection between dust mass, star formation history and stellar evolution.
Iglesias-Páramo et al. (2007)
have gone to the length of using the GRASIL code
(Silva et al. 1998)
to compute a library of 5000 model galaxies and then use Bayesian
inference to derive the properties of their sample. Their general
results agreed well with independent studies by other authors, thus
lending support to the notion that full SED fitting is a reliable tool
to derive galaxy properties. More importantly in the present context,
they show that their reduced
2 distribution
has a median value of 2.6, albeit with a long tail extending well above
10. Thus the GRASIL library is found to reproduce their sample fairly
well. Nevertheless, from the point of view of reliable SED fitting
tools, a more thorough analysis of the outliers (model uncertainties,
incomplete libraries, AGN, etc.) would be valuable, not only in this but
in many other works.
Noll et al. (2009) present a new code, which they call "CIGALE", which effectively computes a library of model galaxies and then uses a modified version of the Bayesian inference described in Section 4.5 to determine the galaxy properties. Diagnostic plots like their Figure 14, which shows the residuals between best fit model and data for their full sample, are a very useful tool to understand model systematics. In their case for example, they conclude that "For MIPS 160 µm the significant deviations can partly be explained by the lacking flexibility of the one-parameter models of Dale and Helou (2002)."
As shown by the last two examples, most UV-FIR SED fitting codes are still in their testing phase and have mostly been used to confirm results already obtained from more traditional single-tracer analyses. The large number of derived parameters and our still limited knowledge of their respective degeneracies and systematic uncertainties make it difficult to go a step further and fully use the full power of SED fitting. Indeed, for the moment it is still questionable whether it is not more fruitful to use a combination of single tracers to derive one property well (e.g. Kennicutt et al. 2009 for SFR). On the long run, however, SED fitting holds the promise to provide a large set of galaxy properties for large samples. Self-consistent inter-comparison of sub-samples with different properties, such as masses and SFRs, and the exploitation of constraints on hitherto unconstrainable parameters, such as the relative weights of young, intermediate age and old populations, are an exciting avenue to explore further in the future.