Copyright © 2009 by Annual Reviews. All rights reserved
| Annu. Rev. Astron. Astrophys. 2009. 47:
159-210 Copyright © 2009 by Annual Reviews. All rights reserved |


3.1. General description and identification
We begin exploring the population of galaxies in more detail with the spirals, which for our purposes we define as disk galaxies with ongoing star-formation. In Figure 7, we show a sampling of optical images of nearby spirals from the SDSS, according to the NED classifications mentioned in Section 2.1. We have sorted these galaxies by absolute magnitude on the horizontal axis and g - r color on the vertical axis. An overall trend can be seen that the reddest spirals tend preferentially to have visible dust, and are often edge-on (Section 3.6). The more luminous spirals tend (with exceptions) to have more evident and more regular spiral structure. A prominent feature in many spirals is a reddish, smooth, central component, the "bulge" (Section 3.3).
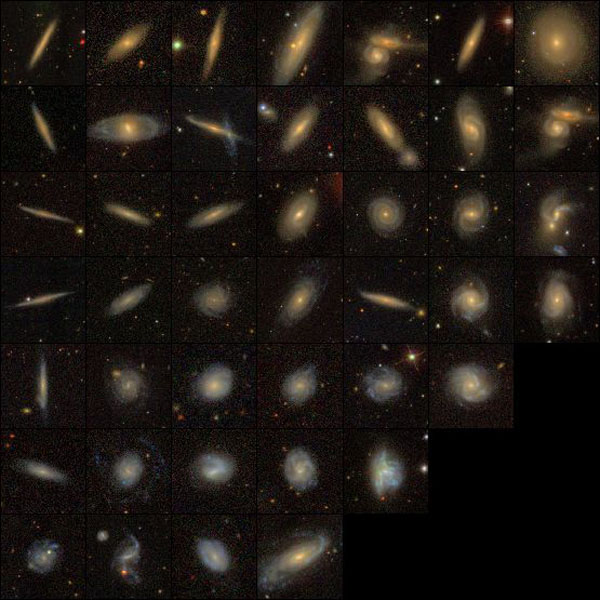 |
Figure 7. SDSS images of spiral galaxies, selected according to classifications in NED to be Sa-Sd (including barred types). The images are sorted by absolute magnitude in the horizontal direction, ranging between Mr - 5log10 h~ -18.5 and -22 from left to right, and g - r color in the vertical direction, ranging between 0.2 and 0.9 mag from the bottom to the top. Thus, the brightest, reddest spirals are in the upper-right. The galaxies shown were selected randomly, except we excluded two cases from the original set due to image defects. |
Figure 8 shows the distribution of spirals in the space of absolute magnitude, color, size and Sérsic index. Here we have colored the points according to the spiral subtype: blue for Sc and Sd galaxies, cyan for Sb galaxies, and green for Sa galaxies. Figure 8 (and Figure 12, described later) represent an updated look at the physical properties along the Hubble sequence that we first learned from Roberts & Haynes (1994). There is a strong trend for the later type spirals to be lower in luminosity, closer to exponential, and bluer. The early type spirals define a (broad) red sequence, and are concentrated and luminous. They occupy a different place in the size-luminosity relation, one that overlaps considerably with the ellipticals (Section 5; see also Courteau et al. 2007). Indeed, in these gross properties Sa galaxies are remarkably similar to ellipticals.
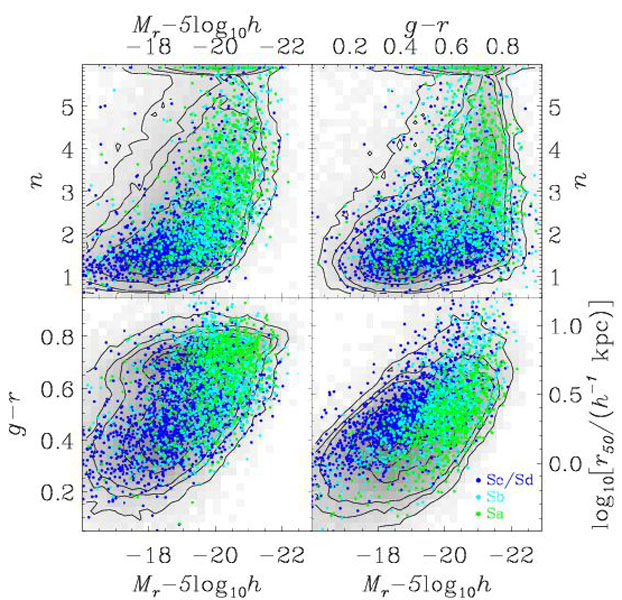 |
Figure 8. Distribution of various spiral galaxy types in optical broadband properties. The underlying greyscale and contours are from the full data of Figure 1. Using classifications stored in NED, we overplot the positions of Sa (green), Sb (cyan), and Sc or Sd (blue) galaxies. We include the barred varieties. |
The overall morphological separation according to Sérsic index is driven by the relative importance of the bulge to morphological classification. Of course, the meaning of the Sérsic index for spiral galaxies is different than for elliptical galaxies. For spiral galaxies n reflects the balance between the disk and the bulge, two clearly distinct components. By contrast, for elliptical galaxies n usually reflects the overall structure of what is apparently a single component (Section 5.2).
3.2. Quantitative morphological measures
Astronomers have traditionally classified spiral galaxies from early to late type based on three criteria: the spiral arm pitch angle, the organization of the spiral arms, and the prominence of the bulge (Hubble 1936, Sandage 1961, de Vaucouleurs 1959). Traditional classifications are performed by eye from experience, but that technique is subjective and cannot be applied to massive samples. The influence of the bulge criterion as reflected in the Sérsic index n is evident in Figure 8. In contrast, the relative importance of the spiral structure considerations vary among classifiers. As an example, classifiers differ on at least two cases: low bulge-to-disk ratio galaxies with little spiral structure (Koopmann & Kenney 1998), and high bulge-to-disk ratio galaxies with late-type spiral structure (Hameed & Devereux 2005). One particular consequence of the latter ambiguity is that RC3 types (which emphasize the bulge-to-disk ratio) tend to be earlier than those from the Revised Shapley-Ames Catalog (Sandage & Tammann 1981). These concerns have prompted a good deal of work on the "quantitative morphology" of galaxies. This work has two general goals, often conflated: (1) to reduce the complex information in galaxy images to a few simple measurements; and (2) to classify galaxies.
Quantitative morphology often focuses on the separation of the disk from the bulge component, often using standardized packages such as GIM2D (Simard 1998), GALFIT (Peng et al. 2002) or BUDDA (de Souza, Gadotti & dos Anjos 2004). We discuss the detailed nature of bulges and bars in Section 3.3; here we discuss their demographics and relationship with galaxy morphology. Image decomposition methods usually treat the disk as exponential, but use more complex models for the central component. At minimum they must include a general Sérsic profile bulge (they are only rarely exactly de Vaucouleurs profiles; Graham 2001, de Jong et al. 2004, Laurikainen et al. 2007). More generally, as Section 3.3 discusses, there are at least three classes of central galaxy components - classical bulges (usually n > 2), pseudobulges (usually n < 2; Fisher & Drory 2008), and bars (usually n ~ 0.5-1; Gadotti 2009). These components can and often do co-exist within the same galaxy. As a further caveat, ground-based observations of even relatively nearby galaxies may have Sérsic indices artificially raised by the presence of nuclear components (Balcells et al. 2003).
For these reasons, three-component galaxy fits (disk, general Sérsic profile bulge, and bar) are now the state-of-the-art. In particular, investigators have recognized that the bar component has a strong influence on the fits (e.g. de Jong 1996, Wadadekar, Robbason & Kembhavi 1999, Laurikainen, Salo & Buta 2005, Reese et al. 2007, Gadotti 2008b, Weinzirl et al. 2009). Relative to two-component analyses, the remaining bulges after bar subtraction are smaller (often by a factor of two or more), have have lower n, and are more likely to be pseudobulges.
These complications make the demographics of bulges, pseudobulges and
bars difficult to measure in large surveys. Among the larger analyses
are those of
Allen et al. (2006)
and
Driver et
al. (2007),
who fit two-component models in the Millenium Galaxy Catalogue redshift
survey, and
Gadotti (2009),
who fit three-component models in the SDSS.
Although the stellar mass fractions of each analysis are not easily
comparable, they both conclude that classical bulges account for at
least ten times the stellar mass that pseudobulges do. As a
cautionary note, other (typically smaller but more carefully analyzed)
samples do find pseudobulges more commonly at least for low B /
T galaxies
(Graham 2001,
de Jong et
al. 2004,
Laurikainen
et al. 2007).
All things considered, probably the best current accounting of the
stellar mass fractions in various components is that of
Gadotti (2009),
who report that for M > 1010
M , 32%
of the stellar mass is in ellipticals, 36% is in disks, 25% is in
classical bulges, 3% is in pseudobulges, and 4% is in bars.
, 32%
of the stellar mass is in ellipticals, 36% is in disks, 25% is in
classical bulges, 3% is in pseudobulges, and 4% is in bars.
Beyond disk/bulge decompositions, a number of sophisticated techniques have been developed to measure more complex "morphological" information. Some methods depend on high-order decompositions of the galaxy images, for example using Fourier modes (Odewahn et al. 2002) or shapelets (Kelly & McKay 2004). Other approaches have used a combination of measured parameters, for example, concentration (Abraham et al. 1994), asymmetry (Schade et al. 1995) and smoothness (Conselice 2003, Yamauchi et al. 2005). More recently explored parameters are the Gini coefficient - a measure of the evenness of the light distribution - and a concentration-like parameter called M20 (Lotz, Primack & Madau 2004, Zamojski et al. 2007). Most investigators eschew color information, for reasons we do not fully understand, with the notable exception of Choi, Park & Vogeley (2007), who utilize galaxy color and color gradient.
Once galaxies properties are measured, classification can be performed using these parameters with simple cuts in parameter space (e.g., Choi, Park & Vogeley 2007), with the aid of dimensionality reduction techniques like principal component analysis (e.g., Ellis et al. 2005, Scarlata et al. 2007), or using artificial neural networks (e.g., Storrie-Lombardi et al. 1992, Ball et al. 2004). Doing so can effectively classify galaxies into groups such as mergers, elliptical galaxies, early-type spirals, late-type spirals and irregulars. In some cases these classifications are reproducible and do a reasonable job of reproducing classical morphological classes (e.g., Scarlata et al. 2007).
None of these methods, however, distinguish well between face-on S0s, Sa galaxies and Es - the essential ambiguity also present in Figures 8 and 12. In addition, the agreement of quantitative morphological classification with eyeball determinations obscures the differences in approach. The quantitative schemes do not measure in detail the differences in spiral structure in the later types that are essential to classical morphology and apparent to the eyes of experts (e.g. Elmegreen & Elmegreen 1987, van den Bergh et al. 2002). Generally speaking, although quantitative measures of spiral structure exist (e.g., Elmegreen & Elmegreen 1984, Rix & Zaritsky 1995, Seigar & James 22002, Buta et al. 2005, Kendall et al. 2008), they are rarely used for morphological classification.
Therefore, the agreement among galaxy classification systems reflects the importance of the relatively easily measureable B / T and not the nature of the spiral structure. The latter awaits a quantitative, objective, and large-scale analysis.
3.3. Bulges, pseudobulges, and bars
Spirals often have reddish, smooth central components (see Figure 7). As we alluded to in Section 3.2, these components can be divided into at least three classes: classical bulges, pseudobulges and bars, each of which has different detailed properties and probably different formation mechanisms (Wyse, Gilmore & Franx 1997, Kormendy & Kennicutt 2004). The common interpretation holds that while classical bulges are built by mergers, pseudobulges are built by secular processes within disks, perhaps abetted by the presence of the bar in the bulge component. The formation of the bars themselves and the role of their interaction with the surrounding density field is a matter of debate (Sellwood 2000, Athanassoula 2003, Gadotti & de Souza 2005). We discuss all three componenets together here because observationally they are difficult to distinguish.
The classical bulges usually but not always contain older stellar
populations than the stellar disks that surround them
(Moorthy &
Holtzman 2006).
They are often enhanced in
 -elements,
but less so than comparably luminous elliptical galaxies and with more
scatter
(Ganda et al. 2007,
Peletier et
al. 2007).
Dynamically, many are
likely "oblate rotators:" consistent with having an isotropic
velocity dispersion and being flattened by rotation
(Kormendy &
Kennicutt 2004,
and references therein). Finally, many but not
all have concentrated Sérsic-like profiles with high
n. Typically,
the larger the bulge-to-disk ratio of the galaxy as a whole, the more
concentrated the bulge itself is as well
(Graham 2001,
Gadotti 2009).
-elements,
but less so than comparably luminous elliptical galaxies and with more
scatter
(Ganda et al. 2007,
Peletier et
al. 2007).
Dynamically, many are
likely "oblate rotators:" consistent with having an isotropic
velocity dispersion and being flattened by rotation
(Kormendy &
Kennicutt 2004,
and references therein). Finally, many but not
all have concentrated Sérsic-like profiles with high
n. Typically,
the larger the bulge-to-disk ratio of the galaxy as a whole, the more
concentrated the bulge itself is as well
(Graham 2001,
Gadotti 2009).
In contrast, as the review of Kormendy & Kennicutt (2004) emphasizes, pseudobulges have significant rotation support, are flatter than classical bulges, have exponential profiles, and have circumnuclear star-formation. Spectroscopically, they tend to have Dn(4000) similar to galaxies on the blue sequence (Gadotti 2009). Although classical bulges lie on the relationship between luminosity and size defined by elliptical galaxies (the Kormendy relation), pseudobulges have lower surface brightness and thus lower luminosity for a given size (Gadotti 2009). Pseudobulges are more common and more dominant in later type (or alternatively, lower B / T ratio) spiral galaxies (Ganda et al. 2006, Barazza, Jogee & Marinova 2008). In this manner they form a continuous sequence of increasing bulge Sérsic index n with bulge-to-disk ratio (Gadotti 2009).
Although photometrically pseudobulges and classical bulges are difficult to disentangle within the same galaxy, integral field spectroscopy allows it more easily. For example, the recent analysis of about 40 galaxies using SAURON suggests that many bulges (of order half of them) may actually consist of both a classical bulge and a pseudobulge, with the pseudobulge occasionally dominating (Ganda et al. 2006, Peletier et al. 2007).
Bars are elongated stellar structures located in the central regions of disk galaxies (Kormendy & Kennicutt 2004, Gadotti 2008a). They are not simply extrema in the distribution of bulge axis ratios, but rather are a separate population (Whyte et al. 2002). Historically, bars have been identified by eye using a variety of (presumably subjective) criteria (de Vaucouleurs 1963, Eskridge et al. 2000). The most widely adopted quantitative technique for identifying bars is the ellipse-fitting method, in which a bar must exhibit a characteristic signature in both the ellipticity and position angle profiles (Marinova & Jogee 2007, Barazza, Jogee & Marinova 2008, Sheth et al. 2008). A simplified version of this technique measures the difference in the axial ratio and position angles of a best-fit ellipse to one interior and exterior isophote (Whyte et al. 2002). In general, the visual and ellipse-fitting methods agree about 85% of the time, with egregious disagreement only ~ 5% of the time (Menéndez-Delmestre et al. 2007, Sheth et al. 2008). In edge-on galaxies, as Combes & Sanders (1981) first pointed out, bars result in "boxy" or "peanut" shaped bulges (Athanassoula 2005, Bureau et al. 2006).
About 50%-70% of luminous spiral galaxies have bars (de Vaucouleurs 1963, Eskridge et al. 2000, Whyte et al. 2002, Marinova & Jogee 2007, Menéndez-Delmestre et al. 2007, Barazza, Jogee & Marinova 2008). The fractional luminosity of the bar relative to the total light varies by more than an order-of-magnitude, ranging from below 2% up to 20% (Elmegreen & Elmegreen 1985, Gadotti 2009). Eskridge et al. (2000) found that the bar fraction in the near-infrared was independent of morphology, while a more recent study by Barazza, Jogee & Marinova (2008) with a considerably larger sample found that the bar fraction is higher in blue, lower-luminosity, late-type disks compared to more massive, red, early-type galaxies. However, bars in early-type galaxies tend to be stronger (i.e., more elongated) and longer, both in an absolute sense and relative to the size of the disk (Kormendy 1979, Elmegreen & Elmegreen 1985, Erwin, Beckman & Pohlen 2005, Menéndez-Delmestre et al. 2007).
Bars are typically dominated by evolved stellar populations (Gadotti & de Souza 2006), although they are also associated with enhanced nuclear and circumnuclear star formation (Ho, Filippenko & Sargent 1997), and frequently exhibit dust lanes, which is a signature of radially inflowing gas (Kormendy 1982, Athanassoula 1992, Sellwood & Wilkinson 1993, Friedli & Benz 1993). Barred galaxies are also observed to have larger reservoirs of molecular gas in their centers relative to unbarred galaxies (Sakamoto et al. 1999, Sheth et al. 2005) and flatter chemical abundance gradients (Zaritsky, Kennicutt & Huchra 1994, Martin & Roy 1994).
Simulations suggest that strong interactions can trigger the formation of a bar (Berentzen et al. 2004). This hypothesis is supported by observations showing that bars are two times more likely to be present in "perturbed" galaxies (i.e., galaxies with a nearby companion), relative to isolated galaxies (Varela et al. 2004). Kannappan, Jansen & Barton (2004) argue similarly that blue bulges, that may be growing due to star-formation today, are more common in close pairs. However, we found no publications describing a large-scale exploration of whether the detailed nature of the bulges or the presence of a bar is otherwise strongly related to environment.
3.4. Atomic and molecular gas content
Most of the baryons in the Universe appear to be in warm or hot gas in the space between galaxies (in groups and clusters, this gas is directly detectable in the X-rays; Mulchaey 2000, Rosati, Borgani & Norman 2002). According to the census of Read & Trentham (2005), about ~ 80% of the remaining baryons are in stars, and the rest are in atomic gas (~ 10%) and molecular clouds (~ 10% ). The cold gas is overwhelmingly located in galaxies with gas disks (though not completely absent in ellipticals; Section 5.8). In particular, luminous spirals tend to have about 10%-20% of their baryonic content in the form of neutral hydrogen and molecular clouds.
The census of atomic hydrogen in galaxies relies on the 21-cm hyperfine transition, either in blind surveys such as HIPASS and ALFALFA, or in compilations such as those of Springob et al. (2005). THINGS has recently released a survey of 34 nearby galaxies with extremely detailed observations (Walter et al. 2008). As an illustration, the top panel of Figure 9 shows the ratio of atomic to stellar gas mass, as a function of stellar mass. The greyscale shows the results from Springob et al. (2005) (using galaxies for which we have the stellar mass from SDSS). The overlaid points are from Hi observations of SINGS galaxies (Kennicutt et al. 2003, Draine et al. 2007, Walter et al. 2007, Leroy et al. 2008). Clearly low mass galaxies tend to have much higher atomic gas content than massive galaxies, as has been known for a long time (Young & Scoville 1991).
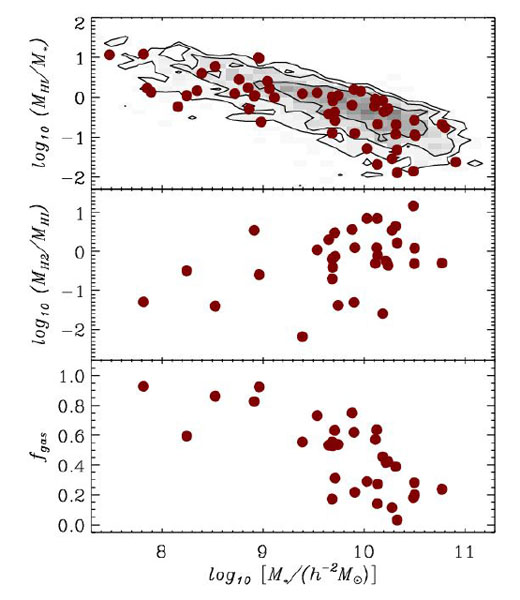 |
Figure 9. Neutral and molecular gas content of spiral galaxies. The top panel shows the fraction of neutral gas relative to the stellar mass, as a function of stellar mass. The greyscale is from a combination of data in the Springob et al. (2005) compilation of HI data, matched to the SDSS sample (using the formulae of Bell et al. (2003) to determine stellar mass). The points are from SINGS. The middle panel shows the ratio of molecular hydrogen gas mass (inferred from the CO (1 → 0) transition) to neutral gas mass for the SINGS sample. The bottom panel shows the total neutral plus molecular gas fraction as a function of stellar mass. |
Determinations of molecular hydrogen mass in galaxies typically rely on carbon monoxide as a tracer, using the CO (1 → 0) transition at 2.6 mm (Young et al. 1995). In the middle panel of Figure 9, we show the ratio of H2 to atomic hydrogen content for the SINGS galaxies. Although for luminous galaxies a substantial fraction of the gas, indeed often the majority, is in molecular form, the fraction appears to decline at lower luminosities. The bottom panel of Figure 9 shows the total gas fraction for SINGS galaxies as a function of stellar mass. Owing mainly to a fractional increase in atomic hydrogen, low mass galaxies are much more gas rich - they have been less efficient at turning gas into stars than their massive counterparts.
A class of spiral galaxies exists with very little atomic gas; they are known as "anemic" or "passive" spirals (van den Bergh 1976, Elmegreen et al. 2002). For spiral galaxies of a given optical diameter and morphological type, those in clusters to be "Hi-deficient" relative to those in the field, and to have a correspondingly smaller Hi radius as well, and are thus more likely to be anemic (e.g., Giovanelli & Haynes 1983, Haynes, Giovanelli & Chincarini 1984, Warmels 1988, Cayatte et al. 1994, Vogt et al. 2004, Boselli & Gavazzi 2006, Levy et al. 2007, Chung et al. 2008). Clearly the atomic hydrogen in galaxies is being affected by the cluster environment, likely by ram pressure stripping or related processes (Gunn & Gott 1972) - often seen in the process of happening, e.g. by Chung et al. 2007 - and at least in some cases is resulting in the stripping of atomic gas from the outside in. Meanwhile, the molecular gas content is not deficient, at least when based on CO tracers (Kenney & Young 1988, van den Bergh 1991, Boselli et al. 1994, Casoli et al. 1998, Boselli & Gavazzi 2006). The high molecular clouds densities may prevent their stripping.
Despite its importance, ram pressure stripping in rich clusters cannot explain the broader segregation of galaxy types, which extends even to small groups (Section 2.5). In those regions, which do exhibit environmental effects according to galaxy color, most analyses nevertheless have found few H i deficient galaxies (Stevens et al. 2004, Kilborn et al. 2005). In small groups, mergers or other processes might be lowering the Hi content while simultaneously altering the galaxy morphology, which would not necessarily result in deficiencies as they are currently defined.
A variety of both direct and indirect techniques have been developed to measure the globally averaged star-formation rates (SFRs) of galaxies, as reviewed in detail by Kennicutt (1998b) (see also Hopkins et al. 2003, Moustakas, Kennicutt & Tremonti 2006, Calzetti 2008). More recently, observations with Spitzer and GALEX have led to a new class of hybrid SFR indicators that use a weighted combination of UV/optical and infrared luminosity to minimize the systematic effects of dust obscuration (Gordon et al. 2000, Kennicutt et al. 2007, Calzetti et al. 2007, Rieke et al. 2008).
Surveys like the SDSS and GALEX have also quantified the
star-formation histories of galaxies in unprecedented detail (e.g,
Gallazzi et
al. 2006,
Panter et
al. 2007,
Cid
Fernandes et al. 2007).
One method of
parameterizing the star-formation history is to measure the birthrate
parameter b = SFR / < SFR >, or the ratio of the
current rate to the past-averaged rate of star formation
(Kennicutt
1983,
Kennicutt,
Tamblyn & Congdon 1994,
Boselli et
al. 2001,
Brinchmann et
al. 2004).
The birthrate parameter is also proportional to the specific SFR,
or the SFR relative to the present-day stellar mass. Analyses using
H
(Brinchmann et
al. 2004)
and UV measurements
(Salim et al. 2007,
Schiminovich
et al. 2007)
have shown that b is a slowly
declining function of stellar mass (b
 M-1/3). Most
galaxies are in a relatively "quiescent" state, with only about 20%
in star-bursting systems (b > 2;
Kennicutt et
al. 2005).
On this
"star-forming" sequence, the surface density of star-formation in
galaxies is nearly constant. This relationship is truncated where
massive ellipticals begin to dominate the mass function, as their SFRs
are often unmeasurably small using these techniques.
M-1/3). Most
galaxies are in a relatively "quiescent" state, with only about 20%
in star-bursting systems (b > 2;
Kennicutt et
al. 2005).
On this
"star-forming" sequence, the surface density of star-formation in
galaxies is nearly constant. This relationship is truncated where
massive ellipticals begin to dominate the mass function, as their SFRs
are often unmeasurably small using these techniques.
Comparison of the local gas surface density with the SFR surface
density reveals the relationship first discussed by
Schmidt (1959):
 SFR
gasn, with n ~ 1-2
(Kennicutt
1989,
Kennicutt
1998a,
Wong & Blitz
2002,
Boissier et
al. 2007).
Recent results suggest a much
more direct relationship between SFR and molecular gas content
(Blitz &
Rosolowsky 2006,
Kennicutt et
al. 2007,
Bigiel et
al. 2008,
Leroy et al. 2008).
The anemic spiral galaxies with low atomic and molecular gas content
(Section 3.4) show correspondingly low SFRs, probably
owing to their low gas surface density
(Elmegreen et
al. 2002).
Interestingly, the
efficiency of the conversion of molecular gas into stars is nearly
independent of the galaxy type, its larger-scale environment, or the
particular local conditions within the galaxy
(Rownd & Young
1999,
Leroy et al. 2008).
SFR
gasn, with n ~ 1-2
(Kennicutt
1989,
Kennicutt
1998a,
Wong & Blitz
2002,
Boissier et
al. 2007).
Recent results suggest a much
more direct relationship between SFR and molecular gas content
(Blitz &
Rosolowsky 2006,
Kennicutt et
al. 2007,
Bigiel et
al. 2008,
Leroy et al. 2008).
The anemic spiral galaxies with low atomic and molecular gas content
(Section 3.4) show correspondingly low SFRs, probably
owing to their low gas surface density
(Elmegreen et
al. 2002).
Interestingly, the
efficiency of the conversion of molecular gas into stars is nearly
independent of the galaxy type, its larger-scale environment, or the
particular local conditions within the galaxy
(Rownd & Young
1999,
Leroy et al. 2008).
Resolved H measurements
imply a threshold gas density defined
by local conditions, below which the SFR is much lower than predicted
by the Schmidt law
(Kennicutt
1989,
Martin &
Kennicutt 2001).
Typically, the gas density falls below the threshold in the outer
disk. Theoretically, such a threshold could be imposed by the
Toomre (1964)
stability criterion, which predicts the conditions
under which disks are stable to collapse and star formation
(Schaye 2004).
In contrast to the H
results, UV
observations from GALEX reveal a much smoother transition at large
disk radii and few direct signs of a stability threshold
(Boissier et
al. 2007,
Leroy et al. 2008).
As discussed in Section 2.5, the
fraction of galaxies with young
stellar populations is a strong function of environment. However, it
appears that the details of the star-formation history are not closely
related to environment: in fact, long time-scale stellar population
indicators such as Dn(4000) and g - r
are sufficient to describe the dependence. Shorter time-scale indicators
like H absorption
(Kauffmann et
al. 2004)
and H emission
(Cooper et
al. 2008)
are related to Dn(4000) and g - r in a
manner that is independent of environment. This result may imply that
the time scale for any shut-off of star-formation in dense regions is
usually rather long for most galaxies.
absorption
(Kauffmann et
al. 2004)
and H emission
(Cooper et
al. 2008)
are related to Dn(4000) and g - r in a
manner that is independent of environment. This result may imply that
the time scale for any shut-off of star-formation in dense regions is
usually rather long for most galaxies.
Spatially resolved studies of spiral galaxies in clusters suggest that their star formation is most significantly reduced in their outer disks, similar to the results on Hi deficiency (Koopmann & Kenney 1998, Vogt et al. 2004, Koopmann, Haynes & Catinella 2006). This effect is likely a further sign of the impact of ram pressure stripping in those regions.
A small fraction, about 0.1%, of the baryonic mass in spiral galaxies is in the form of dust, but its presence is disproportionately important to the evolution of galaxies and our observations of them. Draine (2003) reviews the properties of dust in galaxies, which consists primarily of grains of graphite or silicon a micron or less in size, with between 1%-5% of its mass in polycyclic aromatic hydrocarbons (PAHs). Most of the interstellar Mg, Si, and Fe, and much of the carbon, is in the form of dust grains. Draine et al. (2007) has performed a recent census of the dust content of galaxies using the SINGS sample (see also Dale et al. 2007).
Dust tends to efficiently absorb the UV/optical light emitted by the massive stars produced by recent star-formation. Since the dust temperatures are of order 10-100 K, this light is then reradiated in the infrared (Obric et al. 2006). Especially in the galaxies with the greatest star-formation rates, the UV/optical light therefore traces only the unobscured star-formation, and IR observations are necessary to determine the rest (Section 3.5).
The optical dust extinction also of course affects the optical emission and the broad-band colors in the near-infrared and bluer. For galaxy observations, this extinction can be a confusing factor, especially since its impact is highly dependent on the inclination angle of the galaxy disk relative to the line-of-sight (as well as other geometrical effects; Witt & Gordon 2000). Thus, the colors of spirals galaxies are a strong function of their axis ratios, an effect that sometimes needs to be accounted for (e.g., Maller et al. 2009 and references therein).
Like the molecular gas content, the dust-to-gas ratio of galaxies appears to be a strong function of galaxy mass. For example, inclination-dependent reddening is substantially weaker for low mass galaxies (e.g., Tully et al. 1998, Maller et al. 2009). Using a sample of edge-on galaxies, Dalcanton, Yoachim & Bernstein (2004) claim that galaxies with Vc < 100 km s-1 have no dust lanes. In addition, the low mass galaxies tend to show less dust emission relative to stellar emission, and fewer PAHs relative to dust as a whole (Draine et al. 2007). That low-mass galaxies tend to be less dusty is likely related to their relatively low gas-phase metallicities (Section 3.7).
The gas phase chemistry of spiral galaxies also shows some revealing
trends, as Figure 2
demonstrates. As shown by
Tremonti et
al. (2004),
mass and metallicity are strongly correlated at
low masses, with the metallicities approaching an approximately
constant value at masses M
 1010
M.
1010
M.
A more revealing measurement than gas phase metallicity is often the effective yield: the metallicity relative to the gas fraction. In closed boxed chemical evolution models, the metallicity tracks the gas fraction as Z = yt lnfgas-1, where yt is the nucleosynthetic yield, the fraction of metals that are returned to the interstellar medium by stars. The effective yield is defined as:
 |
(3) |
The ratio yeff / yt then is simply the metallicity relative to a closed box system with the same gas mass fraction. That is, although the metallicity can be low simply because there has been not much star-formation, if the effective yield is low there must have been some violation of the closed box model (Tinsley 1980, Pagel 1997).
Estimates of the effective yield by Tremonti et al. (2004) and more direct measurements by Garnett (2002) and Pilyugin, Vílchez & Contini (2004) indicate that yeff increases with circular velocity and stellar mass. Assuming that yt is not a strong function of galaxy mass (as could be the case if the IMF is variable; Köppen, Weidner & Kroupa 2007), this trend implies for low mass galaxies either an inflow of pristine gas or a metal-enriched outflow (Martin, Kobulnicky & Heckman 2002, Veilleux, Cecil & Bland-Hawthorn 2005). However, a detailed analysis by Dalcanton (2007) demonstrates that inflow of pristine gas can only reduce yeff by a limited amount (30%-50% for reasonably gas-rich galaxies) and cannot explain the observed trends. Metal-enriched outflows, on the other hand, are both physically motivated (Mac Low & Ferrara 1999) and can significantly reduce yeff. Although a small but metal-rich outflow may explain the trends, there is no necessity for the ejected fraction of gas to exceed that in high-mass galaxies. In fact, most evidence suggests that low mass systems have the same baryonic fraction as high mass systems and thus have experienced the same fractional outflow (Blanton, Geha & West 2008).
Interestingly, the mass-metallicity relation seems to be a strong function of r50, with the smallest galaxies at a given stellar mass having the highest metallicities (Ellison et al. 2008). These researchers conclude that the most likely explanation is that galaxies with high stellar mass surface densities are those that have most efficiently converted gas to stars. If pristine gas is not remixing from the outer radii of the galaxy, then such galaxies will have lower gas fractions locally and thus higher metallicities. In this context, it is tempting to note that the smallest spirals at a given stellar mass are the early type spirals, a possibly related fact.
This mass-metallicity relationship for spiral galaxies appears to be only a weak function of galaxy environment (Mouhcine, Baldry & Bamford 2007, Cooper et al. 2008). There are 0.02 dex trends with respect to environment, though these are small relative to the overall distribution of metallicities. According to Cooper et al. (2008), the noise in their environmental indicators may be washing out a stronger existing relationship, and these trends might explain about 15% of the scatter in the mass-metallicity relationship.
3.8. Disk edges and extended galactic disks
The optical surface brightness profiles of galaxy disks often exhibit a sharp edge, around 3-5 times the exponential scale length (van der Kruit 2001). Typically, at the edge the surface brightness dips below 25-26 mag arcsec-2 in B, motivating classical parameters such as R25 (the radius at which µB = 25 mag arcsec-2; de Vaucouleurs et al. 1991) and the Holmberg (1958) radius (where µB = 26.5 mag arcsec-2).
However, it has recently been recognized that for many disk galaxies this truncation is not complete (Pohlen et al. 2004). The census of Pohlen & Trujillo (2006) finds that while about 56% exhibit a downward break (either a classical sharp break or one described by a steeper exponential profile), about 24% exhibit a shallower exponential profile on the outside (e.g. Erwin, Beckman & Pohlen 2005), and 10% exhibit no measurable break. Apparently the latter category includes some galaxies that extend up to 10 scale radii (e.g., NGC 300; Bland-Hawthorn et al. 2005). Pohlen & Trujillo (2006) found that the remaining 10% of their sample were more complicated and consisted of a mix of breaks.
Meanwhile, the neutral gas in galaxies as seen at 21-cm tends to
extend considerably further than the disk break, typically by a factor
of two (see the recent compilation by the Westerbork
Hi survey;
Swaters et
al. 2002).
Therefore, the break in
optical light could relate to the similar breaks implied by
H
measurements of spatially resolved star-formation
(Section 3.5).
It has recently become clear that even beyond the edges of stellar
disks star-formation can still occur, which may explain why some
galaxies have no downward break or edge.
Thilker et
al. (2007)
has recently reported from GALEX imaging that over 20% of spiral
galaxies have significant UV emission in the outer disk. As one might
expect, the Hii regions
associated with the UV emission are low metallicity, typically 10%-20% solar
(Gil de Paz et
al. 2007).
Galaxies with such disks tend to be gas-rich
relative to other spirals at the same luminosity, and overdensities in
the gas distribution tend to correlate with the UV light. Similarly,
Christlein
& Zaritsky (2008)
detect H up to 1.5
× R25 on
average and up to 2 × R25 in some galaxies. Such
galaxies
consist of rotating disks with flat rotation curves. Both of these
sets of results indicate that some star-formation can occur at large
radii where most of the gas is stable against collapse, probably due
to local disturbances and overdensities.
The gas and (thin-disk) stars in spiral disks orbit coherently in
nearly circular orbits around the galactic center: they are
"rotation-supported" objects. At high luminosity at least, spiral
galaxies often have flat or peaked rotation curves, allowing one to
define a maximum circular velocity Vc or an asymptotic
circular velocity Va, which are often but not always
similar. The most
commonly used tracers of the outer disk dynamics are
H and
H i emission, with the
latter generally detectable at larger
galactic radii than the former. The full details of measuring the
internal rotation curves were recently reviewed by
Sofue & Rubin
(2001),
and the mass-modeling of these data are the subject of considerable
debate (e.g., most recently
Barnes, Sellwood
& Kosowsky 2004,
Dutton et
al. 2005,
Kassin, de Jong
& Weiner 2006,
Spano et al. 2008).
We concentrate here on the global dynamics.
According to the well-established
Tully & Fisher
(1977)
relation (TF), galaxy luminosity L is related to
Vc as a power-law Vc
L at
high luminosities, with some scatter.
Figure 10
illustrates the I-band TF relation for luminous galaxies from
Courteau et
al. (2007).
In virtually all analyses, an attempt is made to
correct for internal extinction within each galaxy, which in general
is a complex function of type, luminosity, and inclination
(Tully et al. 1998,
Maller et
al. 2009).
The slope of the TF relationship is
usually determined using a linear regression, either of log10
Vc on log10 L (the "inverse" TF
relation) or vice-versa (the "forward" TF relation).
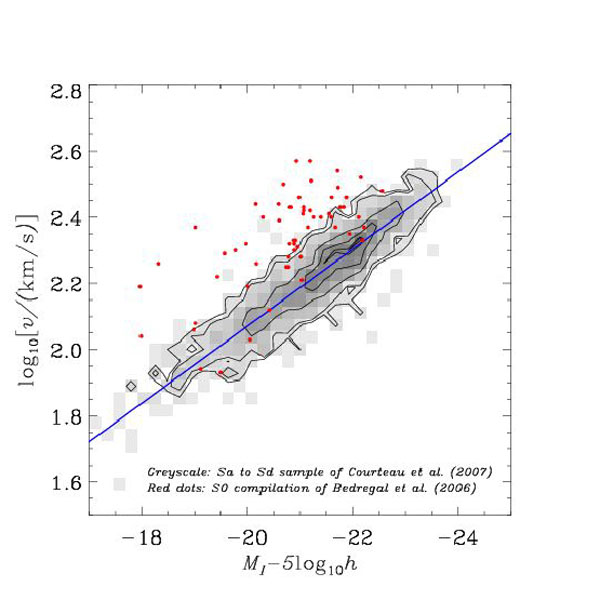 |
Figure 10. Tully-Fisher relation in the I-band (Vega-relative). The greyscale and contours show the data from Courteau et al. (2007), along with the fit to all morphological types given in their Table 2. The red points are the S0 data from the compilation of Bedregal, Aragón-Salamanca & Merrifield (2006), converted to I band using the approximate relation I = K + 1.99. |
Because of the scatter, the inverse and forward TF relations do not
have slopes that are simply inverses of each other -
will
be larger if the forward fit is performed, by an amount that depends
on the selection effects and error distribution of the sample.
Courteau et
al. (2007)
instead use a bisector method that
accounts for uncertainties in both variables. We do not advocate any
one method; in practice, the correct choice depends on the error
distributions, the sample selection effects, and the desired
goals. The most complete discussion of these issues remains
(Strauss &
Willick 1995),
but see
Masters et
al. (2006)
for a more modern view. We simply point out that the TF relations
derived from different groups differ due to such choices.
Recent compilations
(Verheijen
2001,
Kannappan,
Fabricant & Franx 2002,
Masters et
al. 2006,
Pizagno et
al. 2007,
Courteau et
al. 2007)
find ~ 0.27-0.35, with a
scatter equivalent to about 0.15-0.4 mag in the luminosity
direction. The low scatter holds for
Courteau et
al. (2007)
and other samples that were selected for simplicity and for best
distance-measure performance. The higher scatter value from
Pizagno et
al. (2007)
occurs because they use a wider range of
morphological types, in particular including "peculiar" systems and
barred galaxies. The TF slope is a function of bandpass, with
decreasing towards longer wavelengths, as one might expect as spirals
become redder with increasing mass (cf. Figure 8).
The residuals from the TF relation in red bands (such as SDSS i or
Bessell I) usually appear to be only weakly related to
any other properties, suggesting they are dominated by the dark matter
to stellar mass ratio variation. For bluer bands like g there are
residuals associated with color, expected since in those bands the
stellar mass to light ratio varies with color
(Bell & de Jong
2001,
Pizagno et
al. 2007).
In red bands, the strongest residuals appear to be the tendency for
earlier-type
(Masters et
al. 2006,
Courteau et
al. 2007)
or more concentrated or redder spirals
(Kannappan,
Fabricant & Franx 2002,
Pizagno et
al. 2007)
to have higher .
In particular, at Vc ~ 250 km s-1, Sa
galaxies are less luminous than later types by roughly 0.5 mag.
Although the standard TF relation is appropriate for massive galaxies, for less massive galaxies, for example where Vc < 100 km s-1, it has considerably more scatter and deviates from a power law - galaxies at a given circular velocity are less luminous than the high luminosity TF would predict (e.g., McGaugh 2005). As we saw above, at these scales the disk gas mass starts to become dominated by the gas contribution. By including the neutral and molecular gas mass to define a total baryonic mass, McGaugh (2005) and Begum et al. (2008) claim that the TF power law continues even to these scales. This change probably reflects a decrease in the time-averaged efficiency of turning baryonic matter into stars in lower mass galaxies.
These dynamical relationships appear to be at best a weak function of environment for luminous galaxies. For example, in a sample of 165 galaxies, Pizagno et al. (2007) found no evidence of environmental dependence. A hint of dependence is seen in the lower luminosity sample of Blanton, Geha & West (2008) at Vc < 70 km s-1.