


Active star formation in galaxies leads to acceleration of protons and electrons via the Fermi-I diffusive shock acceleration mechanism in SN remnants. Under equilibrium conditions in a galaxy, a minimum-energy configuration of the magnetic field and the energetic particles may be attained. Energy densities of particles and magnetic fields may then be in approximate equipartition, implying that the energetic proton energy density, Up, can be deduced from the detected level of synchrotron radio emission. In this radio-based approach Up can be estimated if the source size, distance, radio flux, and radio spectral index are known.
In a  -based approach, Up can be
obtained
from the measured GeV-TeV spectral flux, which is mostly due to p-p
interactions, as described the previous section. Only recently have such
measurements become possible, at present only for 10 sources.
-based approach, Up can be
obtained
from the measured GeV-TeV spectral flux, which is mostly due to p-p
interactions, as described the previous section. Only recently have such
measurements become possible, at present only for 10 sources.
In the SN method, with an assumed fraction of SN kinetic energy
that is channeled into particle acceleration, Up can
be estimated if the size of the star-forming region and SN rate are
known, as well as an estimate for the proton residence timescale from
the presence (or absence) of a galactic wind emanating from the
star-forming region. This timescale is largely determined by the
advection timescale (~ 105yr) in SBGs, and by the
 0-decay timescale
(~ 107yr) in low-SFR (quiescent) galaxies.
0-decay timescale
(~ 107yr) in low-SFR (quiescent) galaxies.
Expanding on our previous work
(Persic & Rephaeli
2010),
we show that the three
methods give consistent results for Up for a sample of
10 galaxies with widely varying levels of star formation activity, from
very quiescent to extreme SBs. These are the only galaxies of their kind
for which
-ray
data, in addition to radio data and SN rates, are
available (see Table 1).
| Object | DL[1] | rs[2] | f1 GHz[3] |  NT[4] NT[4] |
ne, th[5] | LTIR[6] | SFR[7] |  SN[8] SN[8] |
Mgas[9] | L[10] |
Notes |
| (Mpc) | (kpc) | (Jy) | (cm-3) | (erg/s) | (M /yr) /yr) |
(yr-1) | (M) |
(erg/s) | |||
| Arp 220 | 74.7 | 0.25 | 0.3 | 0.65 | 300 | 45.75 | 253 | 3.5 | 9.24-0.11+0.10 | < 42.25 | SB |
| M 82 | 3.4 | 0.23 | 10.0 | 0.71 | 200 | 44.26 | 8.2 | 0.25 | 9.37-0.14+0.09 | 40.21-0.13+0.10 | SB |
| NGC 253 | 2.5 | 0.20 | 5.6 | 0.75 | 400 | 44.23 | 7.7 | 0.12 | 9.20-0.11+0.10 | 39.76-0.19+0.14 | SB |
| Milky Way | – | 4.4 | – | – | 0.01 | 43.75 | 2.5 | 0.02 | 9.81-0.16+0.12 | 38.91-0.15+0.12 | quiescent |
| M 31 | 0.78 | 4.5 | 4.0 | 0.88 | 0.01 | 42.98 | 0.43 | 0.01 | 9.88-0.15+0.11 | 38.66-0.10+0.09 | quiescent |
| M 33 | 0.85 | 2.79 | 3.30 | 0.95 | 0.03 | 42.68 | 0.22 | 0.003 | 9.35-0.19+0.13 | < 38.54 | quiescent |
| LMC | 0.049 | 2.4 | 285.0 | 0.84 | 0.01 | 42.45 | 0.13 | 0.002 | 8.86-0.18+0.12 | 37.67-0.05+0.05 | quiescent |
| SMC | 0.061 | 1.53 | 45.3 | 0.85 | 0.01 | 41.45 | 0.01 | 0.001 | 8.66-0.06+0.03 | 37.04-0.14+0.11 | quiescent |
| NGC 4945 | 3.7 | 0.22 | 5.5 | 0.57 | 300 | 44.02 | 4.7 | 0.1-0.5 | 9.64-0.40+0.10 | 40.30-0.16+0.12 | SB+Sy2 |
| NGC 1068 | 16.7 | 1.18 | 6.6 | 0.75 | 300 | 45.05 | 50 | 0.2-0.4 | 9.71-0.19+0.11 | 41.32-0.23+0.15 | SB+Sy2 |
|
[1]Distance (from
Ackermann et al. 2012).
[2]Effective radius of star-forming region. See text. Data are from Persic & Rephaeli 2010 and refs. therein (Arp 220, M 82, NGC 253), Beck & Gräve 1982 (M 31), Tabatabaei et al. 2007 (M 33), Weinberg & Nikolaev 2001 (LMC), Wilke et al. 2003 (SMC), Moorwood & Oliva 1994 ( NGC 4945), Spinoglio et al. 2005 (NGC 1068). [3]1 GHz flux density. Data are from Persic & Rephaeli 2010 and refs. therein (Arp 220, M 82, NGC 253)), Beck & Gräve 1982 (M 31), Tabatabaei et al. 2007 (M 33), Klein et al. 1989 (LMC), Haynes et al. 1991 (SMC), Elmouttie et al. 1997 ( NGC 4945), Kühr et al. 1981 (NGC 1068). [4]Non-thermal spectral radio index. Data are from Persic & Rephaeli 2010 and refs. therein (Arp 220, M 82, NGC 253), Beck & Gräve 1982 (M 31), Tabatabaei et al. 2007 (M 33), Klein et al. 1989 (LMC), Haynes et al. 1991 (SMC), Elmouttie et al. 1997 ( NGC 4945), Kühr et al. 1981 (NGC 1068). [5]Thermal electron density. Data are from Roy et al. 2010 (Arp 220), Petuchowski et al. 1994 (M 82), Kewley et al. 2000 and Corral et al. 1994 (NGC 253), Cox 2005 (Milky Way), Beck 2000 (M 31), Tabatabaei et al. 2008 (M 33), Points et al. 2001 (LMC), Sasaki et al. 2002 (SMC), Spoon et al. 2000 (NGC 4945), Kewley et al. 2000 (NGC 1068). [6]Total IR [i.e., (8-1000)µm] luminosity, in log (from Ackermann et al. 2012). [7]Star formation rate, from SFR = LIR / (2.2 × 1043 erg/s ) (Kennicutt 1998). [8]Core-collapse SN rate. Data are from Persic & Rephaeli 2010 and references therein (Arp 220, M 82, NGC 253), Diehl et al. 2006 (Milky Way), van den Bergh & Tammann 1991 (M 31, M 33, SMC, LMC; see also Pavlidou & Fields 2001), Lenain et al. 2010 and references therein (NGC 4945, NGC 1068). For NGC 1068 we also computed an upper limit to the SN rate ( SN
 0.39) using
Mannucci et al.'s (2003)
formula SN = (2.4
± 0.1) × 10-2
[LFIR / (1010
L)]
yr-1, being fFIR = 1.26 ×
10-11(2.58 f60 + f100)
erg cm-2s-1 (see
Helou et al. 1988)
with f60 0.39) using
Mannucci et al.'s (2003)
formula SN = (2.4
± 0.1) × 10-2
[LFIR / (1010
L)]
yr-1, being fFIR = 1.26 ×
10-11(2.58 f60 + f100)
erg cm-2s-1 (see
Helou et al. 1988)
with f60
 190 Jy and
f100
277 Jy. 190 Jy and
f100
277 Jy.
[9]Gas mass (neutral plus molecular hydrogen: MHI + MH2), in log. Data are from: Torres 2004 for Arp 220; Abdo et al. 2010a for M 82, NGC 253, and the Milky Way; Abdo et al. 2010b for M 31 and M 33Abdo et al. 2010c for the LMC; Abdo et al. 2010d for the SMC; and Lenain et al. 2010 for NGC 4945 and NGC 1068. [10]High-energy (> 100 MeV) -ray
luminosity, in log (from
Ackermann et
al. 2012). |
|||||||||||
3.1. Particles and magnetic field
The population of NT electrons consists of primary (directly
accelerated) and secondary (produced via
± decays)
electrons. While the exact form of the steady-state electron energy
spectrum is not a single power law, at high energies the flattening of
the spectrum due to Coulomb losses can be ignored, justifying the use of
the approximate single power-law form. The combined (primary plus
secondary) electron spectral density distribution is then
 |
(1) |
where the electron Lorentz factor
is in
the range
1
2, Ne,0 is a normalization
factor of the primary electrons,
 is the secondary-to-primary
electron ratio, and q
is the secondary-to-primary
electron ratio, and q
 2 is the spectral index.
Ignoring the contribution of low-energy electrons with
<
1, the
electron energy density is Ue = Ne,0
(1 + ) me
c2
∫12
1-q
d,
where 2 is an upper
cutoff whose exact value is irrelevant in the limit of interest,
2 >>
1. For q > 2 and
2 >>
1,
2 is the spectral index.
Ignoring the contribution of low-energy electrons with
<
1, the
electron energy density is Ue = Ne,0
(1 + ) me
c2
∫12
1-q
d,
where 2 is an upper
cutoff whose exact value is irrelevant in the limit of interest,
2 >>
1. For q > 2 and
2 >>
1,
 |
(2) |
For a population of electrons (specified by Eq. 1) traversing a homogeneous magnetic field of strength B in a region with (a spherically equivalent) radius rs located at a distance d, standard synchrotron relations yield
 |
(3) |
where the scaled flux is f1 GHz Jy, a(q)
is defined and tabulated in, e.g.,
Tucker (1975),
and 
 (rs /
0.1 kpc)-3 (d
/ Mpc)2 (f1 GHz / Jy). Use of Eq.(2) then
yields
(rs /
0.1 kpc)-3 (d
/ Mpc)2 (f1 GHz / Jy). Use of Eq.(2) then
yields
 |
(4) |
In order to compute Ue from Eq.(4) we need to specify
1 and B. To do so we make the
following assumptions:
(i) The low-energy limit of the electron power-law spectrum,
1, marks
the transition (for decreasing energy) from Coulomb
(Rephaeli 1979)
to synchrotron losses. For an electron of energy
, the
synchrotron loss rate is
 |
(5) |
whereas the Coulomb loss rate is
 |
(6) |
(Rephaeli 1979).
We then simply assume that electrons lose energy via
Coulomb scattering for
<
1 and via synchrotron cooling for
>
1.
(ii) The particle energy density is in equipartition with that of
the magnetic field, Up + Ue =
B2 / 8 . In
terms of the p/e energy
density ratio,  , the
equipartition condition is Up [1+ (1 +
) /
] = B2
/ 8, so that
, the
equipartition condition is Up [1+ (1 +
) /
] = B2
/ 8, so that
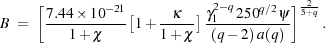 |
(7) |
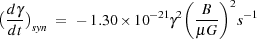
Inserting Eq.(7) into Eq.(5) we get
(d
/ dt)syn
 12(9-q) / (5 + q). Once the value of
ne,th is specified (see
Table 1), by equating Eqs.(5, 6) we deduce
1.
12(9-q) / (5 + q). Once the value of
ne,th is specified (see
Table 1), by equating Eqs.(5, 6) we deduce
1.
The secondary-to-primary electron ratio
, which appears in Eq.(7),
depends on the injection p/e number ratio, rp/e =
(mp /
me)(qinj-1)/2, and on the
gas optical thickness to p-p interactions.
Given the branching ratios in p-p collisions, only a third of these
collisions produce electrons. The mean free path of CR protons due to
p-p interactions in a medium of density np is
 pp =
(
pp =
( pp
np)-1; for protons with kinetic energy
T ~ few TeV the cross section is
pp
50 mb = 5 ×
10-26 cm2
(Baltrusaitis et
al. 1984).
For a typical SB ambient gas density np
150 cm-3,
pp ~ 43
kpc. The probability
for a single CR proton to undergo a pp interaction in its 3D random walk
through a region of radius rs ~ 0.25 kpc (also
typical of SB nuclei) is then
√3
rs /
pp
0.01. Thus, in a typical
SB environment, characterized by relatively strong non-relativistic shocks
(qinj = 2.2), the secondary to primary electron ratio
is =
0
√3
(rs /
pp)
0.3. In a more
quiescent environment, with typical values np
1 cm-3 and
rs ~ 2.5 kpc,
0.03. The higher
value found in SBs is in approximate
agreement with results of detailed numerical starburst models for energies
pp
np)-1; for protons with kinetic energy
T ~ few TeV the cross section is
pp
50 mb = 5 ×
10-26 cm2
(Baltrusaitis et
al. 1984).
For a typical SB ambient gas density np
150 cm-3,
pp ~ 43
kpc. The probability
for a single CR proton to undergo a pp interaction in its 3D random walk
through a region of radius rs ~ 0.25 kpc (also
typical of SB nuclei) is then
√3
rs /
pp
0.01. Thus, in a typical
SB environment, characterized by relatively strong non-relativistic shocks
(qinj = 2.2), the secondary to primary electron ratio
is =
0
√3
(rs /
pp)
0.3. In a more
quiescent environment, with typical values np
1 cm-3 and
rs ~ 2.5 kpc,
0.03. The higher
value found in SBs is in approximate
agreement with results of detailed numerical starburst models for energies
 10 MeV (plotted
in, e.g.,
Paglione et al. 1996,
Torres 2004,
De Cea et al. 2009,
Rephaeli et al. 2010).
10 MeV (plotted
in, e.g.,
Paglione et al. 1996,
Torres 2004,
De Cea et al. 2009,
Rephaeli et al. 2010).
To compute the p/e energy density,
,
we assume power-law spectra: (i)
The electron spectral index qe is deduced from the
measured radio index
, generally
qe = 2
+ 1. (ii) The
proton spectral index is assumed to be close to the injection value,
qp ~ qinj
2.1-2.2, for the dense
SB environments hosted in the central regions of
some galaxies, and equal to the leaky-box value, qp =
qinj
+  2.7 (where
0.5 is the diffusion
index) for more quietly star forming galaxies.
2.7 (where
0.5 is the diffusion
index) for more quietly star forming galaxies.
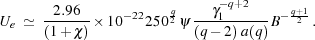
Finally, we obtain an explicit expression for Up:
 |
(8) |
Using Eq.(8), values of Up can be obtained from the
relevant observational quantities for our sample galaxies; these values are
listed in Table 2. The quantities in Eq.(8) are
usually well determined for our sample galaxies, except for the p/e
energy density ratio ,
for which a spectral index, qp, must be
assumed. Given its possible values (i.e., qp
2.1-2.2 in SB regions,
and qp
2.1-2.2
for quiescent galaxies), the uncertainty in the spectral index,
qp
0.1, translates to a
factor of ~ 2 uncertainty on
, i.e.
typically an uncertainty of ~ 50% on Up as deduced from
Eq.(8).
3.2. Energetic particles and
-ray
emission
Based on the calculation of
-ray
emission from SFGs outlined in
Section 1,
Up can be estimated directly from recent measurements
of the nearby galaxies. In SBGs, such as M 82 and NGC 253, the central
SB region (referred to also as the
source region) with a radius of ~ 200-300 pc is identified as the main
site of particle acceleration. The injected particle spectrum is assumed
to have an index q = 2, the theoretically predicted
Np / Ne ratio is adopted, and
equipartition is assumed. A measured radio index
0.7 in the source
region implies q = 2
+ 1
2.4 there, indicating a
substantial steepening due to diffusion (D
-), that cause the
steady-state particle spectral index to be
q0+
above some break energy. The procedure is similar when star formation
does not (largely) occur in a burst in the nuclear region, but proceeds
more more uniformly across the disk.
For a source with ambient gas number density ngas,
proton energy density
Up, and volume V, the integrated hadronic
emission from pp-induced
0 decay is
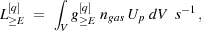 |
(9) |
with the integral emissivity
g
 [
[ ] in units of photon
s-1(H-atom)-1(eV/cm3)-1
(Drury et al. 1994).
Thus, Up can be determined from measurements of
L
and ngas(r), and the particles
steady-state energy distributions can
be numerically calculated in the context of the convection-diffusion model.
] in units of photon
s-1(H-atom)-1(eV/cm3)-1
(Drury et al. 1994).
Thus, Up can be determined from measurements of
L
and ngas(r), and the particles
steady-state energy distributions can
be numerically calculated in the context of the convection-diffusion model.
In addition to the high-energy detections of the two local SBGs M 82 and
NGC 253
(Abdo et al. 2010a,
Acciari et al. 2009;
Acero et al. 2009),
several galaxies with low SFR were also detected by the Fermi
telescope. (i) the Andromeda galaxy M 31
(Abdo et al. 2010b),
with Up
0.35 eV cm-3;
(ii) the Large Magellanic Cloud (LMC) whose average spectrum,
either including or excluding the bright star-forming region of
30 Doradus, suggests Up
0.2-0.3 eV
cm-3
(Abdo et al. 2010c);
(iii) SMC for which Up
0.15 eV cm-3
was deduced
(Abdo et al. 2010d).
For the Milky Way, the modeling of the Galactic diffuse HE
emission along the lines outlined above requires an average
Up
1 eV cm-3
(Strong et al. 2010;
Ackermann et al. 2011).
Our values for Up determined from the measured GeV-TeV
fluxes are listed in Table 2.
3.3. Energetic particles and Supernovae
The SN origin of energetic particles suggested early on; as a test of this
hypothesis, we estimate of Up by combining the SN rate
with the proton residence time,
 res, assuming a
fiducial value for the fraction
of SN kinetic energy that is channeled to particle acceleration. The
residence time is determined from the p-p interaction time, and the two
propagation timescales of advection and diffusion:
res, assuming a
fiducial value for the fraction
of SN kinetic energy that is channeled to particle acceleration. The
residence time is determined from the p-p interaction time, and the two
propagation timescales of advection and diffusion:
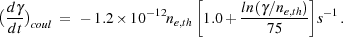
(i) The energy-loss timescale for pp interactions,
pp =
(pp c
np)-1; for protons with kinetic energy
E
10 TeV for which
pp
50 mb, this
timescale is
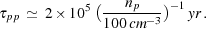 |
(10) |
(ii) Particle advection out of the disk mid-plane region in a
fast SB-driven wind occurs on a timescale
adv
determined from the advection velocity for which we adopt (except where
noted otherwise) the nominal value vadv ~
1000 km s-1, deduced from measurements of the
terminal outflow velocity of ~ 1600-2200 km s-1 in
M 82
(Strickland &
Heckman 2009;
see also
Chevalier & Clegg
1985
and
Seaquist & Odegard
1991).
For a homogeneous distribution of
SNe within the SB nucleus of radius rs, the
advection timescale is
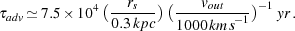 |
(11) |
(iii) As noted in the previous section, diffusion is likely to be
random walk against magnetic field inhomogeneities, with an estimated
central diffusion coefficient, D ~ 3 × 1028
cm2/s, assuming a magnetic coherence
scale of ~ 1
pc. Thus, diffusion out of the central 0.5 kpc is estimated to occur on
a timescale
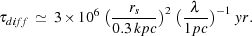 |
(12) |
Now, since the weighted residence time is
 |
(13) |
it is expected that - under typical conditions in central SB regions - p-p collisions and advection, more so than diffusion, effectively determine the survival there of energetic protons.
During res,
the number of SN is SN
res;
the kinetic energy deposited by each of these into the ISM is
Eej = 1051 erg
(Woosley & Weaver
1995).
Arguments based on the energetic
particle energy budget in the Galaxy and SN statistics suggest that a
fraction ~ 0.05-0.1 of
this energy is available for accelerating particles (e.g.,
Higdon et al. 1998).
Thus, the proton energy density can be expressed as
 |
(14) |
The resulting values of Up in the sample galaxies are listed in Table 2.
| Object | -ray |
radio | SN | other | rs | res |
| meth. | meth. | meth. | meth. | (kpc) | (yr) | |
| Arp 220 | – | 1027 | 1142 | – | 0.25 | 2.0E+4 |
| M 82 | 250a,c | 250 | 234 | – | 0.23 | 4.5E+4 |
| NGC 253 | 220b,c | 230 | 213 | – | 0.20 | 6.7E+4 |
| Milky Way | 1d | – | 1.2 | 1j | 4.4 | 2.0E+7 |
| 6e | – | 5 | – | 0.2 | 2.5E+6 | |
| M 31 | 0.36f | 0.22 | 0.7 | – | 4.5 | 2.5E+7 |
| M 33 | <0.43f | 0.38 | 0.7 | – | 2.8 | 2.0E+7 |
| LMC | 0.21-0.31g | 0.22 | 0.4 | – | 2.5 | 4.4E+7 |
| SMC | 0.15h | 0.39 | 1.1 | – | 1.5 | 1.4E+7 |
| NGC 4945 | 200i | 201 | 215 | – | 0.22 | 4.5E+4 |
| NGC 1068 | – | 65 | 61 | – | 1.2 | 1.0E+6 |
| + Values are in eV cm-3.
(a) Acciari et al. (2009; see also Persic et al. 2008, De Cea et al. 2009). (b) Acero et al. (2009). (c) Abdo et al. (2010a). (d) Strong et al. (2010). (e) Aharonian et al. (2006). (f) Abdo et al. (2010b), and Drury et al. (1994) for M 33. (g) Abdo et al. (2010c). (h) Abdo et al. (2010d). (i) Lenain et al. (2010). (j) Webber (1987). |
||||||