


The last decade has seen dramatic progress in measurements of the cosmic expansion history and structure growth, leading to much tighter constraints on the parameters of dark energy models. CMB data from the WMAP and Planck satellites and from higher resolution ground-based experiments have provided an exquisitely detailed picture of structure at the recombination epoch and the first CMB-based measures of low redshift structure through lensing and SZ cluster counts. Cosmological supernova samples have increased in size from tens to many hundreds, with continuous coverage from z = 0 to z ≈ 1.4, alongside major improvements in data quality, analysis methods, and detailed understanding of local populations. BAO measurements have advanced from the first detections to 2% precision at multiple redshifts, with increasingly sophisticated methods for testing systematics, fitting models, and evaluating statistical errors. Constraints on low redshift structure from galaxy clusters have become more robust, with improved X-ray and SZ data and weak lensing mass calibrations, and they have been joined by the first precise structure constraints from cosmic shear weak lensing, galaxy-galaxy lensing, and redshift-space distortions. The precision of direct H0 measurements has sharpened from the ~ 10% error of the HST Key Project [28] to 3-4% in some recent analyses.
As an illustration of current measurements of the cosmic expansion history, Figure 1 compares distance-redshift measurements from SN and BAO data to the predictions for a flat universe with a cosmological constant. SN cosmology relies on compilation analyses that try to bring data from different surveys probing distinct redshift ranges to a common scale. The most influential current compilations are SNLS3 [29], which combines data from the 3-year Supernova Legacy Survey sample and the 1st-year SDSS-II Supernova Survey sample with local calibrators and high-redshift SNe from HST surveys, and Union2.1 [30], which has a broader selection of data, including some but not all of the sources in SNLS3. Here we have used binned distance measurements from Union2.1, but we caution that the different sample selections and analysis methodologies lead to systematic differences comparable to the statistical uncertainties, and it is not obvious which compilation, if either, should be preferred. Because the peak luminosity of a fiducial SN Ia is an unknown free parameter, the SN distance measurements could all be shifted up and down by a constant multiplicative factor; cosmological information resides in the relative distances as a function of redshift. The four BAO data points are taken from analyses of the 6dFGS survey [31], SDSS-II [32], BOSS [33], and WiggleZ [34]. For the BAO measurements we have adopted the sound horizon scale rs = 147.49 Mpc from Planck CMB data, whose 0.4% uncertainty is small compared to the current BAO measurement errors [36]. We have converted both SN luminosity distances and BAO Dv distances to an equivalent comoving angular diameter distance.
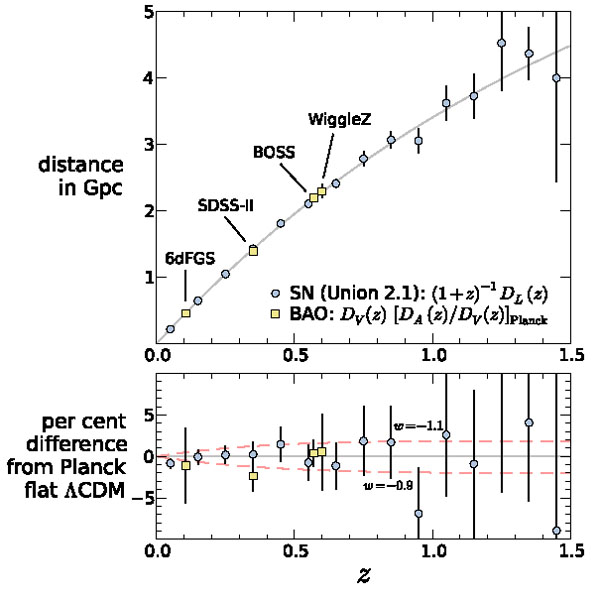 |
Figure 1. The distance-redshift relation measured from Type Ia SNe and BAO compared to the predictions (gray curve) of a flat ΛCDM model with the best-fit parameters inferred from Planck+WP CMB data. Circles show binned luminosity distances from the Union2.1 SN sample, multiplied by (1 + z)-1 to convert to comoving angular diameter distance. Squares show BAO distance measurements, converted to DA,c(z) for the Planck+WP cosmology and sound horizon, from the references given in the text. The lower panel plots residuals from the Planck+WP ΛCDM prediction, with dashed curves that show the effect of changing w by ± 0.1 while all other parameters are held fixed. Note that the SN data points can be shifted up or down by a constant factor to account for freedom in the peak luminosity, while the BAO points are calibrated to 0.4% precision by the sound horizon scale computed from Planck+WP data. |
The plotted cosmological model has Ωm = 0.315 and h = 0.673, the best-fit values [37] from Planck+WP CMB data assuming w = -1 and Ωtot = 1. Specifically, here and below we use parameter values and MCMC chains from the "Planck + WP" analysis of [38], which combines the Planck temperature power spectrum with low multipole polarization measurements from WMAP [39]. In contrast to the Cosmological Parameters article of this Review, we do not use the CMB data set that includes higher resolution ground-based results because the corresponding chains are not available for all of the cases we wish to examine, but differences in cases where they are available are small. The SN, BAO, and CMB data sets, probing a wide range of redshifts with radically different techniques, are mutually consistent with the predictions of a flat ΛCDM cosmology. We have not included the z=2.5 BAO measurement from the BOSS Lyman-α forest [24] on this plot, but it is also consistent with this fiducial model. Other curves in the lower panel of Figure 1 show the effect of changing w by ± 0.1 with all other parameters held fixed. However, such a single-parameter comparison does not capture the impact of parameter degeneracies or the ability of complementary data sets to break them, and if one instead forces a match to CMB data by changing h and Ωm when changing w then the predicted BAO distances diverge at z = 0 rather than converging there.
Figure 2a plots joint constraints on Ωm and ΩΛ in a ΛCDM cosmological model, assuming w = -1 but not requiring spatial flatness. The SN constraints are computed from the Union2 sample, and the CMB, CMB+BAO, and CMB+BAO+SN constraints are taken from MCMC chains provided by the Planck Collaboration [38]. We do not examine BAO constraints separately from CMB, because the constraining power of BAO relies heavily on the CMB calibration of rs. The SN data or CMB data on their own are sufficient to reject an ΩΛ = 0 universe, but individually they allow a wide range of Ωm and significant non-zero curvature. The CMB+BAO combination zeroes in on a tightly constrained region with Ωm = 0.309 ± 0.011 and Ωtot = 1.000 ± 0.0033. Combining SN with CMB would lead to a consistent constraint with around 3-4× larger errors. Adding the SN data to the CMB+BAO combination makes only a small difference to the constraints in this restricted model space.
 |
Figure 2. Constraints on the present matter fraction Ωm and dark energy model parameters. Dark and light shaded regions indicate 68.3% and 95.4% confidence levels, respectively. "CMB" is Planck+WP, "BAO" is the combination of SDSS-II, BOSS, and 6dFGS, and "SN" is Union2. (a) The present dark energy fraction ΩΛ vs. Ωm, assuming a ΛCDM model. CMB data, especially when combined with BAO constraints, strongly favor a flat universe (diagonal dashed line). (b) The dark energy equation of state w vs. Ωm, assuming a constant value of w. The dashed contours show the 68.3% and 95.4% CL regions for the combination of WMAP9 and BAO data. Curves on the left vertical axis show the probability distributions for w (normalized arbitrarily), after marginalizing over Ωm, for the CMB+BAO and CMB+BAO+SN combinations (yellow and black, respectively), using Planck+WP CMB data, and for the WMAP9+BAO combination (dashed black). (c) Constraints on the two parameters of the dark energy model with a time-dependent equation of state given by Equation 4: w(z = 0.5) and wa = -dw / da. |
Figure 2b plots constraints in the Ωm - w space, where we now consider models with constant w(z) and (in contrast to panel a) assume spatial flatness. CMB data alone allow a wide range of w, but combination with BAO narrows the allowed range sharply. The preferred region is consistent with the orthogonal SN constraint, and the combination of the three data sets yields smaller uncertainties. The black curve on the left axis shows the posterior p.d.f. for w after marginalizing (with a flat prior) over Ωm; we find w = -1.10 ± 0.08 at 68.3% CL and -1.10 ± 0.15 at 95.4% CL. The dashed contours and dashed marginal curve show the impact of substituting WMAP9 data for Planck+WP in the CMB+BAO combination. The two constraints are compatible, but the shift from WMAP to Planck+WP has reduced the uncertainty in w and pulled the best-fit value lower.
Figure 2c considers a model space with time varying w, evolving according to the linear parameterization w(a) = w0 + wa(1 - a), again assuming flat space. Instead of w0 we show constraints on w(z = 0.5), approximately the pivot redshift where w is best determined and covariance with wa is minimized. This plot shows that even the combination of current CMB, BAO, and SN data places only weak constraints on time evolution of the equation of state, still allowing order unity changes in w between z = 1 and z = 0 (Δa = 0.5). The value of w(z = 0.5), on the other hand, is reasonably well constrained, with errors only slightly larger than those for the constant-w model of panel b. Errors on w0 = w(z = 0.5) - 0.333wa are much larger and are strongly correlated with the wa errors.
While the CMB, BAO, and SN data sets considered here are mutually consistent with a flat ΛCDM model, tensions arise when other cosmological measurements enter the mix. Blue and yellow contours in Figure 3a show CMB and CMB+BAO constraints in the Ωm - H0 plane, assuming w = -1 and Ωtot = 1. Red horizontal bars represent the direct estimate H0 = 73.8 ± 2.4 km s-1 Mpc-1 from Ref. [40], who use SN Ia distances to galaxies in the Hubble flow with the Ia luminosity scale calibrated by HST observations of Cepheids in nearby SN host galaxies. Another recent estimate by Ref. [41], which employs 3.6 μm Cepheid observations to recalibrate the HST Key Project distance ladder and reduce its uncertainties, yields a similar central value and estimated error, H0 = 74.3 ± 2.1 km s-1 Mpc-1. Figure 3a indicates a roughly 2σ tension between these direct measurements and the CMB+BAO predictions. The tension was already present with WMAP CMB data, as shown in Figure 3b, but it has become stiffer with Planck+WP, because of smaller CMB+BAO errors and a shift of central values to slightly higher Ωm and lower H0. In models with free, constant w (still assuming Ωtot = 1), the tension can be lifted by going to w < -1 and lower Ωm, as illustrated in Figure 3c. CMB data determine Ωm h2 with high precision from the heights of the acoustic peaks, essentially independent of w. Within the flat ΛCDM framework, the well determined distance to the last scattering surface pins down a specific combination of (Ωm, h), but with free w one can obtain the same distance from other combinations along the Ωm h2 degeneracy axis.
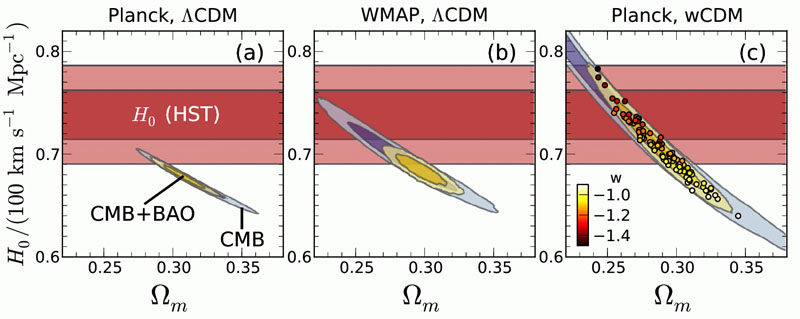 |
Figure 3. Constraints on the present matter fraction Ωm and the Hubble constant H0 from various combinations of data, assuming flat ΛCDM (left and middle panels) or a constant dark energy equation of state w (right panel). Dark and light shaded regions indicate 68.3% and 95.4% confidence levels, respectively. The right panel also shows 100 Monte Carlo samples from the CMB+BAO constraints with the value of w indicated by the colors of the dots. "CMB" is Planck+WP in the outer panels and WMAP9 in the middle panel, "BAO" is the combination of SDSS-II, BOSS, and 6dFGS, and "H0 (HST)" is the HST constraint from [40]. |
One should not immediately conclude from Figure 3 that w ≠ -1, but this comparison highlights the importance of fully understanding (and reducing) systematic uncertainties in direct H0 measurements. If errors were reduced and the central value remained close to that plotted in Figure 3, then the implications would be striking. Other recent H0 determinations exhibit less tension with CMB+BAO, because of lower central values and/or larger errors [42, 43], including the values of H0 = 69 ± 7 km s-1 Mpc-1 and 68 ± 9 km s-1 Mpc-1 from Refs. [44, 45], who circumvent the traditional distance ladder by using maser distances to galaxies in the Hubble flow. Gravitational lens time delays offer another alternative to the traditional distance ladder, and their precision could become competitive over the next few years, with increasing sample sizes and better constrained lens models.
The amplitude of CMB anisotropies is proportional to the amplitude of density fluctuations present at recombination, and by assuming GR and a specified dark energy model one can extrapolate the growth of structure forward to the present day to predict σ8. As discussed in Section 3 probes of low redshift structure typically constrain the combination σ8Ωmα with α ≈ 0.3-0.5. Figure 4 displays constraints in the σ8-Ωm plane from CMB+BAO data and from weak lensing and cluster surveys [46]. Planck data themselves reveal a CMB lensing signature that constrains low redshift matter clustering and suggests a fluctuation amplitude somewhat lower than the extrapolated value for flat ΛCDM. However, including the CMB lensing signal only slightly alters the Planck+WP confidence interval for ΛCDM (purple vs. yellow contours in Fig. 4a). Allowing free w (gray contours) expands this interval, primarily in the direction of lower Ωm and higher σ8 (with w < -1).
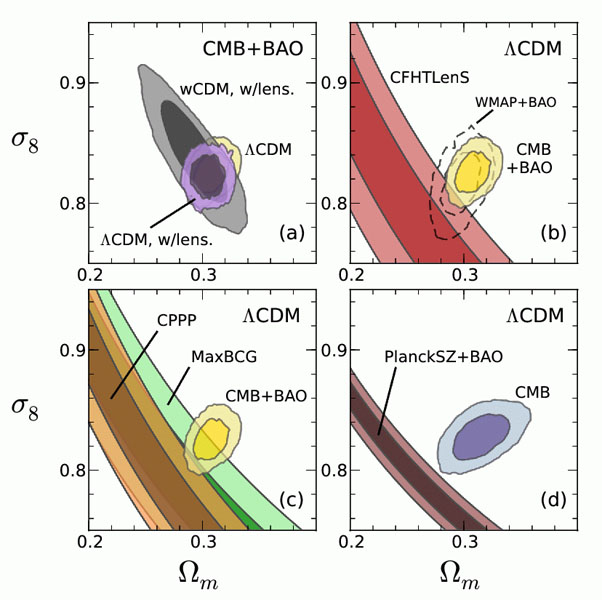 |
Figure 4. Constraints on the present matter fraction Ωm and the present matter fluctuation amplitude σ8. Dark and light shaded regions indicate 68.3% and 95.4% confidence levels, respectively. The upper left panel compares CMB+BAO constraints (using the same data sets as in Fig. 2) for ΛCDM with and without CMB lensing, and for a constant w model (including CMB lensing). The other three panels compare flat ΛCDM constraints between various dark energy probes, including weak lensing (upper right panel) and clusters (lower panels). |
The red contours in Figure 4b plot the constraint σ8(Ωm / 0.27)0.46 = 0.774-0.041+0.032 inferred from tomographic cosmic shear measurements in the CFHTLens survey [47]. An independent analysis of galaxy-galaxy lensing and galaxy clustering in the SDSS yields a similar result [48], σ8(Ωm / 0.27)0.57 = 0.77 ± 0.05. Note that σ8 and Ωm refer to z = 0 values; the weak lensing samples and the cluster samples discussed below are not at zero redshift, but the values of σ8 are effectively extrapolated to z=0 for a fiducial cosmology. (Within current parameter bounds, the uncertainty in extrapolating growth from z = 0.5 to z = 0 is 1-2%, small compared to the observational uncertainties.) There is approximately 2σ tension between the σ8 - Ωm combination predicted by Planck+WP CMB+BAO for ΛCDM and the lower value implied by the weak lensing measurements. This tension was weaker for WMAP+BAO data (dotted contour) because of the larger error and slightly lower best-fit parameter values.
Additional contours in Figures 4c and d show σ8 - Ωm constraints inferred from three representative cluster analyses [49]: σ8(Ωm / 0.27)0.47 = 0.784 ± 0.027 (CPPP), σ8(Ωm / 0.27)0.41 = 0.806 ± 0.032 (MaxBCG), and σ8(Ωm / 0.27)0.32 = 0.782± 0.010 (PlanckSZ). The basic mass calibration comes from X-ray data in CPPP, from weak lensing data in MaxBCG, and from SZ data in PlanckSZ. Because the PlanckSZ constraint itself incorporates BAO data, we have replaced the CMB+BAO contour with a CMB-only contour in panel d. The σ8Ωmα constraints from recent cluster analyses are not in perfect agreement, and the examples shown here are far from exhaustive. Nonetheless, on balance the cluster analyses, like the weak lensing analyses, favor lower σ8Ωmα than the value extrapolated forward from Planck+WP assuming flat ΛCDM. Redshift-space distortion analyses also tend to favor lower σ8Ωmα, though statistical errors are still fairly large. For example, [50] find f(z)σ8(z) = 0.415 ± 0.034 from SDSS-III BOSS galaxies at z = 0.57, while the best-fit Planck+WP+BAO flat ΛCDM model predicts f(z)σ8(z) = 0.478 ± 0.008 at this redshift. With somewhat more aggressive modeling assumptions, [51] infer f(z) σ8(z) from the WiggleZ survey at z = 0.22, 0.41, 0.60, and 0.78, with ≈ 10% errors in the three highest redshift bins (and 17% at z = 0.22), finding excellent agreement with a flat ΛCDM model that has Ωm = 0.27 and σ8 = 0.8, and thus with the structure measurements plotted in Figure 4.
Going from ΛCDM to wCDM does not readily resolve this tension, because the CMB degeneracy direction with free w is roughly parallel to the σ8 Ωmα tracks from low redshift structure (though the tracks themselves could shift or widen for w ≠ -1). Each of the low redshift probes has significant systematic uncertainties that may not be fully represented in the quoted observational errors, and the tensions are only about 2σ in the first place, so they may be resolved by larger samples, better data, and better modeling. However, it is notable that all of the discrepancies are in the same direction. On the CMB side, the tensions would be reduced if the value of Ωm or the optical depth τ (and thus the predicted σ8) has been systematically overestimated. The most exciting but speculative possibility is that these tensions reflect a deviation from GR-predicted structure growth, pointing towards a gravitational explanation of cosmic acceleration. Other possible physical resolutions could come from dark energy models with significant time evolution, from a massive neutrino component that suppresses low redshift structure growth, or from decaying dark matter that reduces Ωm at low z.
Table 1 summarizes key results from Figures 2 - 4, with marginalized constraints on Ωm, Ωtot, w, h, and σ8(Ωm / 0.27)0.4 for the Planck+WP+BAO, Planck+WP+BAO+SN, and WMAP9+BAO combinations. We list 68.3% errors, and also 95.4% errors for WMAP9+BAO constraints on wCDM; in all other cases, the 95.4% errors are very close to double the 68.3% errors. For ΛCDM the Planck+WP combinations give Ωtot = 1.000 with an error of 0.3% and they predict, approximately, h = 0.68 ± 0.01 and σ8(Ωm / 0.27)0.4 = 0.87 ± 0.02. Note that the Ωm and h constraints are not identical to those in Table 21.1 of the Cosmological Parameters article of this Review because those values assume spatial flatness. For wCDM, where flatness is assumed, the Planck+WP+BAO+SN combination yields w = -1.10-0.07+0.08, consistent with a cosmological constant at 1.2σ. With free w the best-fit h increases and its error roughly doubles, but the error in σ8(Ωm / 0.27)0.4 grows only slightly, and its best-fit value moves a bit further away from the lower amplitudes suggested by measurements of low redshift structure.
| Data combination | |||
| Parameter | Planck+WP+BAO | Planck+WP+BAO+SN | WMAP9+BAO |
| ΛCDM | |||
| Ωm | 0.309-0.011+0.010 | 0.307-0.010+0.011 | 0.295-0.012+0.012 |
| Ωtot | 1.000-0.0033+0.0033 | 1.000-0.0033+0.0032 | 1.003-0.004+0.004 |
| h | 0.678-0.010+0.011 | 0.679-0.011+0.010 | 0.681-0.011+0.011 |
| σ8 (Ωm/0.27)0.4 | 0.871-0.021+0.020 | 0.869-0.021+0.020 | 0.836-0.033+0.033 |
| wCDM (flat) | |||
| Ωm | 0.287-0.021+0.021 | 0.294-0.014+0.014 | 0.299-0.019+0.022(-0.042+0.045) |
| w | -1.13-0.11+0.13 | -1.10-0.07+0.08 | -0.98-0.12+0.16(-0.29+0.33) |
| h | 0.708-0.030+0.026 | 0.699-0.018+0.017 | 0.681-0.032+0.025(-0.066+0.060) |
| σ8 (Ωm/0.27)0.4 | 0.888-0.025+0.025 | 0.885-0.023+0.023 | 0.84-0.05+0.05(-0.09+0.09) |