


A number of galaxy and Ly-α surveys are planned for the future, in order to build up a picture of the distance-redshift relation over a wide range of redshifts.
The Sloan telescope will start to perform a spectroscopic galaxy survey in 2014, called the extended Baryon Oscillation Spectroscopic Survey (eBOSS: http://www.sdss3.org/future/). This is the cosmological survey within SDSS-IV, a six-year program using existing hardware and an updated redshift measurement software pipeline. eBOSS will provide distance measurements with BAO in the redshift range 0.6 < z < 2.5, approximately equivalent to a 1% distance measurement at z = 0.8, two 2% measurements at higher redshifts z ~ 0.9 and z ~ 1.5 and a 1.5% measurement at z = 2.5 from clustering within the Ly-α forest observed in the spectra from distant quasars. These measurements will be complemented with RSD measurements.
The Dark Energy Survey (DES: www.darkenergysurvey.com) is using a new 520-megapixel camera on the NOAO CTIO 4-meter Blanco telescope to perform a 5000 deg2 multi-colour (grizY) imaging survey of the southern hemisphere. When combined with VISTA data, this will provide photometric redshifts for 180,000,000 galaxies out to z = 1.5. The project is designed so that this catalogue can be used to measure the equation of state of dark energy through the combination of measurements from cluster number densities, weak lensing, supernovae and galaxy clustering. Survey operations have recently started (Autumn 2013), with a 5-year baseline duration. Because only photometric redshifts are available, only angular BAO will be measurable, and when the data is combined we expect DES to provide a ~ 2% measurement of the BAO distance scale at z = 1.
Over 3 years, the Hobby-Eberly Telescope Dark Energy Experiment (HETDEX) will take spectra and measure redshifts for 800,000 Ly-α emitting galaxies at 1.9 < z < 3.5 over 420 deg2. Predictions for this survey are provided in Greig et al. (2013), which suggest that a 1.2% distance measurement at z = 2.7 is possible.
Two collaborations, Physics of the Accelerating Universe (PAU) and Javalambre Physics of the Accelerating Universe Astrophysical Survey (J-PAS), are building new imaging cameras with the aim of performing narrow-band imaging surveys, where excellent photometric redshift can be obtained for of order 2-10,000,000 galaxies. PAU will be based on the William Herschel Telescope (WHT), whereas J-PAS will use a new dedicated 2.5m telescope in the South of Spain. Both surveys envisage starting in 2014, and running for ~ 5 years. Even using narrow-band filters, the degradation due to having photometric redshifts means that these surveys will be superseded by the next generation of spectroscopic redshift surveys.
The next step for ground-based surveys is to place and utilise a new multi-object spectrograph, capable of obtaining many thousands of spectra simultaneously, on a 4m-class telescope. One project, called Dark-Energy Spectroscopic Instrument (DESI), will fit the Mayall telescope with a new ~ 5000-fibre spectrograph covering a 2-3 deg diameter field. DESI is the most ambitious extra-galactic ground-based survey proposed to date, given the fibre number, field of view and fibre reconfiguration time (Schlegel et al. 2011). Survey operations would be expected to commence in 2018. Other multi-object spectrographs being designed for 4m telescopes include WEAVE (Dalton et al. 2012) and 4MOST (de Jong et al. 2012).
The Subaru telescope Prime Focus Spectrograph (PFS) is a new spectrograph due to have first light in 2017. It will have 2400 fibres, covering a 1.3 deg diameter field of view (Takada et al. 2012). The current cosmology survey design envisages a survey over 1500 deg2, yielding 3,000,000 galaxies over 0.6 < z < 2.4.
Looking beyond these ground-based surveys, the ESA Euclid mission, with a nominal launch date of 2019, will revolutionise observational cosmology by conducting imaging and spectroscopic surveys that are approximately two orders of magnitude better than those currently available (Laureijs et al. 2011).
It is common to make predictions for future surveys, in order to compare them to each other and optimise them individually, using Fisher methods. From Section 6, we have the Likelihood L(H). Then the Fisher matrix is defined as
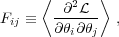 |
(51) |
where  ≡ -lnL. For a multi-variate Gaussian distribution,
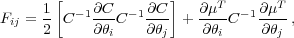 |
(52) |
where C is the covariance matrix, and µ the model for the parameters being tested (e.g. power spectrum band-powers). The Cramer-Rao inequality shows that the diagonal elements of the Fisher matrix give the best model error we can hope to achieve
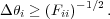 |
(53) |
For a sample with constant number density within a volume V, the error on the average power spectrum within a k-volume Vk (e.g. Feldman et al. 1994) is
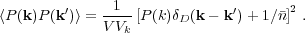 |
(54) |
For a sample with varying density over the region surveyed, we can define an effective volume
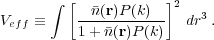 |
(55) |
If the survey is limited by the total number of redshifts that can be
obtained, then this has a maximum where
 P = 1. For future
surveys we will be limited by the sky area we can observe, the
field-of-view of the telescope, or the redshift range we can test with
a given spectrograph, so we often have
P ≠
1. Based on the effective volume,
P = 1. For future
surveys we will be limited by the sky area we can observe, the
field-of-view of the telescope, or the redshift range we can test with
a given spectrograph, so we often have
P ≠
1. Based on the effective volume,
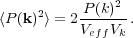 |
(56) |
This gives a Fisher matrix that can be written, if we now integrate over many small shells Vk (Tegmark 1997),
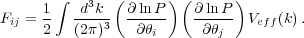 |
(57) |
This is the starting point for designing and optimising future
surveys. Code that uses these ideas and isolates the BAO signal is
provided by
Seo and Eisenstein
(2007),
while code for RSD measurements is given by
White et
al. (2009).
Using these codes, we can predict
measurement errors on the measured distance scale, or on
f 8.
Starting either from these measurements or
Eq. 57, we can create Fisher matrices spanning the
parameters of complete cosmological models.
8.
Starting either from these measurements or
Eq. 57, we can create Fisher matrices spanning the
parameters of complete cosmological models.
In order to provide a simple statistic with which to compare experiments, The Dark Energy Task Force (DETF; Albrecht et al. 2006) parametrized the equation of state w(z) of dark energy using two parameters w0 and wa:
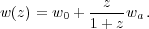 |
(58) |
They then defined their Figure-of-Merit (FoM) to be proportional to the inverse area of the error ellipse in the w0 - wa plane
 |
(59) |
where C(wo, wa) is the covariance matrix after marginalising over all of the other cosmological parameters. A larger FoMDETF is desired as it corresponds to a smaller error ellipse. Note that FoMDETF only cares about two parameters: an experiment that measures w(z) very accurately but only over a narrow redshift range will score well. As the true dark energy equation-of-state is unknown, so FoMDETF is not necessarily the best statistic with which to compare the discovery potential of multiple projects. Other options that attempt to alleviate these problems are available (e.g. Albrecht et al. 2009).
7.4. Predictions for future surveys
Predicted BAO measurements for the surveys introduced in
Sections 7.1 & 7.2, are
presented in Fig. 8. The final BOSS galaxy
survey is predicted
to provide multiple sub-percent BAO measurements out to redshifts of
z ~ 0.6. Surveys that are starting now will provide 1-2%
measurements over a wider redshift range, including percent level
measurements from the Ly-α forest. The next generation of
surveys including DESI and Euclid will provide multiple sub-percent
level measurements within redshift bins of width
 z = 0.1 over
the full redshift range 0.6 < z < 2.0.
z = 0.1 over
the full redshift range 0.6 < z < 2.0.
 |
Figure 8. Predictions for BAO measurements from the surveys introduced in Sections 7.1 & 7.2, calculated using the code of Seo and Eisenstein (2007). |
In order to realise the power of future surveys, we will need systematic errors that are significantly below the level of the statistical errors shown in Fig. 8. To ensure this, all aspects of the analysis will need to be evaluated for potential errors, including the likelihood calculation, and model to be fitted to the data. Provided this is achieved then the future surveys will provide a stunning new insight into the evolution of the Universe and the forces driving it.
Acknowledgements
I would like to thank to organisers of the schools for inviting me to give this series of lecture and to write these notes. I acknowledge support from the UK Science & Technology Facilities Council (STFC) through the consolidated grant ST/K0090X/1, and from the European Research Council through the "Starting Independent Research" grant 202686, MDEPUGS. Although I retain the sole right to any mistakes, I would like to thank Angela Burden and Cullan Howlett for proof-reading this draft.