


The advent of resolved 2D kinematic information coupled with (in some cases) the use of AO to improve spatial resolution has led to significant new insight. In this Section, I will review the major and most influential surveys, discuss in particular their selection strategies, instrumentation used, and review the important survey-specific kinematic (and associated) results in their major papers. Figure 3 shows the redshift range and physical parameter space (i.e. stellar mass and star-formation rates) covered by the main IFS surveys discussed below.
 |
Figure 3. The distribution of the principal IFS surveys in the redshift (left) and star-formation rate — stellar mass (right) space (stellar masses are corrected to the Salpeter 1955 IMF). The lines on the right plot are the locations of the main galaxy 'star-formation main sequence' at different redshifts taken from the models of Bouché et al. (2010). Credit: adapted from Figures 10 & 14 of Contini et al. (2012), reproduced with permission © ESO. |
The SINS ('Spectroscopic Imaging survey in the Near-infrared with SINFONI') survey was one of the first large IFS surveys of galaxies in the z ≳ 2 Universe and has been one of the most important for extending our views of early galaxy evolution. SINFONI (Eisenhauer et al. 2003) is a flexible IFS on the 8-m VLT capable of both natural seeing and AO modes of operation. The first results from integral field observations in Hα emission, of a sample of 14 BM/BX galaxies (selected similarly to Erb et al. 2006b) confirmed the present of a significant fraction of galaxies with rotation fields characteristic of discs (Förster Schreiber et al. 2006) and large enough to be resolved in 0.5-arcsec seeing. This was one of the first pieces of kinematical evidence for the 'clumpy disc' picture (see Section 5.1) which I will return to throughout this review.
In the same year, SINS 8 published one of the very first AO observations of a high-redshift star-forming galaxy, the z = 2.38 object 'BzK-15504' by Genzel et al. (2006). The galaxy was a K-band selected star-forming galaxy. Redder wavelengths are a good proxy for stellar mass, so being K = 21.1 meant that this object was selected as a massive star-forming galaxy (stellar mass ≃ 8× 10¹⁰ M⊙). This is an important point because, as we will see throughout this review, the kinematic nature of galaxies trends with stellar mass and in particular we see differences between K-band-selected and UV-selected star-forming galaxies. The galaxy was colour-selected to lie at these redshifts using the BzK colour-selection (Daddi et al. 2004) which is one of a family of colour-selection techniques used to select galaxies at high-redshift (Shapley 2011). It was observed using K-band AO in the Hα emission line.
This galaxy was the first prototypical case of a galaxy at z ~ 2 with clear disc-like kinematics seen at high resolution, as defined by a smooth symmetric velocity gradient with evidence for a turnover to a flat portion and no abrupt discontinuities in velocity as might be expected if it were two objects engaged in a major merger. Subsequent deeper AO observations of this object (and two others with AO) (Cresci et al. 2009) have confirmed this picture (Figure 4). The large star-formation rate and low value of the Toomre (1964) Q parameter (< 1) implied a gas rich disc forming stars in-situ rapidly and suggested continuous fuelling by cosmological accretion. The value of the local Hα velocity dispersion (σ ~ 50-100 km s-1) was about 2-4× higher than the thin discs of normal local spirals (see Section 1.2.2), however the circular velocity (vc) was quite similar (~ 230 km s-1) leading to a much smaller value of vc / σ which Genzel et al. (2006) identified as a key kinematic parameter (see later discussion in Section 5.1). Genzel et al. pointed out that the dynamically hot disc is more akin to the local thick discs of nearby spirals and there could be a plausible evolutionary connection. They also identified the energy source supporting the large disc gas dispersion (e.g. star-formation feedback, accretion, etc.) as a key problem to understand, a point to which we will return in Section 5.
 |
Figure 4. Three selected z ~ 2 galaxies from Cresci et al. (2009) well fit by kinematic disc models. The middle object, galaxy D3a-15504, was originally observed by Genzel et al. (2006), here it has higher signal:noise. These are Hα emission line maps, top two taken with AO at resolution 0.2 arcsec, the bottom object illustrates how these disc kinematics are still resolved in natural seeing. On the left are the kinematic maps (top row: velocity, bottom row: dispersion) comparing the data and best fit disc models. Hα intensity maps are shown on the top right. Each galaxy is well fit by a rotating disc model but the velocity dispersion is high. Values reach > 100 km s-1. I call out the spatial structure in the dispersion maps (see my discussion in Sections 5 and 6.1) as a particular striking and unexplained feature, not reproduced in the models. Credit: adapted from Figure 2 of Cresci et al. (2009) (selected galaxies), reproduced by permission of the AAS. |
The full SINS survey was carried out from 2003-2008 and observed a total of 80 objects (Förster Schreiber et al. 2009, noting the sample has since been significantly extended Mancini et al. 2011). Sixty-three of the observed galaxies had detected emission-line kinematics and 12 were observed with AO (improving spatial resolution from ~ 0.5 to ~ 0.1 arcsec). Sample selection is the key to comparing high-redshift IFS surveys, SINS had a range of heterogenous sub-samples and in particular included a large number of K-band as well as rest UV-selected galaxies (the latter sub-sample was the focus of the early work of Förster Schreiber et al. 2006). These formed the majority of the the sample and the various papers focussed on these, in particular with the Hα detected sub-sample with 1.3 < z < 2.6 (62 galaxies). A large range of stellar mass was probed (2 × 10⁹ - 3 × 10¹¹ M⊙ with a median of 2.6 × 10¹⁰ M⊙) as the K-band and UV selection tended to pick up complementary populations.
A primary result (echoed in other work) summarised in the survey paper (Förster Schreiber et al. 2009) was that around a third of the sample were rotating star-forming discs (Förster Schreiber et al. 2006) with large ionised gas dispersions ('turbulent discs') with vc / σ ~ 2-4. Another third were objects with no significant kinematic shear but still high dispersion ('dispersion dominated galaxies' in the language of Law et al. 2007) while the remaining third had detectable kinematic structure but no clear disc-like pattern, so they were described as 'clear mergers'. This approximately 1/3:1/3:1/3 split of fundamental kinematic classes is echoed in many other surveys we will see in this section though the exact percentages vary. Morphologically, the discs do not resemble local spirals of similar mass, rather they are dominated by giant kpc scale clumps of emission — and this remains true whether UV, Hα or near-infrared continuum is considered (Förster Schreiber et al. 2011).
Cresci et al. (2009) presented the kinematics of the best quality SINS discs (Figure 4), mostly those with the highest signal:noise ratio and/or AO observations. These are generally massive star-forming galaxies with K < 22.4 and quite large (disc scale lengths of 4-6 kpc). The dynamical modelling of the discs required a large component of isotropic velocity dispersion (40-80 km s-1), construction of the stellar mass Tully-Fisher relationship indicated a 0.4 dex 9 offset at z ~ 2 lower in stellar mass at a given vc and is plausibly reproduced by simulated galaxies. Puech et al. (2008) raise the question about the choice of local relation which can have an effect on the amount of evolution; Vergani et al. (2012) argue this makes negligible difference to the results of Cresci et al. as the different local relations intersect at 1011 M⊙ which is the mass range of the SINS discs considered. Bouché et al. (2007) consider the other velocity-size scaling relation of SINS galaxies (using half-light radii) and concluded this relation was evolved from z = 0.
Clearly distinguishing discs from mergers kinematically is a key issue (to which I will return in the next section), Shapiro et al. (2008) considered this for a sample of 11 SINS galaxies (again highest signal:noise) using the technique of 'kinemetry' (Krajnović et al. 2006), they find 8/11 are discs by this criterion and classify the rest as mergers, though dispersion-dominated objects were excluded as the sample was biassed towards well-resolved objects.
The resolved physical properties of SINS discs was addressed in a series of papers, Genzel et al. (2008) considered possible scenarios for the origin of the turbulence and the evolution of the discs. They argue that the large dispersions applies to cold gas as well as the observed ionised gas and arises from cosmological accretion. There is a correlation of central mass concentration with metallicity (as inferred from the [NII] / Hα line ratio) which which would imply that bulgeless galaxies are younger. Newman et al. (2013) considered an extended AO sample and compared with non-AO observations, in particular finding that the fraction of 'dispersion dominated' galaxies (see Section 5.2) drops with increasing resolution. Genzel et al. (2011) considers the properties of the giant kpc clumps of five galaxies in more detail. Key points are that the clumps are entrained in the overall rotation field of the disc (i.e. they are part of the disc not merging external galaxies), that they occur in regions of disc instability as indicated by Toomre Q < 1 and that they show broad wings 10 indicative of star-formation-driven outflows (Newman et al. 2012b).
3.2. The OSIRIS survey of UV-selected galaxies
The IFS survey of Law et al. (2007, 2009) focussed on 13 UV-selected galaxies observed with the OSIRIS IFS (Larkin et al. 2006) on the Keck telescope. 11 Twelve of these galaxies are at z ~ 2.2 selected using the 'BX' colour criteria of Steidel et al. (2004) and were a subset with high Hα fluxes from previous slit spectra (Erb et al. 2006a) or high star-formation rates calculated from rest-frame UV emission. The IFS subset was mostly selected on the emission line fluxes but also had a subjective selection component for interesting objects with criteria such as extreme ends of the young/low mass old/high-mass scales, multicomponent UV morphology, and unusual UV spectra. A lower z ~ 1.6 sample also selected from the BM/BX catalogue and observed by the complementary project of Wright et al. (2007, 2009); this is described below along with other OSIRIS work at similar redshifts (Section 3.6).
The Law et al. sample galaxies are generally of lower stellar mass (1 × 10⁹ - 8 × 10¹⁰ M⊙ with a median of 1.4 × 10¹⁰ M⊙) by a factor of 2 than the SINS discs at the same redshift; however, there is a broad overlap (Figure 3). All IFS observations where done with laser guide stars (LGS) AO of the Hα line in the K-band so that spatial resolution was 1-2 kpc, several times better than non-AO observations of other surveys. The price to be paid for this was the lower surface brightness sensitivity for extended emission due to the finer pixel sampling and the reduced flux from finite Strehl (≃ 0.3). From the IFS observations, 6/13 galaxies showed clear velocity shears, though merger interpretations were also plausible in 3-4 of these, with 1-2 being very clear discs.
Law et al. note the dominance of objects with high intrinsic dispersions 50-100 km s-1 which were in all cases larger than the maximum velocity shear amplitude (another contrast to the SINS discs), labelling these 'dispersion dominated galaxies'. Some objects had no detectable shear whatsoever. In the comparison of Förster Schreiber et al. (2009), it was shown that the typical 'circular velocities' (under a disc interpretation) and half-light radii (measured in Hα) were also a factor of 2-3 smaller than SINS discs, with the smallest Law et al. objects having sizes of ≲ 1 kpc. This seems consistent with a broader picture where UV-selection favours lower stellar mass, smaller star-forming galaxies at these redshifts and is further discussed in Section 5.2.
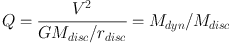
Law et al. (2007) looked at the 'Toomre parameter Q' in three objects as defined by:
 |
(1) |
where V is the observed shear. However, this equation does not correspond well to the standard (Toomre 1964) criterion — though one can obtain it by writing σ = V. It is better thought of as a ratio of dynamical mass (r V2 / G) to visible 'disc' mass (Mdisc), the galaxies all had Q ≲ 1 indicating that the disc mass is unphysical — i.e. too much mass to be supported dynamically by rotation. I also note that interestingly the equation corresponds very closely to the criterion for exponential disc instability (against bar formation) in a dark matter halo independently identified by Mo et al. (1998) (their eqn. 35). The 'Q' values suggest they may be true dispersion-dominated objects and not stable discs, unless the compactness causes V to be significantly underestimated through resolution effects (and their could also be issues with inclination which is not accounted for).
It is important to note that Law et al. observed a similar number of galaxies which were not detected, there was a tendency for these objects to be observed in sub-optimal conditions (e.g. seeing) but there could be a result of a bias of detections to higher surface brightness. The authors do find a systematic trend in the direction expected for this bias compared to the general galaxy population at this redshift. Interestingly, one of the non-detections was subsequently detected by Law et al. (2012a) with a five times longer OSIRIS exposure, it proved to be a high-dispersion rotating disc with a spiral pattern (rare at these redshifts, attributed to a minor merger induction). Three more were observed and also detected by Förster Schreiber et al. (2009) in natural seeing and proved to be rotation dominated, clearly the resolution-sensitivity trade of AO observations is playing a role (as did the longer exposures used).
The incidences of possible discs and mergers seem comparable with other work (perhaps with a trend to less of these at lower stellar masses), however the compactness of these galaxies does not lead to unambiguous characterisation and Law et al. caution against over-simplistic classifications in to these two classes.
3.3. The IMAGES and related FLAMES-GIRAFFE surveys
The predominant IFS work at intermediate redshift (0.3 < z < 1) has been done using the VLT's FLAMES-GIRAFFE multi-object integral field facility. This has produced a large sample from the IMAGES ('Intermediate MAss Galaxy Evolution Sequence') VLT Large Program. FLAMES-GIRAFFE (Pasquini et al. 2002) is an optical facility with 15 separate 'Integral Field Units' (IFUs) patrolling a 25 arcmin field-of-view.
Important early work was done with this instrument by Flores et al. (2006) with a sample of 35 objects (a sample of I < 22.5 emission line galaxies observed at z ~ 0.6 and focussing on the Tully-Fisher relationship and the scatter about that relation identified by the slit based surveys mentioned in Section 2). An important development was the use of 2D kinematic data to simply characterise/classify the velocity fields of star-forming galaxies. The I-band selection at this redshift would be pulling out high stellar mass systems, including objects comparable to the Milky Way. Flores et al. classified galaxies in to three kinematic classes (used extensively in later papers) via inspection of the velocity and velocity dispersion 2D maps:
The measured ratio of RD:PR:CK objects comes out as an almost three way split of 34:22:44 percent. This is a stark contrast to local surveys where virtually all similarly massive galaxies would likely be classified as RD by these criteria, and implies a large amount of kinematic evolution in the galaxy population in the last 6 Gyr. However, star-formation properties also evolve in a similarly dramatic fashion: at these redshifts, nearly half of massive galaxies (> 2 × 10¹⁰ M⊙) are undergoing intense star formation comparable to their past average; this is a significant change from z = 0 (Bell et al. 2005, Juneau et al. 2005). Physically, the growth in the CK classification is attributed by the authors to a strong evolution in the major merger rate with the CKs being either in-process mergers or dispersion-supported merger remnants (Puech et al. 2006). Such objects represent only a few percent of local massive galaxies (Domingue et al. 2009, Xu et al. 2012).
It should be born in mind that these classifications are based on natural seeing data of resolution 0.4-0.8 arcsec (2-4 kpc at z ~ 0.6) and to make matters worse the IFUs have quite coarse sampling (0.52 arcsec micro lenses). Flores et al. use an interpolation technique to present their IFU maps (see Figure 5) but only about a dozen independent kinematic spatial points are measurable for each galaxy. (HST imaging was available for the entire sample at much better resolution.) The classification was tested using simulated maps of each galaxy. A handicap of working in this redshift range is that the strong emission lines ([OII, Hα) used to probe the kinematics are in the optical region, where currently AO systems either do not work or deliver negligible Strehl. So it is not even possible to observe sub-samples with AO (as for example SINS did at z ~ 2). As AO systems improve and work at bluer wavelengths this may be remedied in the future.
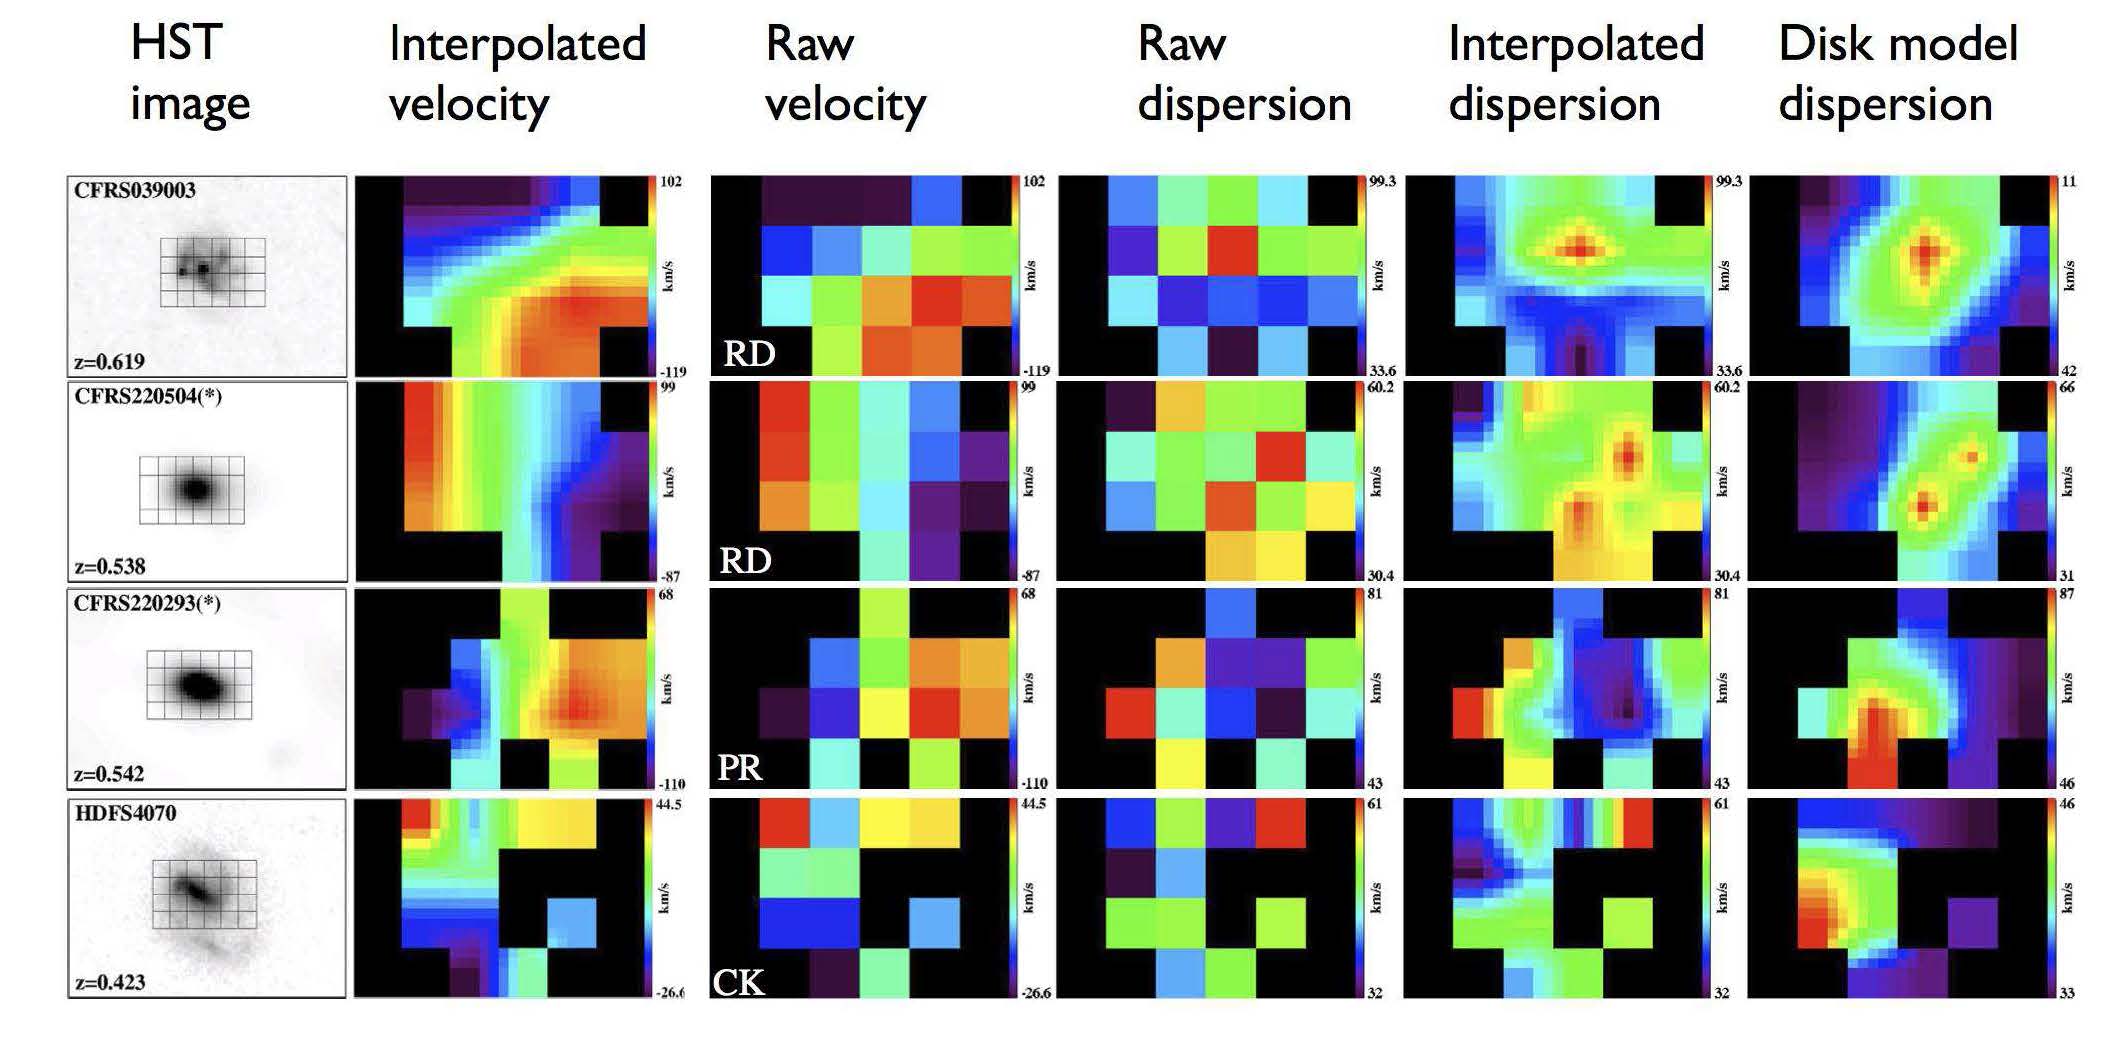 |
Figure 5. Images and IFS maps of galaxies of different kinematic classes from sample FLAMES/GIRAFFE data showing the different kinematic classifications described in the text. Note the rather coarse spaxel scale of 0.52 arcsec (see grid superimposed on higher-resolution HST image) makes classification challenging and a 5 × 5 pixel interpolation scheme was used to smooth the maps. Credit: adapted from Figures 3 & 5 (selected galaxies and combined) of Flores et al. (2006), reproduced with permission © ESO. |
Flores et al. construct a Tully-Fisher relationship and their most important conclusion was that the large residual scatter identified in slit surveys arose from the new kinematic PR, CK classes. The Tully-Fisher relationship for the RD class alone shows reduced scatter comparable to the local relation. The RD relation also shows no detectable zero point offset from the local stellar mass Tully-Fisher relationship of Verheijen (2001), this is in contrast to previous slit-based work. The authors attribute this to the strong evolution in kinematic classes and the inability of slit surveys to distinguish these classes as the kinematics is only measured along a single slice through the galaxy. The RD class does appear to have a significantly higher velocity dispersion and consequent lower v / σ than local galaxies (Puech et al. 2007) echoing the trend found in z ~ 2 galaxies. The PR class extends this trend to even lower v / σ values.
The IMAGES large program (Yang et al. 2008) was an extension of this earlier FLAMES-GIRAFFE work to double the sample size to 63 galaxies over a similar redshift range. From an I-band selected input redshift survey of galaxies with [OII] emission, they are down-selected by rest-frame J-band luminosity, corresponding to an approximate stellar mass limit of > 1.5 × 10¹⁰ M⊙ at the redshift of the survey. Yang et al. confirmed the evolution of the kinematic class fractions, with similar values to those quoted above. Neichel et al. (2008) examined the relation between morphological and kinematic classes and found a very strong correlation between the RD objects and galaxies that appeared in HST images as spiral discs. The Tully-Fisher relationship was explored in more detail by Puech et al. (2008) who reaffirmed the earlier conclusion that the increase in scatter about the mean relation was due to the 'non-relaxed' PR and CK classes (the scatter increases from 0.1 to 0.8 dex from RDs to CKs; shown in Figure 6). However, with a bigger sample and an improved analysis and a revised local reference 13, they now found a modest amount of zero point evolution in the K-band Tully-Fisher relationship (about 0.34 dex or a factor of two in stellar mass at fixed velocity since z ~ 0.6). The high star-formation rate of z ~ 0.6 galaxies implies they are likely to be much more gas rich than local spirals. Puech et al. (2010) tried to incorporate this gas in to the mass budget by inverting the Kennicutt-Schmidt relationship (Kennicutt 1989) between gas and star-formation surface density 14 and construct a baryonic Tully-Fisher relationship. They find that the zero point of this relation does not evolve, that galaxies in their sample have approximately equal stellar and gas masses, and hence conclude that the evolution of the stellar mass Tully-Fisher relationship simply reflects the conversion of this gas in to stars since z ~ 0.6.
 |
Figure 6. Stellar mass Tully-Fisher relationship at z~ 0.6 from the IMAGES survey showing the dependence of the increase of scatter as the kinematic class goes from regular discs to objects with irregular kinematics. Credit: adapted from Figure 3 (left panel) of Puech et al. (2010), reproduced with permission © ESO. |
The Mass Assembly Survey with SINFONI (MASSIV) sample is an IFS survey at 0.9 < z < 1.8 of 84 galaxies, 11 with AO-LGS (Contini et al. 2012). Selection is from the VVDS redshift survey (Le Fèvre et al. 2005) either using the [OII] emission line strength or rest-frame UV luminosity at the higher redshift end, and with a hierarchical selection scheme ('wide', 'deep' and 'ultra-deep' VVS parent samples). Early results from preliminary samples were presented on kinematic classification (Epinat et al. 2009). The full survey description of Contini et al. shows a comparison in the star-formation rate-stellar mass main sequence plane with other samples (reproduced in Figure 3). The distribution of star-forming galaxies at 1 < z < 2 is reasonably sampled by MASSIV, though of course their might be biases (e.g. against dusty star-formers without UV or line emission) and there is a deficit of the very massive (> 1011 M⊙) star-forming galaxies sampled by SINS at z > 2.
Epinat et al. (2012) presents an analysis of the kinematical distribution. After considering multiple possible classification parameters (strength of velocity shear, kinematic/morphological alignment, residuals to disc fits, velocity dispersion maps, presence of companions — B. Epinat, 2013, private communication), the team settled on two principal classification dimensions. The first was between 'rotators' (44%) and 'non-rotators' (35%) with the remaining 21% not having sufficient signal:noise to classify. The second was between isolated and merging / interacting galaxies, the latter make up 29% of the entire sample but it is important to note that there is some overlap (e.g. some rotators are interacting). This categorisation is rather different to the classifications done in the other surveys (e.g. SNS, IMAGES) where for example rotators and mergers are exclusive categories. This partly arises from the fact that the identification of mergers in MASSIV comes from the presence of multiple components (separated spatially and kinematically) in their IFS images, this is different from the approach of identifying irregular velocity maps. That said, there is a considerable overlap between the non-rotators and mergers (about half of non-rotators are classified as interacting vs only 20% of rotators) and the isolated non-rotators tend to be smaller. Thus, if one were to think of this in terms of the disc:merger:dispersion-dominated trichotomy of other surveys, the fractions are similar — a roughly three way split. López-Sanjuan et al. (2013) present a more detailed analysis of the merger rate in the sample, taking advantage of the wide-field of the SINFONI IFS (~ 70 kpc at z ~ 1.3) to systematically define the close pair fraction by spatial proximity and separation in redshift. This is a unique IFS science application; imaging surveys can not determine the association along the line of sight and long-slit observations do not cover enough sky area to find non pre-selected secondary objects. Of course the IFS approach does require the companion to have emission lines above a detection limit, as such they are only sensitive to gas-rich mergers. They found a merger fraction of ≃ 20% across a range of redshift; using a time-scale model this was translated in to a merger rate and cumulative merger number for massive galaxies over 0 < z < 1.5. I discuss the merger rate and the comparison with other techniques in more depth in Section 5.4.
The 'rotator' classification is made by considering fractional residuals from a fitted disc model vs alignment between kinematic and morphological axis (I discuss this further in Section 4.5). Rotating galaxies are found to be larger and have higher stellar masses and star-formation rates (typically by a factor of two in each), a result similar to other surveys. The typical disc velocity dispersion is found to be ~ 60 km s-1. Comparing with the SINS/AMAZE/LSD samples at higher redshift, and the lower redshift IMAGES and the local GHASP (Epinat et al. 2010) samples, evidence is found for a smooth evolution in disc local velocity dispersions. Interestingly, similar dispersions are found for rotators and non-rotators, with the latter having a strong anti-correlation between size and dispersion.
Vergani et al. (2012) presents the Tully-Fisher relationship and size-velocity scaling relations and again compare with the IFS samples at different redshifts. The rotators at < z > ≃ 1.2 show consistency with a small scatter stellar mass Tully-Fisher relationship, whilst the non-rotators depart radically from this. The question of evolution depends on which local Tully-Fisher relationship is assumed (an issue also highlighted by Puech et al. 2008), but the comparison with Pizagno et al. (2007) suggests a -0.36 dex evolution of the zeropoint fairly similar to that found by SINS (Cresci et al. 2009) at z ~ 2, consistent with the idea of discs increasing their stellar mass with time at a fixed vc. Consistent gas fractions were found using both the Kennicutt-Schmidt relationship and the difference between dynamical and stellar mass. The baryonic Tully-Fisher relationship does not appear evolved since z = 0 similar to the findings of Puech et al. Size-velocity evolution in MASSIV appears modest (at most 0.1 dex smaller sizes at high-redshift at a given stellar mass).
The AMAZE ('Assessing the Mass-Abundances Z Evolution') and LSD ('Lyman-Break Galaxies Stellar Populations and Dynamics') are two related surveys (by substantially the same team, and usually analysed jointly) using SINFONI of galaxies at z > 3, a substantially higher redshift than the other large surveys. AMAZE (Maiolino et al. 2008) targeted UV-selected galaxies (classical LBG selection) mostly at 3 < z < 3.7 (U-band dropouts) with a few at 4.3 < z < 5.2 (B-band dropouts) from deep spectroscopic surveys in the Chandra Deep Field South and performed observations in natural seeing (0.6-0.7 arcsec PSF). LSD (Mannucci et al. 2009) employed a similar LBG selection at z ≃ 3 and focused on natural guide star AO observations, drawing on the large catalog of Steidel et al. (2004) to find objects near suitable AO stars. Typical magnitudes were R ≲ 24.5 corresponding to a mass range of 1010-11 M⊙ at z ≃ 3. Some lensed galaxies were also included but their analysis has not been published.
Gnerucci et al. (2011b presented the kinematic analysis of the AMAZE/LSD samples, in particular 23 AMAZE and 9 LSD galaxies all in the range 2.9 < z < 3.7 apart from one object at z = 2.6. They presented a two-stage approach to identifying rotating disc galaxies: first, they fitted a simple linear velocity shear model to the IFS maps. Galaxies with statistically significant shear were classed as 'rotating' and then subject to full disc model fitting. An advantage of this approach is that fitting a shear requires substantially less model parameters and is more robust in low signal:nose data. This gave some quite interesting results which shed light on the comparisons of other surveys: 10/23 of the AMAZE galaxies but only 1/9 of the LSD galaxies were rotators. In my view, this is quite a significant difference given the very similar and comparable selection and observations of the AO and non-AO samples and the previous comparisons of the SINS (mostly non-AO, larger fraction of rotation-dominated discs) and OSIRIS (all AO, mostly dispersion-dominated) samples. It is likely that at least part of this is due to the greater sensitivity of the non-AO observations to the low surface brightness extended, rotating, outskirts of disc galaxies as Gnerucci et al. note. There was no overlap between AO and non-AO samples.
For the rotators, estimates of dynamical mass were constructed from the modelling and were consistent with large gas fractions (up to 90%) when compared to the stellar mass. Gnerucci et al. compared this to the gas masses inferred another way by inverting the Kennicutt-Schmidt relationship and found a plausible 1:1 correlation. The v / σ ~ 2 values of the rotators were a factor of two less than that of SINS discs at z ~ 2, which seems consistent with the higher gas fractions compared to z ~ 2 in the framework of the 'turbulent gas-rich disc' model (see Section 5.1). The Tully-Fisher relationship of the discs was consistent with a large -1.0 dex decrease in the stellar mass at a given velocity relative to local galaxies, substantiality more than at z ~ 2, but with a very large scatter (~ 0.5 dex).
Other AMAZE/LSD papers considered the evolution of the stellar mass:global metallicity relation (Mannucci et al. 2010, 2009) and the discovery of positive metallicity gradients (i.e. metal poor galaxy centres) in a sub-set of galaxies (Cresci et al.2010).
3.6. Other optical/near-infrared IFS surveys at z > 1
As well as the large surveys, several smaller projects should be mentioned, these tend to probe complementary parameters spaces.
In particular in the 1 < z < 2 regime AO is possible, but difficult, since one must target Hα in the near-infrared H-band where it has reduced Strehl. Wright et al. (2007, 2009) present OSIRIS AO kinematics of seven galaxies at 1.5 < z < 1.7 UV-selected and with prior optical spectroscopy using the BM/BX criterion. They find four of these to have kinematics consistent with disc systems and high intrinsic velocity dispersions (> 70 km s-1) in at least two of these. Wisnioski et al. (2011) presents OSIRIS AO kinematics of 13 galaxies a ~ 1.3, again selected by rest-frame UV emission and optical spectroscopy, but selected from a wider area survey probing higher UV luminosities and star-formation rates higher than more typical z ~ 1.3 galaxies (but comparable to z > 2 SINS disc). They again find that around half the objects have disc-like kinematics and high intrinsic velocity dispersions and clumpiness. The resolved star-formation properties and clump scaling relations were examined further in Wisnioski et al. (2012). An interesting difference between the Wright et al. and Wisnioski et. al. samples lies in the nature of the non-disc candidates — in the first they are extended objects with multiple sources of resolved Hα emission and irregular kinematics whereas in the latter they tend to be single compact sources of Hα emission with mostly dispersion-dominated kinematics (i.e. similar to the Law et al. objects at z > 2 illustrated in Figure 13). It is not clear if this reflects the different selection, luminosity and/or space density, or simply the signal:noise of the data. More luminous Hα objects are easier to map; however, the actual effect seems reversed in that the fainter non-disc sources of Wright et al. tends to have more extended Hα morphologies.
An alternative selection technique to the broad-band-selected surveys mentioned above is via the use of narrow-band imaging which has the advantage that the galaxies are already known to have the strong emission lines required for successful IFS observations. Swinbank et al. (2012b) observed with SINFONI 14 Hα selected emitters at redshifts 0.8, 1.5 and 2.2 corresponding to the wavelengths of their narrow-band filters of the parent imaging sample ('HiZELS', Sobral et al. 2009, 2013), and with a stellar mass range similar to the SINS survey. AO IFS maps were obtained for nine of these galaxies, five of which were classified as discs (+ two mergers and two compact galaxies), again very similar fractions to other surveys. The stellar mass Tully-Fisher relationship was examined showing a factor of two evolution in mass at a fixed velocity since z ≲ 2. The discs themselves were physically very similar to SINS discs in that they had high dispersion, low v / σ values as well as clumpy star-formation and high gas fractions (Swinbank et al. 2012a). One particularly interesting point was that two of the objects with AO observations were at z = 0.84, though the reported Strehl was low (≃ 10%) as is normal with current systems for J-band observations. Notably this is the only AO IFS observations I know of for galaxies at 0.3 < z < 1.
An especially powerful combination has been to combine AO IFS observations with the gravitational strong lensing effect of giant clusters at intermediate redshift which can often magnify background galaxies by factors of up to 10-50 (see the review of Treu 2010). Such strong lensing only occurs over limited sky areas, and the objects most magnified tend to be the faint but numerous objects not probed by other surveys. A key question is: do the sensitivity and coarser resolution limits of the non-lensed surveys give us a biased view of the high-redshift population? The lensed surveys also allow us to probe z > 3 and smaller spatial scales. Stark et al. (2008) (Figure 7) and Jones et al. (2010) consider a sample of six lensed sources magnified up to 50× at 1 < z < 3. They find a much higher-incidence of rotating, high-dispersion discs (4/6) than in the more luminous sources probed by unlensed surveys and in all cases the galaxies are resolved in to multiple emission line clumps. Yuan et al. (2011, 2012) present observations of two more objects which again seem consistent with the picture of high dispersion, low v / σ clumpy discs. The highest redshift examples to date are two lensed z ~ 5 galaxies (Swinbank et al. 2007; Swinbank et al. 2009) observed in [OII] and with very low dynamical masses (109-10 M⊙) and velocity shears (< 100 km s-1) compared to the other surveys but still relatively large velocity dispersions (~ 80 km s-1). A particular benefit of the gravitational lens observations is the use of the high linear magnification to probe the size of star-forming clumps. Currently, only lensing can deliver ~ 100 pc spatial resolution of high-redshift galaxies, resolution is critical for accurate size measurements and hence testing the picture of large high-Jeans mass clumps in unstable discs (Jones et al. 2010, Livermore et al. 2012). I will return to this scenario in Section 5.1. Two more notable lensed objects are presented in (a) Nesvadba et al. (2006) of a giant arc at z ~ 3 whose de-lensed kinematics suggests a rotating disc and (b) Nesvadba et al. (2007) a lensed sub-mm galaxy with merger-like kinematics.
 |
Figure 7. A beautiful example of a small disc galaxy at z = 3.07 with dynamical mass ~ 2 × 10⁹ M⊙ and star-formation rate ~ 40 M⊙ yr-1 from Stark et al. (2008) lensed 28-fold and demonstrating a near-complete Einstein Ring observed at ~ 100 pc resolution with the assistance of gravitational lensing and AO. Maps on the left show (a) lens reconstructed rest-UV continuum (~ 1500Å) emission, (b) [OIII] 5007]Å line emission (with contours showing Hβ), (c) velocity map and rotation curve showing a characteristic 'spider diagram' and (d) dispersion map and curve (tilted lines show extraction axis). (See Stark et al. for full figure details.) The galaxy is clumpy in continuum and line emission but is a clear disc with a turnover and high dispersion in the kinematics. The top-right panel shows the original sky plane image (composite red: K-band, green: [OIII], blue: HST V606 filter) known as the 'Cosmic Eye' with the red central source being the z ~ 0.7 lens. Credit: adapted from Figures 1 & 2 of Stark et al. (selected panels and combined), reprinted by permission from Macmillan Publishers Ltd: Nature, 455, 775 © 2008. |
In addition to the MASSIV survey, other samples of galaxies selected from the VVDS sample have been observed with SINFONI (non-AO). Lemoine-Busserolle & Lamareille (2010) present a sample of ten 1.0 < z < 1.5 galaxies selected on their [OII] emission, finding eight rotating high-dispersion discs, one clear merger, and one object with no kinematic variation interpreted as face-on. They split the discs almost equally between 'rotation dominated' and 'dispersion dominated' around v / σ = 1.66 which appear to follow relatively offset stellar mass Tully-Fisher relationship relations (and both evolved from the local relation). Lemoine-Busserolle et al. (2010) select three intermediate stellar mass (1-3 × 10¹⁰ M⊙) z ~ 3 galaxies from VVDS based on their rest-frame UV VVDS spectra and observed in the near-IR in Hβ, [OIII] lines. They have very high star-formation rates for this redshift — as a result of being selected as I < 24 in VVDS they are brighter in the rest frame UV than typical z ~ 3 galaxies. All three have high dispersion and small shears (v / σ ≲ 1), one was tentatively classified as a merger based on anomalous kinematics, and the other two were consistent with rotating disc models. However, interestingly, both of the latter displayed secondary components consistent with close companions. The typical velocity shears are small (< 50 km s-1) and they argue the properties of the sample are very similar to those of the Law et al. objects at z ~ 2. Another z ~ 3 LBG observed with SINFONI is presented by Nesvadba et al. (2008), this is interpreted as a merger.
All of the surveys presented so far, and a majority of the discussion, has focussed on 2D kinematics measured using rest-frame optical emission lines observed in the near-infrared. A change from this and an interesting development has been the first kinematic measurements at high-redshift using sub-mm wavelength lines, so far of the CO molecule.
High-redshift star-forming galaxies are rich in molecular gas and dust. In particular, among the massive star-forming galaxies, we see a population of 'sub-mm galaxies' (Blain et al. 2002) with strong emissions at these frequencies due to star-formation rates up to 1000 M⊙/yr per year (e.g. Michałowski et al. 2010). A strong correlation of star-formation approximately proportional to stellar mass is observed at high-redshift (the 'star-forming main sequence' (Noeske et al. 2007, Daddi et al. 2007) but the classical 'sub-mm galaxies' may lie above this relation and may represent rare events such as major mergers (Daddi et al. 2010a). Main sequence massive star-forming galaxies at z ~ 2 have up to 50% gas fractions (Tacconi et al. 2010, 2013) several times higher than local massive spirals.
There are now over 200 total molecular gas measurements at high-redshift (e.g. see review of Carilli & Walter 2013), although the spatial resolution is usually rather coarse (0.5-1.0 arcsec) due to the baseline limitations of current sub-mm interferometers; however, this does allow some kinematic measures for larger galaxies. Early work by Genzel et al. (2003) using the IRAM Plateau de Bure Interferometer modeled the CO kinematics of a sub-mm-selected galaxy as a large rotating disc. Daddi et al. (2008) observed a more normal main-sequence galaxy and showed that it was disc-like. The 'PHIBSS' CO survey of 52 main sequence star-forming galaxies (Tacconi et al. 2010, 2013) at z ~ 1.2 and 2.2 found that 60% where kinematic discs and that the CO velocity dispersions were high and agreed with the Hα values. This is an important point as molecular gas is likely to dominate the mass budget with ionised gas being only a small fraction. A detailed spatial comparison of Hα optical, NIR and CO data was performed for one of these galaxies by Genzel et al. (2013). They found that Hα and CO traced the same rotation curve and also evidence for variable dust extinction, an important caveat to be considered when interpreting optical maps.
There are only a handful of cases in the literature with kpc resolution and these are mostly objects with a gravitational lensing boost to the resolution. Swinbank et al. (2011) presented CO line observations of the z = 2.32 lensed sub-mm galaxy SMM J2135-0102 which has a total star-formation rate of ~ 400 M⊙ / yr (about 10 × the 'main sequence' value for it's mass). The beam was ~ 0.5 arcsec and with the 30-fold lensing boost resolution of 100 pc was obtained. Despite the extreme star-formation rate the CO kinematics showed that the molecular gas was distributed in a turbulent rotating disc (see Figure 8) with v / σ ~ 4 consistent with the picture inferred of other massive z ~ 2 star-forming galaxies from ionised gas. Hodge et al. (2012) analysed a single z = 4.05 very bright sub-mm galaxy where the CO lines are redshifted down to the higher radio frequencies. Using a wide Very Large Array spacing and 120 h of integration, they made a map at 0.2 arcsec resolution which revealed a clear disc of dispersion ~ 100 km s-1 with clumpy molecular gas (clump masses ~ 109 M⊙). In contrast to these results, Hα kinematics of z ~ 2 sub-mm galaxies have instead found that they mostly have complex velocity fields with multiple components showing distinct kinematic offsets (Nesvadba et al. 2007, Alaghband-Zadeh et al. 2012 and notably Menéndez-Delmestre et al. 2013 the first with AO). The origin of this difference between kinematics in CO vs Hα is not clear but is likely due to the small numbers of objects involved and heterogenous selection. Of course the optical/near-IR selected general star-forming galaxy populations are also diverse but are somewhat better characterised.
 |
Figure 8. Resolved CO velocity map of lensed z = 2.32 sub-mm galaxy SMM J2135-0102 reconstructed in the source plane. This is one of only two published well-resolved molecular line velocity maps of a high-redshift disc galaxy. The effective lensing PSF (which is anisotropic) is shown as the white ellipse at the top right. Contours are of velocity and the yellow crosses are the locations of the star-forming clumps. The galaxy is well fit by a disc model, the inset shows the residuals. Credit: from Figure 4 (top panel) of Swinbank et al. (2011), reproduced by permission of the AAS. |
With the ongoing deployment of ALMA (Hills & Beasley 2008), we can expect such observations to become routine, and expand to non-lensed samples of non-extreme objects, in the next few years.
While my main consideration in this review is IFS kinematic surveys in the last decade, it is necessary to also mention some of the important kinematic results from the more recent contemporaneous slit-based surveys as these have sampled much larger numbers of high-redshift galaxies, albeit in 1D. These have mostly come from the DEIMOS multi-object spectrograph on Keck (Faber et al. 2003) due to its relatively large slit mask area and high spectral resolution for kinematics. Weiner et al. (2006a, 2006b) examined the Tully-Fisher relationship of ~ 1000 galaxies at z ≲ 1 in the 'Team Keck Redshift Survey' using both integrated velocity dispersion (i.e. a similar idea to Forbes et al. 1996) and resolved rotation curve fits for the larger galaxies (~ a third of the sample) and found strong evolution in the B-band (fading with time) but little in the near-infrared, with large scatter (0.3 dex) attributed to dispersion-dominated galaxies.
Kassin et al. (2007) looked at the stellar mass Tully-Fisher relationship of 544 galaxies (0.1 < z < 1.2) with resolved kinematic modelling from the DEEP2 redshift survey (Newman et al. 2013a), as in earlier work they found a large scatter (~ 1.5 dex) at higher redshifts dominated by the more disturbed morphological classes and the lower stellar masses and echoing the results from the IFS-based IMAGES survey at similar redshifts discussed earlier. Kassin et al. and Weiner et al. introduce a new kinematic measure S0.5 = 0.5 v2 + σ2, combining rotation and velocity dispersion and found the S0.5 Tully-Fisher relationship of all kinematic classes showed considerably reduced scatter (~ 0.5 dex) and no evolution in intercept nor slope (see Figure 15). The conclusion was that at higher redshifts, the star-forming galaxies are increasingly supported by dispersion arising from disordered motions (Weiner et al. 2006a). The M-S0.5 relation was also found to agree with the local Faber-Jackson relation for elliptical galaxies suggesting a possible evolutionary connection. Also using DEEP2, Fernández Lorenzo et al. (2009, 2010) considered the evolution of the Tully-Fisher relationship to z ≳ 1 using integrated line widths to estimate rotation velocities of visually selected spirals; they found evolution in the B-band consistent with other studies but not in the K-band. However, when they consider the required evolution in K-band mass:light ratio with time, they conclude that stellar mass may have doubled at fixed velocity in the last 8 Gyr.
The recent DEIMOS survey of Miller et al. (2011) has provided a different, possibly conflicting, perspective on Tully-Fisher relationship evolution. They observed only 129 0.2 < z < 1.3 galaxies but unlike previous surveys, which were typically 1-2 h spectroscopic exposures, they took much longer 6-8 h exposures and took care to align the slits to within 30∘ of the HST-derived galaxy major axis. Like previous studies, they find evolution in the blue but little in the stellar mass Tully-Fisher relationship, but interestingly they report a smaller scatter of only ~ 0.06 dex in log10 v (0.2 dex in stellar mass), a factor of two less than in previous surveys. This they attribute to their longer exposures which, for what they call 'extended emission galaxies', means they can reach the flat-portion turnover in 90% of their galaxies and place all of them on a tight Tully-Fisher relationship and without requiring an extra parameter such as S0.5. This seems in contradiction to the IFS results (primarily of the IMAGES survey) in the same redshift range. Nearly half the IMAGES sample are the CK class which contribute ~ 0.8 dex of scatter and do not have regular disc-like kinematics. It also seems to conflict with the kinematic fractions in the larger, but shallower, survey of Kassin et al. with the same spectrograph.
If the samples are broadly comparable, there is definitely a contradiction. It is important to note that Miller et al. only recover rotation velocities for 60% of their targeted sample (the remaining 40% are too compact in emission or have no emission) and that they did not target 20% of their input sample as, again, being too compact. It seems unlikely though that pure sample effects can explain the discrepancy completely, as many of the Miller et al. galaxies have the peculiar/disturbed morphologies characteristic of other samples. Perhaps the explanation is that deeper observations of 'CK objects' show large-scale rotation? (And it can not simply be deeper observations revealing shear from merging components as one would not then expect them to lie on the Tully-Fisher relationship). The IMAGES survey also used 4-15 h exposures, though it is expected that an IFS instrument may have less throughput and the FLAMES-GIRAFFE sampling was relatively coarse. Interestingly, Miller et al. did observe three of the actual CK galaxies from the Flores et al. (2006) sample, noting the velocities were consistent within the IFS area. Comparing the tabulated properties of the objects in common, I note that Miller et al. report masses 0.8-0.9 dex less for these same three objects, with velocity agreement for two. These particular CK objects lie fairly close to the IMAGES Tully-Fisher relationship compared to other CK objects, and all show distinct velocity shears in the maps of Yang et al. (2008) and so may be mis-classified. They may not be comparable with the other CK objects; a proper comparison would require more overlap.
Miller et al. (2012) extends their sample to 1.0 < z < 1.7 taking advantage of a newly installed extra-red sensitive CCD in the LRIS spectrograph on Keck (Rockosi et al. 2010). They successfully detected extended emission and measure rotation curves in 42 galaxies (out of 70 observed) and report a virtually non-evolving stellar Tully-Fisher relationship at these redshifts (in conflict with Vergani et al. 2012), again with small scatter (Miller et al. 2013 attributes residual scatter to bulgeless galaxies at z > 1 following an offset - Tully-Fisher relationship). Again there seems to be a conflict in kinematic classification, half the MASSIV sample at similar redshifts were classified as non-rotating based on 2D IFS data (albeit several times shorter exposure times). One must consider that in these slit surveys, the slit angle must a priori be chosen from imaging data, it seems unlikely that one could choose this correctly to align with the rotation axis as would be required to make a tight Tully-Fisher relationship relation, given that MASSIV (Epinat et al. 2012) reports that at least half of their sample are highly misaligned. Is it possible that kinematic and photometric alignment could only be revealed at low surface brightness on large scales? Is it really possible to determine kinematic axes photometrically from the clumpy morphologies of galaxies at these redshifts? The implications of the disagreements apparent in the literature are not yet clear.
These questions aside, there does seem to be general agreement between IFS and slit surveys on the increasing contribution of internal velocity dispersion to disc kinematics. Kassin et al. (2012) (based on the same DEEP2 sample) report a continuous increase in dispersion to z = 1, matching with the IFS samples at the same, or higher, redshift and consequent decrease in v / σ. Interestingly, by defining a 'disc settling criteria' of v / σ > 3 (a value which they claim correlates with normal vs disturbed physical and kinematic morphologies), they find a 'kinematic downsizing' trend with stellar mass in the sense that high-mass galaxies 'settle' at earlier times (for example 50% of 10.3 < log(M / M⊙) < 10.7 galaxies are settled at z = 1 compared with 90% at z = 0.2).
A couple of groups have published IFS kinematics of rare samples of nearby galaxies that are possible analogues of high-redshift populations.
The 'Lyman-Break Analogues' (LBAs) are galaxies at z ~ 0.2 selected as Lyman dropouts from space-UV observations from the GALEX satellite. In particular, Heckman et al. (2005) define a population with very similar UV luminosity, stellar masses, and star-formation rates to z ~ 3 LBGs and divide them in to 'compact' and 'large' categories based on UV size and surface brightness. The large LBAs have stellar masses of ~ 1011 M⊙, lower surface brightnesses and sizes of up to 10 kpc, the compact LBAs are typically a factor of ten less massive and sizes < 2 kpc. They display similar colours and metallicities to the LBGs (Overzier et al. 2010) and similar morphologies dominated by large clumps of star-formation (Overzier et al.2008, 2009).
At these modest redshifts, it is possible to do AO observations using the Paschen-α line in the K-band, which is not possible at zero redshift as it falls in the absorption trough between the H and K-bands. For Case B recombination (Hummer & Storey 1987) Pa-α is 12% the intensity of Hα (in the absence of dust — any extinction would make the ratio more favourable) however it is easily detectable in such nearby galaxies with excellent spatial resolution. A high-luminosity subset of the compact population (dubbed 'supercompact') has been followed up by AO IFS using OSIRIS (Basu-Zych et al. 2009, Gonçalves et al. 2010) and reveal themselves to be excellent analogues to the dispersion dominated galaxies studied by Law et al. at z ~ 2. They have high ionised gas dispersions (50-130 km s-1), some evidence of small rotation/kinematic shears and low v / σ ≲ 1 all very similar to the properties of the Law et al. sample. This was confirmed by carrying out an 'artificial redshifting' computation to simulate the appearance of the galaxies to OSIRIS and SINFONI at z ~ 2. Overzier et al. (2008) and Gonçalves et al. (2010) concluded that LBAs are mainly mergers based on HST morphology and OSIRIS kinemetry.
More recently, Green et al. (2010) and Green et al. (2013) analysed an IFS sample of nearby (z ~ 0.1) but rare galaxies selected on their high Hα luminosity from SDSS spectra. In galaxies with L(Hα) > 1042 erg/s they made kinematic maps at ~ 2 kpc resolution in Hα (natural seeing observations) and identified galaxies with high ionised gas dispersion(> 50 km/s), about two-thirds of which were discs. This high-incidence of rotation, the large stellar masses (up to 1011 M⊙ and large sizes (2-10 kpc) suggest that they could be more similar to z ~ 2 discs than LBAs; however, further work and higher spatial resolution observations (see discussion in Davies et al. 2011) are required to confirm this.
Another interesting set of local analogues are 'tadpole' galaxies which have a 'single clump + tail' morphology. These were first identified at high-redshift by van den Bergh et al. (1996) where their incidence is higher. A handful have since been identified locally in the SDSS survey (Straughn et al. 2006, Elmegreen & Elmegreen 2010). Elmegreen et al. (2012) found these to constitute 0.2% of UV bright surveys (compared to 6% of high-z galaxies; Straughn et al. 2006) and have stellar masses ≲ 109 M⊙; they attribute the morphology to lop-sided star-formation. The clumps have masses of 105-7 M⊙; the galaxies appear to resemble scaled-down high-redshift tadpoles. The tadpoles have high Hα velocity dispersion and show evidence for marginal rotation dominance (Sánchez Almeida et al. 2013). Yet another class of rare low mass galaxies which might be similar to high-redshift objects are the 'green peas' 15 first discovered by public volunteers inspecting SDSS images in the Galaxy Zoo project (Cardamone et al. 2009). These are very compact (2-3 kpc) low mass (108 - 1010 M⊙) but with high star-formation rates (> 10-30 M⊙ yr-1), low metallicities and have complex kinematics with velocity dispersions of 30-80 km s-1 (Amorín et al. 2012) suggesting similarities (apart from the substantially lower stellar masses) to the 'dispersion-dominated' objects seen at high-redshift (see Section 5.2). Only a limited amount of high-resolution HST imaging has been done but reveals clumpy morphologies. IFS observations are needed (for example to compare v / σ).
A final point to remember in considering such 'local analogue' samples is that one is inherently selecting rare and unusual populations nearby, which are then being compared to the bulk galaxy population at high-redshift. It is quite possible that physical processes that are rare locally, such as mergers, may dominate such selections and make a comparison misleading. The advantage of course is that a much greater wealth of multi-wavelength and high spatial and spectral resolution follow-up observations are available than at high-redshift to test physical models. A simple example is using deep imaging to test for tidal tails from mergers, which could be too low surface brightness to be seen at high redshift.
8 Though SINS and SINFONI are often associated as we shall see there are two other large high-redshift surveys performed with SINFONI by independent teams, as well as smaller ones. Back.
9 All dex values reported in this review refer are in log mass or log luminosity unless otherwise stated. Back.
10 An important point is that these are even broader wings (several hundred km s-1 width) on a central component which is often confusingly called 'narrow' despite being broader than in local disc galaxies. Back.
11 The lack of an acronym is, in my opinion, refreshing. Back.
12 Note both of these are required: a purely linear velocity gradient will not have a centrally peaked dispersion, rather the dispersion is uniformly boosted. Back.
13 The local stellar mass relation was based on the K-band one of Hammer et al. (2007), which they derive from the SDSS relation of Pizagno et al. (2007). Hammer et al. examine the Verheijen relation (which is also the basis of the Bell & de Jong (2001) relation) and conclude that it is biased and the SDSS relation is more reliable. Back.
14 A recent review of such 'Star-Formation Laws' in nearby galaxies is presented by Kennicutt & Evans (2012). Back.
15 The name denotes their compact, unresolved, green appearance in SDSS with the colour arising from the particular combination of strong emission lines, redshift and SDSS filter set. Back.