


Contrary to gas outflows where observational evidence abounds, direct evidence of gas inflows is notoriously difficult to obtain. As described in this book, this situation has begun to change. One can study gas accretion via Lyman Limit Systems (see chapter by N. Lehner), studies of galaxy spectra (see chapter by K. Rubin), UV spectroscopy of quasars (see chapter by P. Richter), or Lyman alpha emission (see chapter by S. Cantalupo). In this chapter, I will focus on the recent breakthroughs on detecting gas accretion which came from recent technological advancements with integral field units (IFUs).
2.1. Observational and Technological breakthroughs
To study gas accretion, one can take advantage of one recent key observational result established only about 5-6 years ago, namely that the gas distribution as traced by low-ionization lines (such as Mg ii, [Na D]) is highly anisotropic (see chapter by G. Kacprzak). The first evidence which showed that the circumgalactic gas was anisotropic came from a study of [Na D] absorption in stacked spectra from a large sample of ∼ 1000 SDSS galaxies (Chen et al. 2010). Their results showed a strong inclination dependence of the blue-shifted absorption lines. Had the gas been isotropic, this inclination dependence would not have been found.
Another important result came soon after with the investigation of the radial and azimuthal dependence of the low ion Mg ii in a sample of 4000 intermediate redshift galaxies with 5000 background galaxies in the COSMOS survey (Bordoloi et al. 2011). They found that –for blue star-forming galaxies– there is a strong azimuthal dependence of the Mg ii absorption within 50 kpc of inclined disk-dominated galaxies, indicating the presence of a strongly bipolar outflows. This result was soon confirmed with two key studies at z = 0.1−1 using background quasars which have the advantage that they can probe the properties of gaseous halos around individual galaxies (Bouché et al. 2012; Kacprzak 2012). While the presence of strong bipolar outflows leaving galaxy disks more or less perpendicularly, i.e. in the direction of the minor-axis, these studies with background quasars revealed that the low-ionization gas traced by Mg ii do also trace the outskirts of gaseous disks when the quasar's location appear to be aligned with the minor axis. Indeed, the azimuthal angle α 1 distribution of background quasars with Mgii appears to be bi-modal with a main peak at α ∼ 90 deg (aligned with the minor-axis) and at α ∼ 0 deg (aligned with major-axis) (Bouché et al. 2012; Schroetter et al. 2015, 2016).
Thus, a picture is emerging from these observations where outflows occur preferentially along the minor axis of galaxies, with also large gaseous structures (as described in the previous section) that are roughly co-planar with the star-forming galaxy. Figure 1 represents schematically the situation with outflows leaving the galaxy along the minor-axis and gas inflows forming the so-called ‘cold flow disk', the gaseous structure discussed in the previous section and in the chapter by K. Stewart. The cold gas in outflows as traced by Mg ii extend to at least 80–100 kpc, but outflows could extend to the virial radius. The cold-flow disk on the other hand is typically 20–30 kpc, i.e. extends to a few tens of the virial radius.
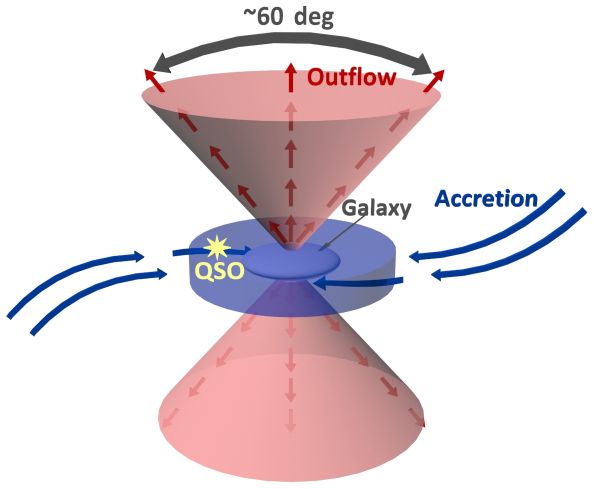 |
Figure 1. Schematic representation of gas flows around galaxies [reproduced from Bouché et al. 2013] |
Quasar absorption lines (such as the low-ionization Mg ii λλ 2796,2803 doublet) have had the potential to yield important information on gas flows for decades, but the challenge has always been in finding the galaxy associated with a particular absorber. Indeed, in order to connect the properties of the Circum Galactic Medium (CGM) with those of galaxies, such as SFR, mass, etc., it is necessary to identify the galaxy associated with each metal line absorption system. This identification process has been a challenge more decades because it is inherently expensive and inefficient with traditional imaging and spectrographic instruments. As described in this book, one can take deep imaging, but one will need to perform extensive multi-object spectroscopy of all of the galaxies within a certain impact parameter around the quasar.
But in the past 10 years, there has been a technological breakthrough, with the advancements of IFUs on 10-m class telescopes. Indeed, with an IFU, one can simply point-and-shoot at a quasar field and identify line emitters at the expected redshift of the absorption system (Figure 2). However, the IFU must have a sufficiently large field of view (FOV). Two IFUs, both on the VLT, have played a major role in this area: the near-infrared IFU SINFONI (with a FOV of 8 arcsec × 8 arcsec; Bonnet et al. 2004) and the new optical IFU MUSE (with a FOV of 1' × 1'; Bacon et al. 2010).
This technique was pioneered by Bouché et al. (2007) on a sample of 21 Mg ii absorbers selected from the SDSS survey using the SINFONI IFU as illustrated on Figure 2. Given that SINFONI has a small FOV of only 8 arcsec × 8 arcsec, one has to select the quasar sight-lines with absorbers that have the highest chance to be associated with a galaxy at small impact parameter, i.e. to lie within the FOV. Thanks to the well-known anti-correlation between the Mg ii rest-equivalent width and impact parameter (Lanzetta & Bowen 1990; Steidel 1995), the strongest absorbers are the most likely to be associated with a galaxy at a small (of a few arcsec) impact parameter. This selection criteria became the basis for the SINFONI Mg ii Program for Line Emitters (SIMPLE; Bouché et al. 2007, Bouché et al. 2012; Schroetter et al. 2015).
 |
Figure 2. Illustration of the advantage in observing quasar fields with IFUs. A line emitter can easily be detected at any position in the field of view by selecting the wavelength slice of the hyper-spectral cube corresponding to the expected redshift of the absorber. |
2.2. Measuring the Gas Accretion Rate
Suppose one finds a galaxy with a background quasar within 15-30 kpc of a galaxy, but more importantly, a quasar whose apparent location is aligned with the galaxy's major axis as illustrated on Figure 1. This geometrical configuration is ideal to study the properties of “cold-flow-disks” which are created by the global accretion process (or processes) as discussed earlier.
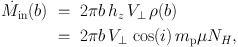
The gas accretion rate can be estimated if one approximates the gaseous
structure as a short cylinder of radius b and height
hz which has mass density ρ(b) at the
location of the quasar sight-lines, i.e. at the impact parameter
b. As the cylinder is intercepted by the quasar line-of-sight at
the impact parameter b, the accretion flux
 in through
the inner surface of area A = 2π b
hz can be estimated from mass conservation argument,
yielding the following equation:
in through
the inner surface of area A = 2π b
hz can be estimated from mass conservation argument,
yielding the following equation:
 |
(2) |
where V⊥ is the radial flow velocity (perpendicular to the surface A), i is the inclination of the structure, Nh is the total gas column, µ is the mean molecular weight, mp is the proton mass, and the second line uses the identity mp µ Nh = ∫ dz ρ(b) = ρ(b) hz / cosi. This equation can be used to estimate accretion rates of gaseous inflows in the close vicinity of galaxies as probed by quasar lines-of-sight.
1 α is defined as the angle between the galaxy major-axis and the apparent quasar location. Back.