


In this section, I discuss example results from the recent IFU surveys that have led to the first constraints on the accretion rates of fresh gas around star-forming galaxies. Before discussing detailed results, I list here several of the key surveys of quasar sight-lines with IFUs. These are
In contrast to the SINFONI surveys where one can only target a single system at a time and have yielded about two dozens galaxy-quasar pairs, the MUSE survey will yield about 80 to 100 galaxy-quasar pairs thanks to the large wavelength range of the MUSE instrument (4800 < λ < 9300Å).
3.1. Case Study 1: HE2243 at z = 2.32
From a sample of galaxy-quasar pairs, one needs to select suitable pairs for the study of accretion. From Figure 1 one sees that the galaxy should not be seen face-on and that the quasar apparent location should be aligned with the galaxy major-axis. From the z2SIMPLE survey (Bouché et al. 2012), one star-forming galaxy associated with a z = 2.32 Mg ii system is located just 26 kpc from the quasar line-of-sight of HE2243−60 2. The background quasar whose apparent location on the sky is fortuitously aligned with the galaxy's projected major-axis, makes this galaxy-quasar pair an excellent candidate to test the predictions from cosmological simulations (Stewart et al. 2011a, 2016).
Not only IFUs are excellent tools to identify the host galaxy, but also, such observations directly yield the galaxy star-formation rate, the galaxy kinematics and the galaxy's orientation with respect to the quasar sight-line. In this case, the galaxy has a star-formation rate (SFR) of 33−11+40 M⊙ yr−1 (where M⊙ is the mass of the Sun), typical for that redshift. The kinematics of the z = 2.3285 star-forming galaxy obtained with adaptive optics (AO) assisted SINFONI (i.e. obtained with ∼ 1 kpc or 0.25 arcsec resolution) reveal that this galaxy has physical properties typical for rotationally-supported disks seen at that redshift (Förster Schreiber et al. 2006, 2009), with a maximum rotation velocity of Vmax = 150 ± 15 km s−1 determined from 3D fitting. And the apparent quasar location on the sky is only 10∘ to 20∘ from the galaxy's projected major-axis.
The kinematics of the absorbing gas along the line-of-sight give clues about the nature of the gas, which were observed with the VLT spectrograph UVES. A direct comparison between the absorbing gas kinematics with respect to the galaxy emission kinematics, reveal that the gas seen in absorption 26 kpc from the galaxy — corresponding to 7 times the half-light radius R1/2 = 3.6 kpc or one third of the virial size of the halo Rvir — is moving in the same direction as the galaxy rotation; i.e. the gas appears to be co-rotating. The comparison is shown in Figure 3 where panel (a) shows the galaxy emission kinematics as recovered from the IFU data, and panel (b) shows absorbing gas kinematics measured from the absorption lines in the UVES spectra. One can see that all of the low-ionization ions Zn ii, Cr ii, Fe ii and Si ii tracing the cold gas show redshifted velocities and the observed velocity field of this galaxy also shows redshifted velocities in the direction of the quasar location. Hence, the absorbing gas appears to be “co-rotating” with the host, meaning that it rotates in the same direction.
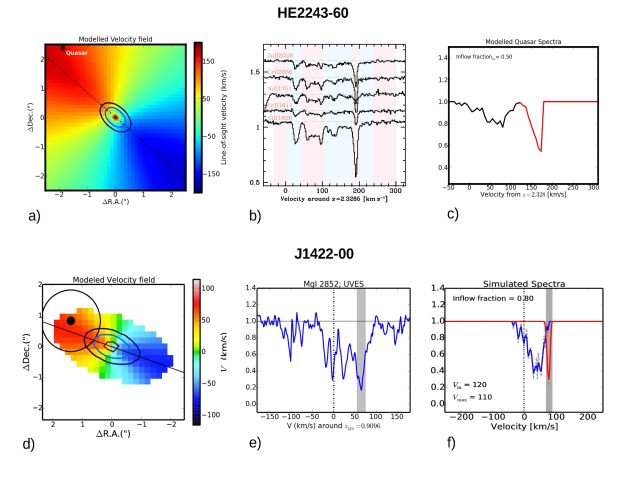 |
Figure 3. Panels a, b and c show, for the HE2243−60 galaxy-quasar pair, the galaxy kinematics, the gas kinematics at the quasar location, and the modeled kinematics, respectively. The disk kinematics (with circular orbits) is shown in red while the gas inflow model is shown in black. Panels (d) (e) (f) are for the J1422−00 pair. |
However, while the sign of the kinematic shifts agrees, the amplitude of the kinematic differences does not agree entirely. Only a fraction of the velocities seen in absorption are in agreement with those seen in emission from the galaxy (extrapolated at the location of the quasar). This would indicate that a simple rotating disk with circular orbits and a normal (flat) rotation curve can account only for some fraction of the absorbing gas kinematics. The other components have a line-of-sight velocity less than the rotation speed, indicating that this gas is not rotationally supported. In other words, the second group of components is offset by about 100 km s−1 from the rotation pattern; hence cannot be gravitationally supported and therefore should be flowing in.
In order to estimate the accretion rate from these observations, one needs estimates of the gas column density and of the inflow speed. A detailed analysis of the metal column densities in each of the components (Bouché et al. 2013) indicate that each of these two groups contain about half of the total H i column logNHi ≃ 20.6. Using a simple geometrical toy model of accretion —where “particles” representing gas clouds or absorption components are distributed in an extended disk configuration as in Figure 1 — with cloud kinematics reflecting an inflowing (radial) gas flow, one can generate simulated absorption profiles which can then be compared to the observed absorption profile. Because the relative galaxy orientation is well determined by the VLT/SINFONI data, the only free parameter is the inflow speed which is found to be ∼ 200 km s−1. Figure 3(c) shows the modeled kinematics with the disk component shown in red, and the inflow component shown in black.
Using the constraints on Vin and on
NHi from
the line-of-sight kinematic shift between the SINFONI and UVES datasets,
the estimated accretion rates estimated from Equation 2 is 30 to 60
M⊙ yr−1
given the uncertainties in the column density and inflow speed.
The range of accretion rates, 30 to 60 M⊙
yr−1, is found to be similar to the galaxy's SFR of
∼ 33−11+40 M⊙
yr−1, in agreement with the simplest arguments for
galaxy growth given in § 1.
Furthermore, for this galaxy's halo mass, Mh ∼
4 × 10¹¹ M⊙
(assuming Vmax ∼ Vcirc), the
maximum baryonic accretion rate is fB
 h ≈
40 M⊙ yr−1
(Genel et al. 2008;
Dekel et al. 2013),
which implies an accretion efficiency єin
in Equation 1 of ∼ 100% regardless of the value for the wind
loading factor η.
h ≈
40 M⊙ yr−1
(Genel et al. 2008;
Dekel et al. 2013),
which implies an accretion efficiency єin
in Equation 1 of ∼ 100% regardless of the value for the wind
loading factor η.
3.2. Case Study 2: J1422 at z = 0.91
From the SIMPLE survey (Bouché et al. 2007) consisting of 14 galaxies found around strong z ∼ 0.8–1.0 Mg ii absorbers selected from the Sloan Digital Sky Survey (SDSS) database with rest-frame equivalent widths Wrλ2796 > 2 Å, two have the galaxy's major-axis roughly aligned with the quasar apparent location among the galaxies that are not seen face-on (with an inclination > 30∘) as shown in Schroetter et al. (2015). One of these two is the z = 0.9096 quasar–galaxy pair towards the quasar SDSS J142253.31−000149 (hereafter SDSS J1422−00), where the galaxy's major-axis is about 15∘ from quasar-galaxy orientation. This is — as already mentioned — the most favorable configuration to look for the kinematic signatures of gas inflows (Figure 1).
The J1422−00 quasar field was also observed with
the MUSE IFU
(Bouché et al. 2016),
yielding [O ii] and
H β fluxes in addition to the H α, and
[N ii] fluxes from
SINFONI. Incidentally, the MUSE observations show that there are
no companion down to 0.22 M⊙ yr−1 (5
σ) within 240 h−1 kpc (30 arcsec).
Combining H α,
[O ii] fluxes from SINFONI
and MUSE observations, the galaxy has a SFR of 4.7 ± 2.0
M⊙ yr−1
(Bouché et al. 2016),
an a metallicity of 12 + logO/H = 8.7 ± 0.2.
Figure 3 shows the galaxy kinematics which yield
a maximum velocity Vmax = 110 ± 10 km
s−1, corresponding to a halo mass of
Mh ≈ 2 × 10¹¹
M⊙, corresponding to a 0.1 L⋆
galaxy. For such a halo mass, the average baryonic accretion rate is
fB
h ≈
4 M⊙ yr−1.
The H i gas column density
associated with this 3.2Å
Mg ii absorber is log
N(H i) ≃
20.4, measured from a Hubble Space Telescope/COS G230L spectra.
Using a high-resolution spectrum (UVES) of the background quasar,
Bouché et al. (2016)
found that
the gas kinematics traced by low-ionization lines
(Mgas, Zn, Fe, Al) show distinct signatures consistent
with those expected for a “cold-flow disk”.
Indeed, the absorption profile consists of a component that follows the
expected (projected) rotation speed, at +60 km s−1,
with several sub-components that are offset kinematically as shown in
Figure 3(b)
Using a similar geometrical model as in § 3.1,
the absorption kinematics data are
consistent with a radial inflow speed of Vin ≈
100 km s−1, when comparing the data (panel e) and the
model (panel f) in Figure 3.
With such an inflow velocity, one can estimate the mass flux rate
in to be
at least two to three times larger than the SFR
using Equation 2.
Interestingly, this galaxy also shows evidence for a galactic wind from
the blueshifted (by vout = − 80 ± 15 km
s −1) low-ionization absorption lines
(Mg ii and
Fe ii) in the galaxy
spectrum. The estimated mass outflow rate is about 0.5–5
M⊙ yr−1 (i.e. a loading factor
η ≤ 1), and currently, this is the only galaxy with
simultaneous constraints on the gas outflow and inflow rates.
With a constraint on the outflow rate and the loading factor, one can
better estimate the efficiency of baryonic accretion
єin using Eq. 1. Together these numbers imply that the
factor (1 + R + η) in Eq. 1 is (1 + R + η)
× SFR is 5 to 8 M⊙ yr−1.
As mentioned, for this galaxy halo mass, the average baryonic
accretion rate is estimated to be fB
h ≈
4 M⊙ yr−1 using the theoretical
expectation for the DM accretion rate from
Genel et al. (2008) or
Birnboim et al. (2007).
Putting it together, the accretion efficiency is high at
єin ≈ 1.0 (regardless of the loading factor
η) in agreement with the theoretical expectation of
Dekel & Birnboim (2006).
It is important to keep in mind that our measurements on inflow and
outflow rates are instantaneous quantities, while this baryonic estimate
is time averaged, or averaged for populations of galaxies.
3.2.1. Implications for angular momentum
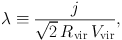
A critical question for these gaseous disks around star-forming galaxies is how much angular momentum they carry as discussed in Stewart et al. (2013) and Danovich et al. (2015). Here, we recall the common relation between the specific angular momentum j ≡ J/M and the spin parameter taken from Bullock et al. (2001), which is
 |
(3) |
where Rvir and Vvir are the halo virial radius and virial circular velocity.
The host galaxy is estimated by Bouché et al. (2016) to have λgal to be 0.04–0.05, using the the relation between disk scale length Rd and the disk spin λ parameter from Mo et al. (1998). But the angular momentum of the ‘cold-flow disk' is harder to estimate without a direct size constraint, but one can place useful limits using the minimum radius given by the impact parameter. Doing so, the spin parameter of the cold-flow disk λcfd is estimated to be λcfd > 0.06, i.e. 50% larger than that of the galaxy. This limit on the cold-flow disk angular momentum is consistent with the theoretical expectation of Danovich et al. (2015), where the baryons within 0.3 Rvir have 2–3 times the galaxy angular momentum.
When discussing gas inflows around galaxies, one naturally wonders whether the accreting material has a metallicity of ‘pristine' IGM gas (i.e. log Z / Z⊙ = −2). Naturally, estimates of the gas metallicity requires a H i column density measurement in addition to gas phase column densities for the metallic ions. For both of the cases discussed in this section, the H i column density could be determined directly from either a UVES optical spectrum or a COS UV-spectrum.
In both cases, the metallicity of the absorbing gas is estimated to be much higher than the IGM metallicity of log Z / Z⊙ = −2 for fresh infall, implying a significant amount of recycling. Indeed, the absorbing gas metallicity is estimated to be −0.72 ± 0.04 and −0.4 ± 0.4 for HE2243−60 and J1422−00, respectively. Though, in both cases, the host galaxy ISM metallicity — measured from its nebular lines — is somewhat higher than the absorbing gas, at 1/2 Z⊙ and Z⊙, respectively. Hence, one can conclude from these studies that the gas accretion is already enriched from significant recycling, but is lower than the metallicity of the ISM by about a factor of two.
3.3. Case Study 3: H I selection
Because a selection using metal lines inevitably leads to a bias in the selection of absorption line systems, C. Proux and her collaborators have led several studies using H i-selected absorbers, i.e. Damped Ly α absorbers (DLAs) with H i column densities greater than 2 × 1020 cm−2, and sub-DLAs with H i column densities between 1019 and 1020 cm−2. The advantage of the H i-selection is that it bypass the biases present in metal line selections. The disadvantage of this technique is that the success rate in detecting the host galaxy is much lower.
Using the IFU SINFONI, out of a large survey of 30 H i systems, only 6 were detected (Péroux et al. 2011; 2012, 2013, 2014, 2017). Out of these 6 detections they find evidence for the presence of outflows in two systems, while three are consistent with gas accretion and the remaining case is poorly constrained.
Such sample will prove important in order to compare the gas metallicity seen along the quasar line-of-sight with the metallicity of the host as described in Péroux et al. (2016). At the moment, the situation is unclear and large samples are required.
2 This system is also a damped Lyman absorber (DLA; Lopez et al. 2002) with a column density of logNH i = 20.6. Back.