


As already mentioned, it is possible, with the help of modern telescopes, to resolve a number of nebulae. wholly or partially, into single stars. In the great Nebula in Andromeda, for example, a great number of individual stars have been observed. Recently also globular star clusters have been discovered in this nebula, similar to those which lie within our own Milky Way. The fortuitious fact of the observability of individual stars in nebulae opens two ways to determine their distances.
A) Distance Determination with the help of the Period-Brightness Relationship for Cepheids.
Cepheids are stars the brightness of which varies periodically with time. Periods are usually in the range of one up to sixty days. The absolute magnitude is a unique function of period, a function which has been determined for the stars of our own system [Milky Way]. If the period is known, it is therefore possible to derive the absolute magnitude of these cepheids from this relationship. If, in addition to that, one determines the apparent magnitude, and compares it with the absolute magnitude, one immediately obtains the distance of the stars. Quite a few cepheids have been observed in the Andromeda nebula. Based on these, the distance and diameter of Andromeda was determined to be 900,000 and 42,000 light-years, respectively. For comparison, it is important to remember that our own system has a diameter the upper limit of which is estimated to be about 100,000 light years. The distances of eight other nebulae have been found in the same way. In nebulae more distant than a few million light years, individual cepheids cannot be resolved. To determine their distance other methods must therefore be devised.
B) Statistics of the brightest stars of a nebula
This method is based on the assumption that in the extragalactic stellar systems the relative frequency of the absolute magnitude of stars is the same as in our own system. The experience with the previously examined neighboring systems is in fact in accordance with this assumption. The absolute magnitude of the brightest stars in our own and neighboring systems turns out to be -6.1 on average, with a dispersion of less than half a magnitude. We just note that similar distance determinations were obtained with the help of novae.
C) Distance determination of nebulae using their total apparent magnitude.
With the help of the first two methods, the distances of about sixty extragalactic nebulae have been found. From the measured apparent brightness and the known distance of these nebulae we can immediately infer their absolute brightness. In this way we obtain the following distribution curve (Fig. 1).
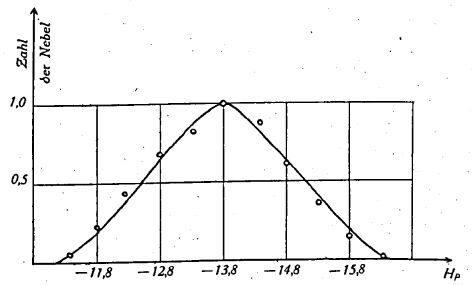 |
Figure 1. HP = absolute photographic magnitude (Y axis: number of nebulae). |
The average absolute visual magnitude of the nebulae is -14.9 with a dispersion of about five magnitudes and a half-width of the distribution curve of about two magnitudes. This dispersion is unfortunately too big to allow an exact determination of the distance to an individual nebula from its apparent brightness and the distribution curve of absolute magnitudes. We shall discuss later how it is still possible to determine the distance to certain individual nebulae with great accuracy. However, the following fact allows us to find the distance of a large number of extremely faint nebulae. As already mentioned, nebulae often group themselves in dense clusters, which contain from 100 to 1000 individuals. It is of course extremely likely that such an apparent accumulation of nebulae is also a real accumulation in space, and that therefore all these nebulae are located at approximately the same distance. It is relatively easy to determine the distribution curve of apparent magnitudes of the nebulae of a cluster. This distribution curve is virtually the same as the distribution curve of the absolute magnitudes of the sixty nebulae, whose distances have been found under (A) and (B). This proves that the apparent accumulation of nebulae [on the sky] corresponds to a real dense swarm in outer space. A comparison of mean apparent brightness of the nebulae in the cluster with the mean absolute magnitude of -14.9 immediately yields the distance of the cluster. The distances of the following clusters of nebulae were determined in this way.
| Coma-Virgo | 6 |
| Pegasus | 23.6 |
| Pisces | 22.8 |
| Cancer | 29.3 |
| Perseus | 36 |
| Coma | 45 |
| Ursa Major I | 72 |
| Leo | 104 |
| Gemini | 135 |
The number of nebulae per unit volume in one of these dense swarms is at least a hundred times greater than the corresponding average number of individual nebulae dispersed in space.
It is of interest to include here some brief comments regarding other features of nebulae which are accessible to research with the help of the 100-inch telescope.
With regard to the structure of the Universe, first and foremost is the question whether the distribution of nebulae over space is uniform or not. In the case of uniformity we expect the number of nebulae in a spherical shell of radius r and constant thickness dr to be proportional to r2, provided that we are dealing with a Euclidean space. This expectation actually corresponds very accurately to reality, i.e. for that part of the Universe within reach of the 100-inch telescope. This does not mean, of course, that space may not eventually turn out as non-euclidian, once we are able to penetrate farther in space.
We must not fail to mention that the above conclusions are only valid in case that absorption and scattering of light in space may be ignored. The finding of a uniform distribution of nebulae to the largest achievable distances with a method that assumes the practical lack of absorption and scattering, is in fact by itself almost a proof for the correctness of this assumption. Indeed, an actually existing uniform distribution of nebulae would be biased by absorption, in such a way that the number of nebulae in spherical shells of constant thickness would increase more weakly with distance than r2, and eventually even decrease. In view of the fact that gases and clumps of dust can be proven to exist in interstellar space of our system [Milky Way], it would nevertheless be of great importance to have an independent proof of the transparency of intergalactic space, and to show that it is not the curvature of space, combined with absorption and scattering, that would feign a uniform distribution of the nebulae. A statistical study of the apparent diameters of nebulae would, for example, serve this purpose.
Theoretically, the presence of intergalactic matter should correspond to the vapor pressure of the extant star systems. Assuming that the Universe has reached a steady state, it is possible to estimate this pressure (F. Zwicky, Proc. of the Nat. Academy of Sci., vol. 14, p. 592, 1928). It turns out to be extremely small and would practically exclude the detection of interagalactic [The German original says "intragalactic", but the translator supposed that this was a typographical error] matter.
Another interesting question is related to the spectral types of nebulae. Most extragalactic nebulae possess absorption spectra similar to that of the Sun with strong salient H and K lines of calcium and an intense G-band of Ti (4308 Å), Fe (4308 Å) and Ca (4308 Å). Therefore, nebulae belong to the spectral type G. The spectral type is independent of the distance, as far as current observations reach out. A distance-dependent displacement of the total spectrum will be discussed later. The width of the absorption lines is usually several Angstroms and is also independent of the distance.
A small percentage of the observed nebulae also show emission lines (Nebulium), usually originating in the core region of the nebulae. Unfortunately very little is known as yet about the physical conditions in such systems.
Thirdly, it is of importance to investigate the relative frequency of the already mentioned different forms of nebulae. The statistical distribution is approximately 74% spirals, 23% spherical nebulae, and about 3% show an irregular appearance.
Fourthly, I would like to mention the determination of the brightness distribution within a single nebula. This investigation has been undertaken recently by E. Hubble at Mt. Wilson. Hubble obtains the following preliminary result. The brightness can be expressed as a universal function L(r, α), where r is the distance from the center of the nebula, and α is an appropriate parameter. By varying α, one can reduce the brightness distributions in all nebulae with great accuracy (approximately 1%) to the same function, in fact up to values of r, for which the brightness has fallen to 1/1000 of that of the centre. It is also of importance with respect to the practical lack of absorption and scattering in intergalactic space, that the distribution function of the α's of the different nebulae is independent of distance. Incidentally, we mention that L coincides with the function that corresponds to the brightness distribution in an isothermal Emden gas sphere.
Fifth, it is of enormous importance that the nebulae at a great distance show redshifted spectra, where the shift increases with distance. The discussion of the so-called redshift is the main topic of the present work.