


V. M. Slipher at the Observatory in Flagstaff, Arizona, was the first to observe that some nebulae show shifts of their spectra, which correspond to a Doppler effect of up to 1800 km/s. However, Slipher did not establish any relationship between redshift and distance. Such a relationship was first suspected by G. Strömberg (1925, ApJ 61, 353-388) upon his study of the speed of the Sun relative to more and more distant objects. He found that the mean velocity of the Sun, relative to the system of neighboring nebulae, is large, of the order of 500 km/s, and that the group of the nebulae used shows an expansion which seems to depend on the distance of the individual nebula.
Since at the time of Strömberg's research no reliable distance determination of the nebula was known, K. Lundmark attempted to relate the observed high velocities with the compactness of the photographic images of the nebula. This proved later as an attempt in the right direction. Nevertheless, the attempt remained unsuccessful, as it turned out that the apparent diameter of nebulae at the same distance exhibit large variations.
E. Hubble worked at Mt. Wilson in the same direction. First he also tried to relate the redshift to the apparent concentration of the nebula. Herein he set out from the idea that the redshift would correspond to the well-known Einstein effect. However, it turned out that it was not possible to uncover sensible relationships in this way.
Consequently, E. Hubble tried to relate the redshift with the distance of the different nebulae. This attempt, as is well known, has since been of great success. The nebulae which were available initially for such an investigation, had distances from one up to six million light years. The discussion of all data showed a linear relationship between redshift and the distance, with the result that the redshift correspondeds to an apparent recession velocity of 500 km/s per one million parsec (1 parsec equal to approximately 3.26 light years). The dispersion was however relatively large, as for example the neighboring Andromeda Galaxy has a violet shift of approx. 200 km/s, i.e. is either seemingly or really moving towards us. Despite this, it was found later that this spectral shift, calculated for the first time, was an extremely good one. The best proof of the amazing care of Hubble's method of work is perhaps, that on the basis of the above relationship up to now he could predict the redshifts in each case to within a few percent, and in fact for distances up to thirty times higher that those of the initially used [sample of nebulae].
The difficulty in photographing the spectra of very distant nebulae lies in the need of extremely long exposure times. Indeed it was necessary to expose plates up to fifty hours and more, and it seemed hardly possible to penetrate further into space with this method. In more recent times great progress has been made by using a spectrograph, the camera lens of which has a focal ratio of f/0.6. However, with this one had to sacrifice a lot in the dispersion, and the spectra obtained are only about 2 millimeters long. However, the exposure times could be shortened to a few hours. Nevertheless, it does not seem possible to penetrate farther into space than about 200 million light years. The reason for this lies partly in the location of the 100-inch telescope in the vicinity of the large city of Los Angeles, since the illumination of the night sky and the associated strong light scattering into the telescope unfortunately limits the astronomical observations on Mt. Wilson, to a level below the actual performance of the telescope. For the 200-inch telescope, currently under construction for the California Institute of Technology, a more suitable location will therefore have to be selected.
The redshifts of various clusters of nebulae, expressed as apparent Doppler recession velocities, are put together in the following Table 2.
| Cluster of nebulae | Number of nebulae in the cluster | Apparent diameter, in degrees | Distance in 106 light years | Average velocity, in km/s |
| Virgo | (500) | 12 | 6 | 890 |
| Pegasus | 100 | 1 | 23.6 | 3810 |
| Pisces | 20 | 0.5 | 22.8 | 4630 |
| Cancer | 150 | 1.5 | 29.3 | 4820 |
| Perseus | 500 | 2.5 | 36 | 5230 |
| Coma | 800 | 1.7 | 45 | 7500 |
| Ursa Major I | 300 | 0.7 | 72 | 11800 |
| Leo | 400 | 0.6 | 104 | 19600 |
| Gemini | (300) | - | 135 | 23500 |
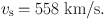
| These results are graphed in Fig. 2. | ||||
| (see E. Hubble and M. L. Humason, ApJ 74, 43, 1931. In this work, also the most essential bibliography may be found.) | ||||
It follows from this compilation that extragalactic nebulae have velocities which are proportional to their distance. The specific velocity, per million parsec, is
 |
(1) |
The redshift of each individual nebula is on average based on the mean shifts of at least three spectral lines. These are usually the H- and K-lines, the G-band (λ = 4303 Å), and occasionally one of the lines Hδ (4101 Å), Hγ (4340 Å), Fe (4384 Å) and Hβ (4861 Å). The uncertainty in the redshift of the cluster of nebulae in Leo results in this way for example, as
 |
The various absorption lines suffer the same relative shift, just as expected for the Doppler effect. Thus we have for a certain nebula:
 |
(2) |
regardless of the wavelength, λ, and conveniently the shift may be expressed, as we have done, in velocity units. The same value of K therefore also applies to the shift of the maximum of the continuous emission spectrum.
 |
Figure 2. |
It must be borne in mind that Fig. 1 lists the mean Doppler velocity of clusters of nebulae. This speed is the average of the values of several individual nebulae (from 2 to 9) in each cluster. It is of great importance for the theory of the effects discussed here, that the velocities of the individual members of a cluster can deviate from the mean. In the Coma cluster, for example, which until now is the best investigated, the following individual values have been measured.
| Apparent velocities in the Coma cluster | |
| v = 8500 km/s | 6000 km/s |
| 7900 | 6700 |
| 7600 | 6600 |
| 7000 | 5100(?) |
It is possible that the last value of 5100 km/s corresponds to a field nebula which does not belong to the Coma system, but is only projected on to it. The probability of this assumption is however not very large (1/16). Even if we omit the nebula, the variations in the Coma system still remain very large. In this context it is of interest, to remind the reader that the average density in the Coma cluster is the largest so far observed.
Now, since the relationship between the distance and the redshift is known, we can use the relation to infer the distances of individual nebulae, if their redshifts are spectroscopically measured. Also, we can use it as an independent check of the reliability of the above-mentioned methods of distance determination. To do this, in fact we only need the brightness distribution of all individual nebulae of the same redshift. This new distribution curve must agree with that of Fig. 1, if our original distance determination were correct. This is in fact very approximately the case.
As mentioned above, the redshift means a shift of the entire emission spectrum of the nebula. In addition to the diminution of the apparent photographic magnitude in geometric dependence on the distance, there is still another faintening effect caused by the redshift. The problem of the spatial distribution of the nebulae at large distances is thus not just closely linked with the curvature and absorption of space, but also with the redshift which complicates the whole situation very much.
In the end we must mention some results of van Maanen, which appear to be in contrast with Hubble's determination of distances. Over a period of about twenty years, van Maanen has measured apparent movements (in angular units) of nebulae on the celestial sphere. Since the corresponding angular velocities of the nearest nebulae amount to only about 0.01 arcseconds per year, only nebulae with well-defined, star-like "nuclei" are useful for this purpose, as otherwise the definition of coordinates of the nebula is more difficult due to the blurryness of its photographic image. If one combines van Maanen's angular velocities with Hubble's distances, one obtains extremely high velocities. For NGC 4051, which according to Hubble is located at a distance of 4 million light years, and has an apparent radial velocity of 650 km/s, van Maanen measures an angular velocity of 0.015" per year, which results in a real velocity of 94,000 km/s. This constitutes a big problem. A trivial solution which does not appear impossible from the outset, may be that van Maanen's observed motions do not originate in the nebula, but may be attributed to the reference system used for the stellar background. It must be emphasized however that van Maanen has found similar discrepancies for 13 nebulae. Another result was that all these nebulae appear to move away from the pole of the Milky Way, which seems hard to explain with a movement of the reference system.
Equally important is van Maanen's determination of the rotation of extragalactic spiral nebulae. For Messier 33, according to Hubble at a distance of 900,000 light years, van Maanen observed, superimposed on the above mentioned transversal movement, a rotation of the entire nebula, the components of which for individual objects range from 0.012" up to 0.024" per year. With the mentioned distance, rotation speeds of about 33,000 km/sec result, while e.g. F.G. Pease measured for NGC 4594 from the Doppler effect at both ends of its diameter a rotation of only 800 km/s. [For Messier 33 itself the observations are not yet completed. However, the rotational velocities are only about 50 km/s.]
If one does not ascribe van Maanen's results to observational errors, but takes these as characteristic of the nebula itself, and one is not ready to drop Hubble's distance determinations, one is facing a serious problem.