
| © CAMBRIDGE UNIVERSITY PRESS 1999
| |


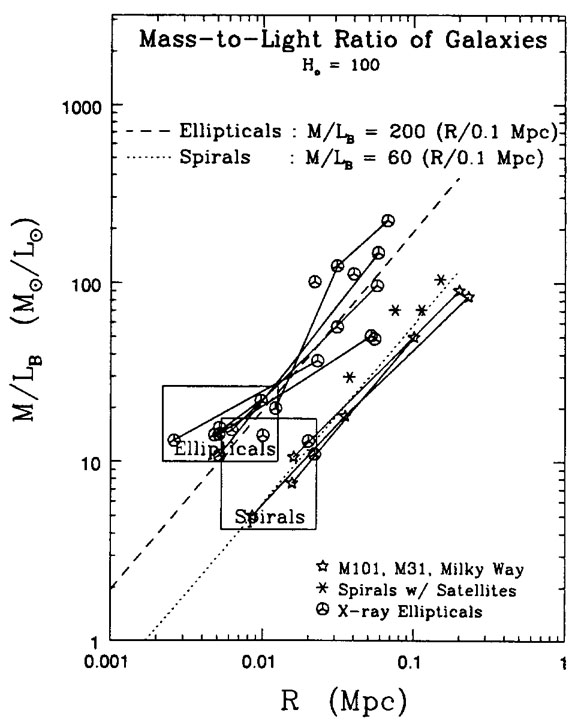
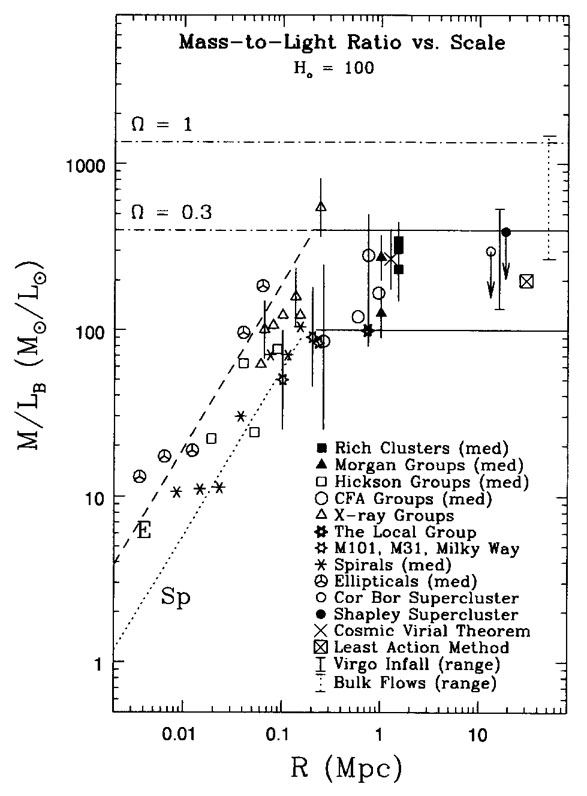
A recent analysis of the mass-to-light ratio of galaxies, groups and
clusters by
Bahcall, Lubin and Dorman
(1995)
suggests that while the M/L ratio of galaxies increases
with scale up to radii of R ~ 0.1-0.2h-1 Mpc, due
to the large dark halos around galaxies (see
Fig. 3;
also Ostriker et al. 1974), this ratio
appears to flatten and remain approximately constant for groups and
rich clusters, to scales of ~ 1.5 Mpc, and possibly even to the
larger scales of
superclusters (Fig. 4). The flattening
occurs at M/LB
 200-300h,
corresponding to
200-300h,
corresponding to
 m ~
0.2. This observation suggests that most of the dark
matter is associated with the dark halos of galaxies. Unlike previous
expectations, this result implies that
clusters do not contain a substantial amount of
additional dark matter, other
than that associated with (or torn-off from) the galaxy halos, and
the hot intracluster medium.
Bahcall et al. (1995)
suggest that the
relatively large M/LB ratio of clusters
(~ 300h) results
mainly from a high M/LB ration of elliptical/S0
galaxies. They
show (Fig. 3) that ellipticals have an
M/LB ratio
that is approximately 3 to 4 times larger than typical spirals at the
same radius
[(M/LB)s ~ 100h and
(M/LB)e ~ 400h
within r
m ~
0.2. This observation suggests that most of the dark
matter is associated with the dark halos of galaxies. Unlike previous
expectations, this result implies that
clusters do not contain a substantial amount of
additional dark matter, other
than that associated with (or torn-off from) the galaxy halos, and
the hot intracluster medium.
Bahcall et al. (1995)
suggest that the
relatively large M/LB ratio of clusters
(~ 300h) results
mainly from a high M/LB ration of elliptical/S0
galaxies. They
show (Fig. 3) that ellipticals have an
M/LB ratio
that is approximately 3 to 4 times larger than typical spirals at the
same radius
[(M/LB)s ~ 100h and
(M/LB)e ~ 400h
within r  200h-1 Kpc]. Since clusters are
dominated by elliptical and S0 galaxies, a high
M/LB ratio results.
200h-1 Kpc]. Since clusters are
dominated by elliptical and S0 galaxies, a high
M/LB ratio results.
|
Figure 3. Mass-to-light ratio of spiral and
elliptical galaxies as a function of scale
(Bahcall, Lubin and
Dorman 1995).
The large boxes
indicate the typical (~ 1 |
|
Figure 4. Composite mass-to-light ratio of
different systems - galaxies, groups, clusters, and superclusters - as a
function of scale
(Bahcall et al. 1995).
The best-fit M/LB
|
Unless the distribution
of matter is very different from the distribution of light, with
large amounts of dark matter in the "voids" or on very large
scales, the above results suggest that the mass density in the universe
may be low,
m ~ 0.2
(or m ~
0.3 for a small bias of b ~ 1.5, where the bias factor b
relates the overdensity in galaxies to the overdensity in mass:
b  (
(
 /
)gal
/ (
/
)m).
/
)gal
/ (
/
)m).
 )
range of M/LB for bright
ellipticals and spirals at their luminous (Holmberg)
radii. (LB
refers to total corrected blue luminosity; see text.) The
best-fit M/LB
)
range of M/LB for bright
ellipticals and spirals at their luminous (Holmberg)
radii. (LB
refers to total corrected blue luminosity; see text.) The
best-fit M/LB
 R lines are
shown.
R lines are
shown.