

The FOS field of view during our parallel observations is determined by the WFPC2 coordinates and the roll angle of the telescope, which we carefully specified. Ground based images taken with the Swope 1 meter telescope at Las Campanas Observatory were used to assure that the FOS field of view was free of detectable sources brighter than V = 25 AB mag.
Based on calculations using an early version of the FOS exposure-time calculator, the FOS/RED was used in parallel observing mode and configured with the 1.0-PAIR aperture and the G570H disperser during our October visit, producing spectra with ~ 4.5Å resolution from 4500 to 6800Å. No exposures were taken during transits of the South Atlantic Anomoly. These data were intended to provide a measurement of the ZL by the method outlined in Section 2.2, but the count rate from the sky in this configuration was comparable to the instrument dark rate (~ 0.01 DN/sec per diode). Accordingly, the FOS observations during the November and December 1995 visits used the FOS/RED, A-1 aperture (3.66 × 3.71 arcsec2), and G650L disperser, which provided spectra with ~ 12 diodes (~ 300Å) per resolution element for an aperture-filling source (25Å per resolution element for a point source) from 3800-7000Å and a signal-to-noise ratio of almost 20 for the night sky. While narrow-band imaging as such is not useful for measuring the ZL flux by its spectral features, these data do provide better spectral resolution than WFPC2 images, and a second, independent measurement of the total background. We limit our discussion to the data from the November and December visits. One 1300 sec FOS exposure was obtained per orbit during these visits, executing within the time-span of the 1800 sec WFPC2 observations to avoid conflicts in writing the data to on-board recorders.
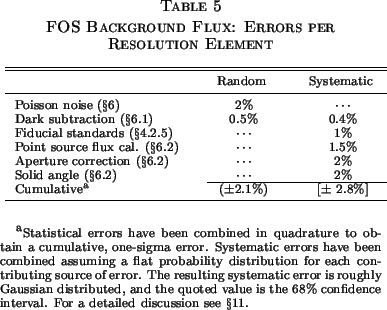
Many of the pipeline calibration procedures (described thoroughly in the HST Data Handbook) contribute negligible errors for our purposes and were adopted directly. In order of their application, the pipeline procedures used include the conversion from counts to count-rate (CNT_CORR), flat fielding (FLT_CORR), wavelength calibration (WAV_CORR), and flux calibration (AIS_CORR, APR_CORR, and TIM_CORR). The A-1 aperture defines the throughput standard for other apertures, so that the relative correction (APR_CORR) for the A-1 aperture is unity. The G650L has no observed time variation, so that the correction factor applied by the TIM_CORR procedure is also unity. We were able to improve on the dark subtraction procedure, and accordingly used our own methods for that step, as described below. Unfortunately, much of the information needed to obtain accurate surface photometry with the FOS, namely the solid angle of the apertures and PSF of the instrument, has never been provided by STScI. We have therefore supplemented the pipeline calibration with an explicit measurement of the PSF of the instrument. The final flux calibration has a systematic uncertainty of 4.5%. Errors at each step in the calibration are summarized in Table 5, with the total systematic error tabulated as described in Section 5. Below, we summarize the calibration of the FOS data and briefly discuss the results. Greater detail can be found in Bernstein (1998). Once again, the following section is intended for readers who are interested in the details of the data analysis.
