


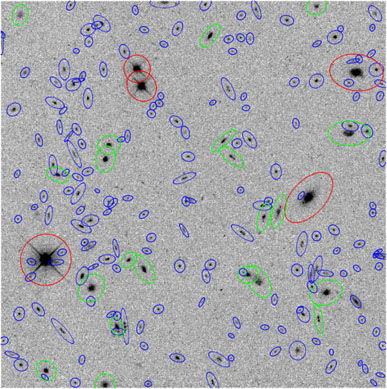
After calibration, we measure the total background signal by simply taking the average of the detected flux per pixel, excluding pixels which fall into any of the following three categories: those flagged as bad in the data quality file for any reason (see WFPC2 Data Handbook V3.0), those within two pixels of a cosmic ray event, or those within the masked region associated with a star or galaxy brighter than V555 = 23 A B mag, as described in the previous section. We show the masked regions in Figures 10 - 12, for each of the WF chips. Masks were defined based only on the F555W images; the same object masks were applied to all three bandpasses. The detected EBL at all wavelengths is therefore defined by contributions from the same sources.
|
Figure 10. Combined F555W WF2 image. North
is up and
East is left. The ellipses indicate the region extending to 4 ×
the isophotal detection radius, as discussed in
Section 10.
Red ellipses mark galaxies with V555
|
|
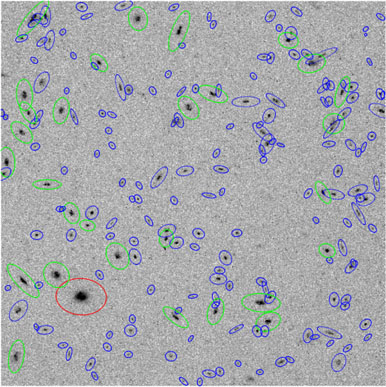
Figure 11. Combined F555W WF3 image. North is up and East is left. Ellipses are as in Figure 10. |
|
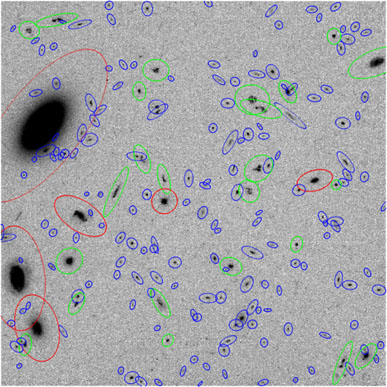
Figure 12. Combined F555W WF4 image. North is up and East is left. Ellipses are as in Figure 10. |
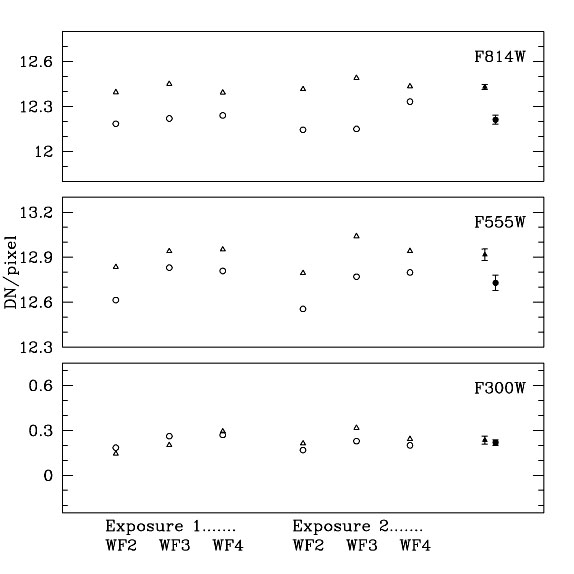
Each WF image from each 1800sec exposure produces a measurement of the mean background. We have averaged the six measurements from each visit to obtain a single background measurement from each visit. The results for the November and December 1995 visits are compared in Figure 13 to illustrate the change in background due to the geometric path length through the IPD, and thus the difference in ZL contribution during the two sets of observations. The same modulation in background flux was identified in the FOS data between November and December 1995, as discussed in Section 7. The predicted change from October to November is of order 10%. However, as there are no FOS or ground-based measurements in October, the interpretation of the modulation as a change in ZL is not conclusive for that epoch. We do not include the PC data in the final average because the dark subtraction is least accurate for that chip due to the smaller pixels and higher dark current (see Section 4.2.2), and because the field of view of the PC is a negligible increase over that of the other three chips. However, the PC chip gives the same result as the WF chips to within 2%, which is consistent with the variation in object distribution over the 4 chips and dark subtraction errors.
|
Figure 13. Total background detected
(DN/pixel in 1800 sec) in each of
two exposures per filter obtained in the November
( |
The error bars plotted in Figure 13 show the
statistical variation between the six measurements (three WF chips,
two exposures per filter) from each visit. This scatter is well
matched to the statistical errors that we predict based on our
assessment of the errors accrued at each stage in the data reduction
(see Table 3). Systematic errors are dominated
by the flux calibration from DN to physical units and are not shown in
the comparisons in Figure 13 as they are, of
course, identical for all points. In Figure 14
we plot the total background flux
measured in each bandpass in the November and December visits in
physical flux units (ergs s-1 cm-2 sr-1
Å-1) with statistical and random
1 errors plotted
separately. The measurements are summarized in
Table 4.
The zodiacal light spectrum is shown at
the flux level we measure in our ground-based spectrophotometry (see
Section 9) to demonstrate that background
observed from HST is clearly dominated by zodiacal light.
errors plotted
separately. The measurements are summarized in
Table 4.
The zodiacal light spectrum is shown at
the flux level we measure in our ground-based spectrophotometry (see
Section 9) to demonstrate that background
observed from HST is clearly dominated by zodiacal light.

|
Figure 14. The total sky flux detected through each of the WFPC2 filters in the November and December 1995 data sets, excluding bright galaxies (V555 < 23 A B mag). November 1995 results are indicated at the central wavelength of each filter; the December 1995 data are offset by +100Å for clarity. The dashed line shows the ZL spectrum at the appropriate flux; horizontal bars show ZL flux convolved with WFPC2 bandpass profiles. The total background detected with the FOS spectra are marked by o's and offset left (November) and right (December) of the central F555W wavelength. Error bars on all points indicate one-sigma statistical errors (see Tables 3 and 5). The floating error bars, arbitrarily plotted at 2500Å, show systematic uncertainties in the WFPC2 results at the indicated fluxes. The floating error bar at 7000Å shows the systematic uncertainty in the FOS results. Solid curves show the effective F300W, F555W, and F814W bandpass profiles. |
 23 AB mag; green
ellipses, 23 < V555
23 AB mag; green
ellipses, 23 < V555
 ) and
December (o) 1995 visits. Bright galaxies
(V555 < 23 mag),
stars, and bad pixels are excluded from this average. Filled symbols
indicate the mean for each visit with error bars showing empirical
1
) and
December (o) 1995 visits. Bright galaxies
(V555 < 23 mag),
stars, and bad pixels are excluded from this average. Filled symbols
indicate the mean for each visit with error bars showing empirical
1