


The rms scatter in our ZL solution is less than 1%. This demonstrates that statistical errors are quite small, be they a result of instrumental effects or our analysis method. Systematic uncertainties due to instrumental effects are also quite small and are straightforward to quantify (see Table 1). This is demonstrated by the fact that we obtain consistent results to within 0.3% from data taken on two different nights, independently reduced and calibrated. The uncertainties in the atmospheric scattering model described in the Appendix have been considered very carefully and we believe that the adopted uncertainties are conservative. However, the measurement presented here is obviously complex and might be effected by systematic errors which are more difficult to anticipate or quantify.
One such systematic effect might include moonlight or sunlight scattered in the atmosphere. Based on the scattering analysis in the Appendix, it is clear that scattering into the line of sight from any source, even the sun or moon, is negligible when that source is more than 14 degrees below the horizon. All of the observations in this work took place when the sun was more than 18 degrees below the horizon. Although the observations took place several days after new moon, the moon was below the horizon during all of our program observations, and below 14 degrees for all but 1 exposure. In addition, the net effect of such solar-type scattering contributions, if present, would be to increase our estimate of the zodiacal light, and consequentally to artificially decrease the value of the inferred EBL in Paper I. We do not believe that such scattering is likely to have influenced our results.
As discussed in Section 5 and 6, the contamination of solar features by airglow, while introducing a systematic error, would not introduce a stable systematic error: the flux of airglow features changes constantly through the night. The stability of our ZL solution in the eight spectral regions we have used demonstrates empirically that airglow is unlikely to have had a significant effect on our results. However, the possibility can't be ruled out and may introduce a systematic error which we cannot quantify and is not included in our estimate of the formal errors.
It is also possible that some Doppler shifting occurs in the ZL spectral features relative to the solar spectrum due to motion of the dust in the zodiacal plane. For that reason, we allowed for a shift in the central wavelength when calculating the correlation but found no measurable offset. We note, also, that the results of this method would not be affected by the slight Doppler broadening which might affect the spectral features of the ZL, because Doppler broadening will not alter the total flux across a feature. The correlation is unaffected by the saw-tooth effect of subtracting features with mismatched widths at the level of the 0.3Å Doppler broadening which is expected at the orientation of these observations (East & Reay 1984). Note also that while the resolution of the input spectra used for calculating the scattered ISL flux is lower than the resolution of our program observations (4Å versus 2.6Å), this will not affect our analysis as long as regions with width >> 4Å are used in the analysis. The smallest of our spectral regions is 15Å.
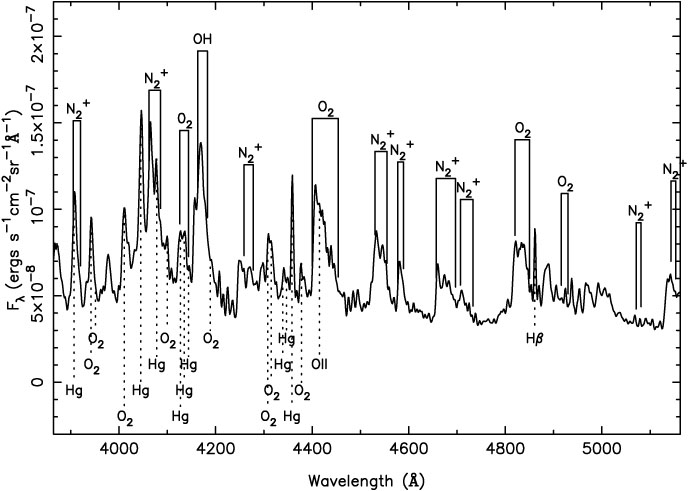
Figure 14 shows the airglow spectrum (the night sky spectrum after zodiacal light is subtracted) we obtain by this method. Emission lines from molecular rotation-vibration bands (O2, N2, H2, OH, and NO2) are labeled, as are some atomic transmission lines (O and Hg). Identification of emission features in this range of the spectrum is not complete (see Schmidtke et al. 1985, Slanger & Huestis 1981, Jones et al. 1985 and references therein).
|
Figure 14. Airglow emission lines in the observed spectrum of the night sky after zodiacal light is subtracted. Broad emission features (marked above) are molecular rotation-vibration bands of O2, N2, H2, OH, and NO2. Collisional de-excitation of these molecules contributes a continuum as well. Emission lines (marked below) are also seen in this wavelength range from atomic transitions (photoionized O and Hg). |
Finally, we note that our measurement of both the mean flux and ZL color are in very good agreement with typical values for the similar viewing geometries quoted in the literature (see the results of Levasseur-Regourd & Dumont 1980, pictured in Figure A4, and Leinert 1998).