Copyright © 1988 by Annual Reviews. All rights reserved
| Annu. Rev. Astron. Astrophys. 1988. 26:
245-294 Copyright © 1988 by Annual Reviews. All rights reserved |


1.2. Technological Prerequisites
Early surveys of galaxies over large solid angles of the sky indicated to a number of astronomers (including William and John Herschel, Lundmark, Holmberg, Shapley, Oort, de Vaucouleurs, Shane & Wirtanen, and Abell) the superclustering of galaxies, i.e. the predominant occurrence of galaxies, groups, and clusters within larger structures now called superclusters (cf. 5, 58, 92a, 113a, 128, 142, 158a, 178). Zwicky interpreted cluster cells as the space fillers of the cosmos (219a). In contrast, from independent counts of galaxies to faint magnitudes in a large number of small survey fields distributed over the sky, Hubble concluded that groups and clusters of galaxies are aggregations drawn from the general field, which is everywhere and in all directions approximately uniform (93, pp. 72, 81-82). To discriminate between these models, we need to know the three-dimensional distribution of galaxies in large homogeneous samples. To an approximation that neglects the peculiar motions of galaxies, distances can be estimated from redshifts, using the Hubble relation between redshift and distance. The observational requirement reduces to obtaining redshifts from Doppler-shifted spectral lines of the galaxies in large homogeneous samples.
In the 1920s it took several nights of observation to accumulate the
necessary exposure time for the spectrographic determination of the
redshift of a bright galaxy. By the mid-twentieth century, the
sensitivity of photographic emulsions had increased to the extent that
with the nebular spectrograph of the 36-inch Crossley reflector at the
Lick Observatory, N.U. Mayall could determine the redshift of a
luminous galaxy in the Coma cluster with an exposure of five hours. By
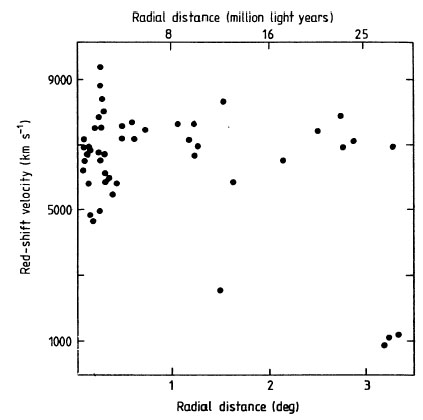
1960 Mayall had identified a homogeneous sample of 83 bright galaxies
in a field of the Coma cluster of solid angle
 33 sq deg
(116,
Figure 1),
and had measured the redshifts of 50 galaxies in this sample. Mayall's
(116,
Figure 2) plot of redshift vs. radial distance
from the center of the Coma cluster is depicted in
Figure 1. Mayall
recognized that the development of electronic photography pioneered by
A. Lallemand, in which the intensity of an image is amplified
electronically before it is recorded on a light-sensitive emulsion,
would usher in a new era of extragalactic spectroscopy
(116). By the
late 1960s, a device of this type, the Carnegie image-tube, reduced
the exposure time for each of the remaining galaxies in Mayall's
sample to 30 min, and
the redshift survey was completed
(161).
33 sq deg
(116,
Figure 1),
and had measured the redshifts of 50 galaxies in this sample. Mayall's
(116,
Figure 2) plot of redshift vs. radial distance
from the center of the Coma cluster is depicted in
Figure 1. Mayall
recognized that the development of electronic photography pioneered by
A. Lallemand, in which the intensity of an image is amplified
electronically before it is recorded on a light-sensitive emulsion,
would usher in a new era of extragalactic spectroscopy
(116). By the
late 1960s, a device of this type, the Carnegie image-tube, reduced
the exposure time for each of the remaining galaxies in Mayall's
sample to 30 min, and
the redshift survey was completed
(161).
Although electronic photographic spectroscopy reduced exposure times immensely, the spectrum of a galaxy along with the night sky was still registered on a photographic plate, and tedious hours were spent measuring the plate for final reduction with a digital computer. The Doppler velocity was derived from the measured shift of the few strongest spectral lines, and the accuracy achieved was typically ± 100 km s-1 for absorption lines and ± 50 km s-1 for emission lines (157). Early work on superclustering of galaxies (Section 1.3) was done primarily with these techniques, and the post-observation reduction time tended to limit these studies to samples of ~ 100 galaxies in regions of the sky covering only ~ 30-300 sq deg.
|
Figure 1. Doppler velocity (derived from observed redshift) vs. distance (on the sky) from the center of the Coma cluster for the 50 galaxies in the sample by Mayall (116). The Coma cluster is part of a structure that extends to > 8 Mpc (25 million lt-yr). Note the large empty region in the foreground. Adapted from Figure 2 of (116). |
Finally, in the 1970s, equipment was developed by, e.g., Shectman & Hiltner (181, and references therein) that, at the telescope, continuously subtracts off the contribution from the night sky, electronically integrates the spectrum during the exposure, and then transfers the sky-subtracted spectrum directly onto a magnetic tape for computer utilization, where the final reductions can be performed quickly and as automatically as desired. Current observational studies on superclustering of galaxies (Section 2.1) are done primarily with these electronic spectroscopic techniques and with the complementary automatic techniques provided by 21-cm spectral-line radio astronomy. With modern reduction techniques (described below) applied to the spectral data of electronic spectroscopy, Doppler velocities are derived with a typical accuracy of ± 30 km s-1 independent of the mix of absorption and emission lines in the spectrum. The techniques of 21-cm astronomy achieve typical accuracies of ± 10 km s-1 (60, 157).
The 1974 paper by Susan Simkin (183) marked a watershed between (a) the early technique of measuring the Doppler velocity of an individual galaxy from the locations of a few strong lines of a sky-contaminated spectrum and (b) the modern technique of applying Fourier transform (172) or cross-correlation (197a) techniques to obtain the Doppler velocity that provides the best match between a sky-free absorption-line spectrum and that of a well-constructed zero-redshift template spectrum. Simkin introduced the new techniques, described many of their advantages, and presented a mathematical apparatus to determine both the systemic Doppler velocity and the internal Doppler velocity dispersion of a galaxy. The accuracy achieved in a determination of the Doppler velocity of a galaxy by 21-cm and modern optical techniques (± 10-30 km s-1) permits the determination of the internal Doppler velocity dispersion of (a) individual galaxies (typically ~ 100-300 km s-1) and (b) small groups of galaxies (typically ~ 130 km s-1 (214)] (Section 4.2).