Copyright © 1988 by Annual Reviews. All rights reserved
| Annu. Rev. Astron. Astrophys. 1988. 26:
245-294 Copyright © 1988 by Annual Reviews. All rights reserved |


2.2. Indications From Distant Objects
The galaxy redshift surveys described in
Section 2.1 extend to z ~
0.1, Abell rich clusters of distance classes D
 4 extend to z ~ 0.1,
the more distant Abell clusters extend to z ~ 0.3, quasars extend
to z ~ 4, and the cosmic blackbody radiation is believed to have
originated
at z ~ 1000. These tracers with different limiting effective
redshifts
facilitate comparison of present large-scale structure with that at
epochs extending into the past up to the epoch of hydrogen
recombination following the primordial fireball
(48,
p. 371).
4 extend to z ~ 0.1,
the more distant Abell clusters extend to z ~ 0.3, quasars extend
to z ~ 4, and the cosmic blackbody radiation is believed to have
originated
at z ~ 1000. These tracers with different limiting effective
redshifts
facilitate comparison of present large-scale structure with that at
epochs extending into the past up to the epoch of hydrogen
recombination following the primordial fireball
(48,
p. 371).
2.2.1. ABELL CLUSTERS Previous reviews of this topic include Bahcall (11, 13) and Oort (128, pp. 403-8, 417-18).
In 1961, Abell
(5)
detected superclusters by visual inspection of
the surface distribution of rich clusters of galaxies listed in his
catalog (4).
A rudimentary 1976 study of superclustering among Abell clusters
(154,
155)
[which examined, for example, the
three-dimensional spatial configuration of the 27 Abell clusters of
distance classes D 2
(complete sample) with known redshifts from
Peterson (146)]
was superseded by a parallel, but more extensive and
more technically sophisticated 1982-86 analysis by N. Bahcall,
R. Soneira, and W. Burgett [which examined, for example, the
locational properties of the 104 Abell clusters of distance classes
D 4 (statistical
sample) with redshifts from Hoessel et
al. (90a)].
The Bahcall et al. study confirms the existence of
superclusters of Abell clusters and provides a list of their
membership (18).
[Locations and other properties of the superclusters
in the Northern Hemisphere are illustrated in Figure 21 of Oort
(128,
p. 406); similar but not identical memberships are depicted by the
complete-linkage dendrogram, an especially informative branching
diagrammatic representation of locational interrelations of Abell
clusters (cf.
158
and Figure 7).] The Bahcall et al. study
demonstrates that the correlation scale length (cf.
Section 3.1.2) of
the two-point correlation function of Abell clusters is ~ 50 Mpc,
i.e. five times larger than that for galaxies
(17)
[cf. (65,
148) for
evidence from independent observational studies that directly supports
this result, and cf.
(12,
25,
50,
100)
for studies that explain the
result astrophysically]. Furthermore, the study shows that if the
separation vectors of cluster pairs in superclusters are derived by
assuming that observed redshifts can be converted directly into
distances through the Hubble relation, then the average radial
(i.e. line-of-sight) component of the centroid of a pair,
<R>, tends
to be larger than the average transverse component, <T>
(19). This
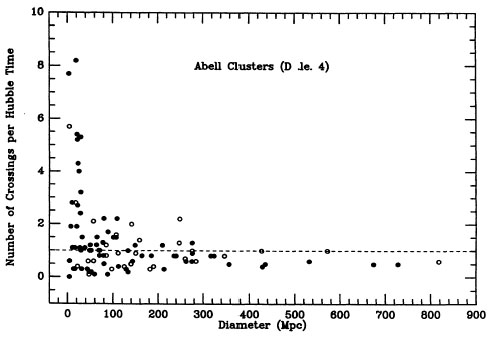
result is illustrated in Figure 8 with reference
to the dendrogram
superclusters depicted in Figure 7, and it is
most naturally
understandable as an effect of a characteristic non-Hubble relative
velocity of clusters within superclusters,
 V ~ 2000 km
s-1. This
value significantly exceeds the 600 km s-1 motion of the
Local Group
indicated by the anisotropy of the 2.75-K cosmic blackbody radiation
and causes serious problems for various cosmological models advanced
to explain large-scale structure (cf.
Section 3.2.2); therefore,
explanations in terms of observational uncertainties and elongation of
large-scale structures are also being scrutinized in extensive detail
(19).
Finally, the Bahcall et al. study demonstrates that
superclusters lie on the periphery of the Boötes void
(16) [e.g. the
Hercules supercluster lies on the near side and the Corona Borealis
supercluster lies on the far side (the reader is referred to
Figures 4,
5, and
6 for general locational
orientation)]; that a void may be
present in the three-dimensional distribution of Abell clusters, which
extends from
lll
V ~ 2000 km
s-1. This
value significantly exceeds the 600 km s-1 motion of the
Local Group
indicated by the anisotropy of the 2.75-K cosmic blackbody radiation
and causes serious problems for various cosmological models advanced
to explain large-scale structure (cf.
Section 3.2.2); therefore,
explanations in terms of observational uncertainties and elongation of
large-scale structures are also being scrutinized in extensive detail
(19).
Finally, the Bahcall et al. study demonstrates that
superclusters lie on the periphery of the Boötes void
(16) [e.g. the
Hercules supercluster lies on the near side and the Corona Borealis
supercluster lies on the far side (the reader is referred to
Figures 4,
5, and
6 for general locational
orientation)]; that a void may be
present in the three-dimensional distribution of Abell clusters, which
extends from
lll  140° to 240°,
bll
30° to 50°, z
0.03 to 0.08,
and has a characteristic length of ~ 300 Mpc
(15); and that the
superclusters may be correlated on a scale of ~ 200 Mpc, suggesting
the possible existence of the largest structures yet detected
(14).
140° to 240°,
bll
30° to 50°, z
0.03 to 0.08,
and has a characteristic length of ~ 300 Mpc
(15); and that the
superclusters may be correlated on a scale of ~ 200 Mpc, suggesting
the possible existence of the largest structures yet detected
(14).
Batuski & Burns (24)
and Burns & Batuski
(33b)
adopt a different
approach to the study of large-scale structure with data for Abell
clusters. Instead of concentrating on the Abell clusters of the
statistical sample with measured redshifts, they apply data for all
2712 Abell clusters (statistical plus nonstatistical sample) with
measured plus estimated redshifts. This causes a loss of homogeneity
and accuracy in the data base, which, however, is counterbalanced by
an increase in the number of tracers that characterize the large-scale
structure. Each assigned redshift has been either measured directly or
estimated through a calibration curve from the apparent red magnitude
of the tenth most luminous cluster galaxy measured by Abell
(4).
Because the fractional uncertainty of an estimated redshift is
 z / z
0.3, the increased
sample with estimated redshifts typically
causes a decrease of the ratio of signal to noise (S/N) for the
identification and delineation of structures, but for very large
structures, S/N increases. From the rough three-dimensional
distribution of the 652 Abell clusters with measured or estimated
redshifts z 0.13,
Batuski & Burns (24)
constructed a finding list of
102 candidate superclusters and 29 candidate voids with measured or
estimated redshifts less than z
0.1. They identified
the candidate
superclusters as the islands created by the linking of overlapping
spheres of sweeping radius Rs = 60 Mpc attached to
each Abell
cluster. (1)
The four candidate superclusters with the largest membership
of Abell clusters and with more than 50% of their redshifts measured
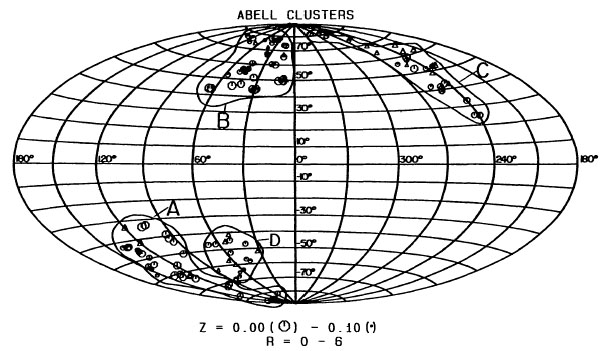
are illustrated in Figure 9. Batuski & Burns
(23) found that the
Pisces-Cetus supercluster (A in Figure 9)
located near the southern
Galactic cap is part of a possible filament of galaxies and galaxy
clusters with a characteristic length ~ 450 Mpc. In an independent
investigation (204,
204a),
Tully pointed out that if the
Supercluster-identifying sweeping radius in the Batuski & Burns sample
of Abell clusters is increased by only 50% to Rs = 90
Mpc, then a
dramatic change occurs in which the Pisces-Cetus supercluster links
with both the Coma/A1367 supercluster and the Local Supercluster. (The
linked structure is a band containing ~ 60 rich clusters that
stretches across the entire sky through both the southern and northern
Galactic caps!) Moreover, the main plane of this Pisces-Cetus
supercluster complex (characteristic length ~ 500 Mpc and thickness
~ 60 Mpc) is coincident with the principal plane of the Local
Supercluster [characteristic length ~ 50 Mpc and thickness ~ 8 Mpc;
cf. (203),
(204),
and Oort (128,
pp. 380-84)], which suggests that the
two structures are physically connected. M. Postman, D. Spergel, &
B. Sutin (private communication, 1987) are comparing the observational
data with corresponding data generated from computer simulations of
models that incorporate selection functions derived from the
observational data; the results of these comparisons could provide
quantitative estimates of the statistical significance of Tully's
observational results. A historical precedent for these kinds of
studies on the Pisces-Cetus supercluster complex is found in earlier
published studies on the Local Supercluster itself (cf.
9,
58,
59).
z / z
0.3, the increased
sample with estimated redshifts typically
causes a decrease of the ratio of signal to noise (S/N) for the
identification and delineation of structures, but for very large
structures, S/N increases. From the rough three-dimensional
distribution of the 652 Abell clusters with measured or estimated
redshifts z 0.13,
Batuski & Burns (24)
constructed a finding list of
102 candidate superclusters and 29 candidate voids with measured or
estimated redshifts less than z
0.1. They identified
the candidate
superclusters as the islands created by the linking of overlapping
spheres of sweeping radius Rs = 60 Mpc attached to
each Abell
cluster. (1)
The four candidate superclusters with the largest membership
of Abell clusters and with more than 50% of their redshifts measured
are illustrated in Figure 9. Batuski & Burns
(23) found that the
Pisces-Cetus supercluster (A in Figure 9)
located near the southern
Galactic cap is part of a possible filament of galaxies and galaxy
clusters with a characteristic length ~ 450 Mpc. In an independent
investigation (204,
204a),
Tully pointed out that if the
Supercluster-identifying sweeping radius in the Batuski & Burns sample
of Abell clusters is increased by only 50% to Rs = 90
Mpc, then a
dramatic change occurs in which the Pisces-Cetus supercluster links
with both the Coma/A1367 supercluster and the Local Supercluster. (The
linked structure is a band containing ~ 60 rich clusters that
stretches across the entire sky through both the southern and northern
Galactic caps!) Moreover, the main plane of this Pisces-Cetus
supercluster complex (characteristic length ~ 500 Mpc and thickness
~ 60 Mpc) is coincident with the principal plane of the Local
Supercluster [characteristic length ~ 50 Mpc and thickness ~ 8 Mpc;
cf. (203),
(204),
and Oort (128,
pp. 380-84)], which suggests that the
two structures are physically connected. M. Postman, D. Spergel, &
B. Sutin (private communication, 1987) are comparing the observational
data with corresponding data generated from computer simulations of
models that incorporate selection functions derived from the
observational data; the results of these comparisons could provide
quantitative estimates of the statistical significance of Tully's
observational results. A historical precedent for these kinds of
studies on the Pisces-Cetus supercluster complex is found in earlier
published studies on the Local Supercluster itself (cf.
9,
58,
59).

|
Figure 7. A complete-linkage dendrogram for
the statistical sample distance
classes D |
|
Figure 8. The ordinate represents
Ncrossings, the number of crossing distances
traversed by a cluster in its dendrogram supercluster over one Hubble
time-scale (H0-1). Superclusters in the
northern and southern Galactic
hemisphere are represented by closed and open circles,
respectively. The crossing distance is defined as the radius of a
dendrogram supercluster.
Ncrossings is estimated from the formula
Ncrossings =
|
Although a definitive answer concerning the physical existence of
the Pisces-Cetus supercluster complex must await results of
quantitative simulation analyses such as that by M. Postman et al. and
observational analyses with measured redshifts for the complete sample
of Abell clusters with z
0.13, I suggest that the
hypothesis of a
physically real Pisces-Cetus supercluster complex might make more
understandable at least two astronomical puzzles: (a) The polar
Galactic extinction derived from the classical interpretation of
galaxy counts is much larger than the accepted value (0.2 mag) derived
from less suspect methods
(59b).
The Pisces-Cetus supercluster complex
would introduce a previously unrecognized bias that acts in the
direction of the effect. The steep selection function in Galactic
latitude that has been derived from the surface distribution of Abell
clusters (17)
(corresponding to an equivalent polar extinction of 0.5
mag) may also contain a component from this very large structure. The
discovery by Kirshner et al.
(104)
that the galaxy distribution is
significantly smoother in a sampling of the south Galactic polar cap
than in a sampling of the north Galactic polar cap may be related to
the structure of the Pisces-Cetus supercluster complex. (b) The Local
Group moves with a velocity of 600 km s-1 relative to the
frame of the cosmic microwave background
(212a),
which is consistent (within the
uncertainties of measurements of velocities and especially distances)
with results from local samples of galaxies within an effective
distance of ~ 100 Mpc
(2,
6,
50a,
113b).
There is also an indication
from studies of kinematic properties of elliptical galaxies within a
distance of ~ 100 Mpc that this entire local region might be
participating in this motion
(6,
113b). Bulk motion
would be
understandable if the Pisces-Cetus supercluster exists, and part or
all of the 600 km s-1 motion of the Local Group relative to
the frame
of the microwave background could be caused by the gravitational
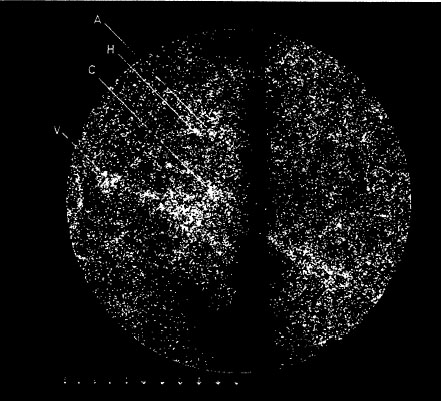
attraction of this supercluster complex. [A local feature sometimes
called the "Great Attractor," located at a distance of ~ 90 Mpc
positioned on the sky just below the Centaurus cluster
(Figure 10),
has previously been suggested to cause bulk streaming motion
(6,
113b).
Comparison of Figures 8 and
9 indicates that the "Great
Attractor" is located on the great circle of the Pisces-Cetus
supercluster complex and hence is likely to be a nearby part of this
relatively planar structure.] The mass of the Pisces-Cetus
supercluster complex is
M = 1017 - 1018
M ,
derived by
Tully (204) from
summing the mass expected to be associated with the number of Abell
clusters in the complex (cf.
12,
45)
and, alternatively, by estimating
the fraction of mass in the volume occupied by the complex in a
universe with a density parameter
0.1 <
,
derived by
Tully (204) from
summing the mass expected to be associated with the number of Abell
clusters in the complex (cf.
12,
45)
and, alternatively, by estimating
the fraction of mass in the volume occupied by the complex in a
universe with a density parameter
0.1 <  <
1. The Local Group and the
galaxies in its environs would be falling toward the center of the
Pisces-Cetus supercluster complex with an infall velocity given by
Vin
= GM / R2H0. For R ~
250 Mpc and M ~ 1017 - 1018
M,
vin
~ 150-1500 km
s-1, consistent with the observed peculiar velocities
relative to the Hubble flow (e.g.
Vin
= 600 km s-1 corresponds to
M 4 ×
1017
M).
<
1. The Local Group and the
galaxies in its environs would be falling toward the center of the
Pisces-Cetus supercluster complex with an infall velocity given by
Vin
= GM / R2H0. For R ~
250 Mpc and M ~ 1017 - 1018
M,
vin
~ 150-1500 km
s-1, consistent with the observed peculiar velocities
relative to the Hubble flow (e.g.
Vin
= 600 km s-1 corresponds to
M 4 ×
1017
M).
The location of the ~ 300 Mpc void identified by Bahcall & Soneira (15) (see above) is noted in the caption for Figure 9. From analysis of their extended sample of Abell clusters, Batuski & Burns (24) and D.J. Batuski et al. (private communication, 1987) find that this is indeed an extremely large region of very low cluster density: knowledge of whether or not it will break up into a collection of smaller voids, however, must await direct redshift measurements for the Abell clusters whose estimated redshifts would place them in or near this void.
|
Figure 9. Aitoff equal-area projection of
the celestial sphere in Galactic latitude (bll) and
longitude (lll) displaying the locations of the
Abell clusters in all richness classes (R = 0-6) contained in
four of the supercluster candidates of Batuski & Burns
(24). Octagons and
triangles signify clusters with measured redshifts and estimated
redshifts, respectively. The legend contains the limits of the sizing
scheme for the symbols (linear in redshift). The four candidates,
outlined by contour lines, are (A) Pisces-Cetus, (B) Sextans-Leo, (C)
extended Hercules, and (D) Aquarius. By inspecting the chart
representing the sky distribution of Abell clusters reproduced in
Figure 20 of Oort (128,
p. 404), we note that the zone of Galactic
obscuration lies between
bll |
|
Figure 10. Computer-generated sky map by
O. Lahav of galaxies with blue magnitude smaller than
mp ~ 14.5. The plot is centered at
lll = 307 ,
bll = 9, the direction of streaming motion found from
a sample of elliptical galaxies within a volume of radius
|
1 This "percolation technique" introduced
in another context by Turner & Gott
(205a)
and later introduced to the study of superclustering by Zel'dovich et al.
(216)
is discussed more fully by Oort
(128
pp. 409-11), and is one of a family of related supercluster
identification
techniques (Section 3.1.3). A given
sweeping radius applied to a
sample of clusters that is selection-free (or for which selection
effects have been removed) specifies a given minimum local number
density for supercluster membership,
 min
= (4
min
= (4 Rs3 / 3)-3. which
corresponds to a minimum global density contrast
Rs3 / 3)-3. which
corresponds to a minimum global density contrast
 G; for
example, Bahcall & Soneira
(18)
identified 16 superclusters with
G
G; for
example, Bahcall & Soneira
(18)
identified 16 superclusters with
G
 20.
Back.
20.
Back.
 2
2