


6.2. The Spatial Distribution of Pairs
Ignoring the a priori isolation of double galaxies from their nearest neighbours, many pairs are found in systems of higher multiplicity. The isolated galaxy pairs delineate a picture of multi-stage clustering, and therefore the distribution of pair centers maintains `frozen' information about the formation conditions of the observed hierarchy.
Inspecting the distribution of double galaxies by apparent magnitude (figure 12) and radial velocity (figure 14), we noted that a significant fraction of bright pairs are in the Local Supercluster. We illustrate this in figure 42, which shows the distribution of bright pairs in supergalactic latitude (SGB). The cross hatching indicates objects with radial velocity less than 2500 km/s. Galaxies with greater velocities are located beyond the limits of the Local Supercluster. The closer pairs exhibit a markedly greater concentration to the super-galactic equator, with an rms latitude of <SGB2>1/2 = 24° ± 3°, whereas for the entire sample it is 32° ± 1°. The distributions N(SGB) and N(V0) allow us to conclude that about half of the double systems with V0 < 2500 km/s are in fact members of the Local Supercluster.
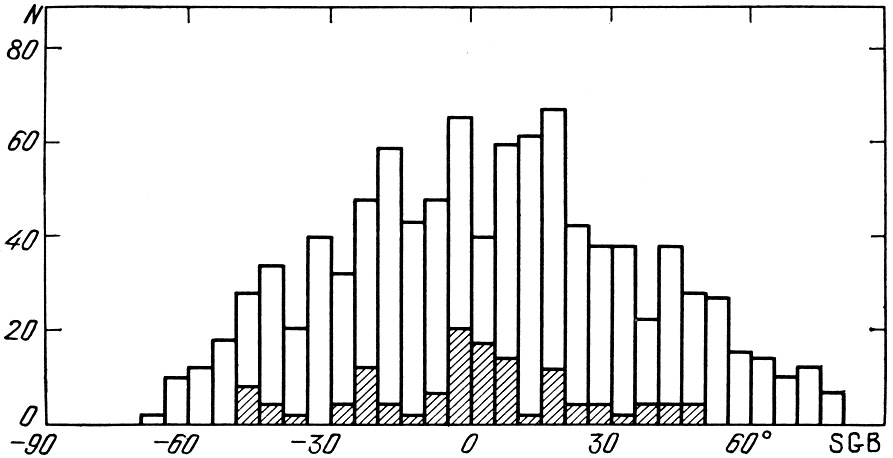 |
Figure 42. |
The overall distribution of pair centers on the sky in
equatorial coordinates ( ,
,
 ) was shown in
figure 4,
where we see significant non-uniformities.
However, the known nearby clusters of galaxies are not present with
the same high contrast as the distribution of all galaxies from the CGCG
to the same limiting magnitude.
) was shown in
figure 4,
where we see significant non-uniformities.
However, the known nearby clusters of galaxies are not present with
the same high contrast as the distribution of all galaxies from the CGCG
to the same limiting magnitude.
Karachentsev and Shcherbanovsky (1983) examined the spatial distribution of double systems on a variety of scales. The distance of pairs of galaxies from the observer was calculated from the mean radial velocity of the components for a Hubble constant H = 75 km/s/Mpc. For each pair, its distance from the nearest five double systems was calculated to evaluate the role of chance groupings of pairs.
The distribution of pairs according to separation from the nearest
neighbour has a maximum at 5 Mpc.
Among 487 pairs only the 19 nearest neighbours are closer than 2 Mpc,
and 7 are closer than 1 Mpc.
About 80% of such cases are in the region of the Local Supercluster.
Using the index of galaxy groups by
de Vaucouleurs (1975)
it is easy
to convince oneself that almost all pairs which have such close neighbour
pairs are in fact members of these groups (or even the Virgo cluster).
In only one case do two pairs of galaxies, numbers 195 and 199, form an
apparently isolated binary system of pairs, with projected separation
0.92 Mpc.
Therefore, analysis of the three-dimensional distribution of pair centers
establishes that the features of their small-scale distribution are
due not to individual associations of the "pair + pair
 pair", type, but to the membership of double galaxies in the population of
groups and clusters.
pair", type, but to the membership of double galaxies in the population of
groups and clusters.
Besides the concentrations to the nearest groups and the Local
Supercluster, double galaxies show some distribution properties
with respect to the contours of other known superclusters, such
as those in Perseus, Coma and Hercules.
This tendency was demonstrated by
Tifft (1980)
on sky maps in which the
distribution of double galaxies was projected in fixed intervals
of radial velocity.
This claim about the large-scale distribution of pair centers
is shown in the form of a `pie' diagram in
figure 43, which shows objects with
V0 < 10000 km/s in the region
9h < <
17h, 0° <
< 20°.
The Local Supercluster has a radial appearance in this diagram due to its
virial motions.
In the radial velocity interval shown here, the southern part of the Coma
supercluster is noticeable near V0 = 7000 km/s and
= 13.5h.
Between this and the Local Supercluster is a known empty region
which was detected from field galaxies.
Comparison of figure 43 with the analogous
diagram in
Davis et al. (1982)
for galaxies brighter than magnitude 14.5 shows a noteworthy general
agreement for voids and groups.
However, an unmistakable characteristic of the distribution of pairs
is the weaker concentration of objects to the densest regions of clusters.
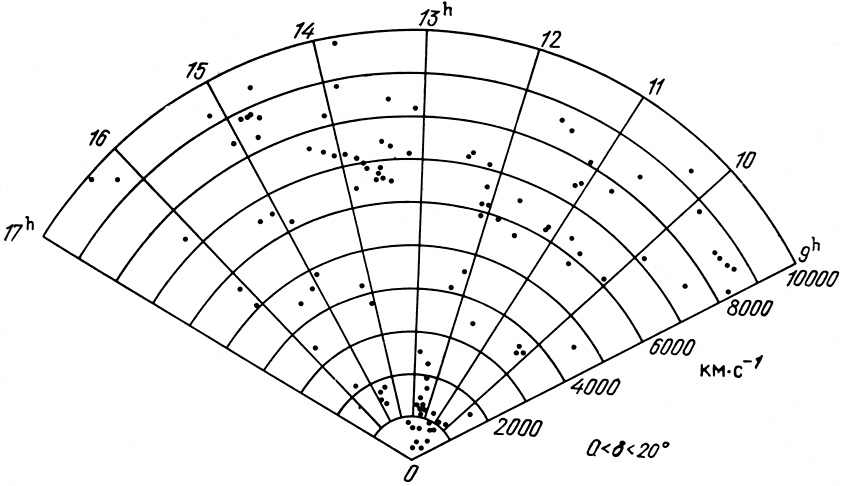 |
Figure 43. |
For a quantitative estimate of the differences in the spatial
distributions of galaxies and the centers of pairs, we calculated the
two-point correlation function
 (r) and
compared it to the data presented by
Peebles (1980).
From our subsample we excluded the zone of low galactic latitude with
| b| < 30° and the distant objects with
V0 > 7500 km/s.
This refinement of the sample was dictated by the need to reduce the
effects of non-uniformity due to galactic absorption and of
selection effects in the distance from the observer.
The correlation function per unit steradian was calculated for a
range extending to D = 100 Mpc. A selective decline in
(r) due to
the boundaries of the region was avoided by excluding pairs located within
(r) and
compared it to the data presented by
Peebles (1980).
From our subsample we excluded the zone of low galactic latitude with
| b| < 30° and the distant objects with
V0 > 7500 km/s.
This refinement of the sample was dictated by the need to reduce the
effects of non-uniformity due to galactic absorption and of
selection effects in the distance from the observer.
The correlation function per unit steradian was calculated for a
range extending to D = 100 Mpc. A selective decline in
(r) due to
the boundaries of the region was avoided by excluding pairs located within
 b = 6°
and
= 6° from the
perimeter.
b = 6°
and
= 6° from the
perimeter.
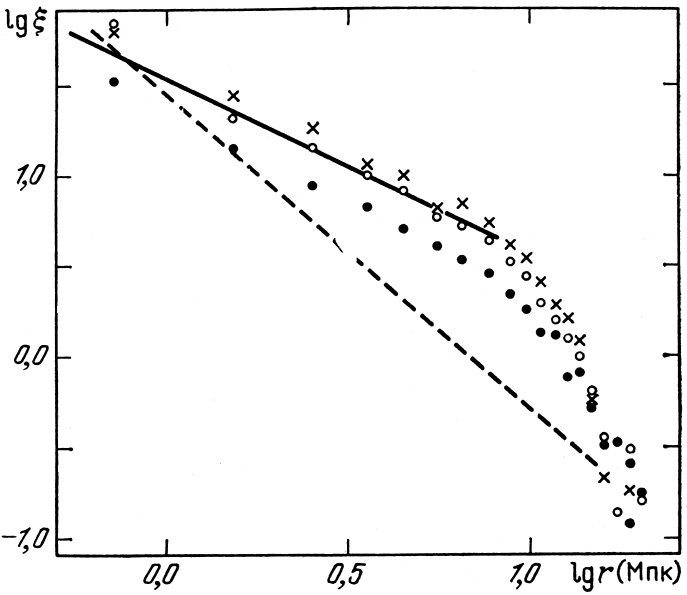 |
Figure 44. |
The calculated
(r) for
the centers of pairs is shown in figure 44.
The filled circles indicate values of the correlation function of pairs
with V0 < 7500 km/s, the open circles are for pairs
with V0 < 5000 km/s,
and the crosses are for V0 < 2500 km/s.
The last subsample is dominated by the Local Supercluster.
Statistically significant values of the two-point correlation function
were measured on scales from 0.7 to 20 Mpc.
In the range 0.7 to 8 Mpc the correlation function is well fit by
 |
(6.4) |
and for r > 10 Mpc it falls as r-5. The dashed line indicates the function
 |
(6.5) |
found by Peebles (1980) for galaxies in the Zwicky catalogue, scaled to H = 75 km/s/Mpc over the interval 130 kpc to 13 Mpc.
As the range of V0, i.e., the sample depth, is
reduced, the sample completeness increases.
Along with this the amplitude of
p(r) rises but its slope
remains practically unchanged.
For all examined intervals the amplitude of the spatial distribution
function (r)
for double systems is higher than it is for galaxies.
An analogous effect was demonstrated by
Klypin and Kopilov (1983)
for the correlation function of clusters of galaxies.
With regard to the various limitations on
p and
g, the
question arises as to whether it is possible for these differences to
have been introduced by the action of the isolation criteria.
The mean separation between members of pairs is
<r12>
 50 kpc.
According to the strict isolation criterion, no neighbour should occur
in a zone of avoidance of size ~ 10<r12>
0.5 Mpc.
This characteristic length lies outside the intervals for which we have
evaluated the correlation function, so that the selection criteria cannot
have had a significant effect on the slope
logp(r).
50 kpc.
According to the strict isolation criterion, no neighbour should occur
in a zone of avoidance of size ~ 10<r12>
0.5 Mpc.
This characteristic length lies outside the intervals for which we have
evaluated the correlation function, so that the selection criteria cannot
have had a significant effect on the slope
logp(r).
Besides the effect of selection, another systematic difference between
p and
g may
be an actual lack (or deficit) of double systems
in the densest regions of groups and clusters, if wide pairs are exposed
to disruption by tidal forces.
It is not possible to exclude the idea that double systems formed in
relatively sparse regions around the development of large-scale
inhomogeneities which joined to the dense regions and are observed
now as shells around rich clusters of galaxies.
This could indeed explain the property that the maximum excess of
p over
g
occurs on scales ~ 10 Mpc, in agreement with the typical radius of a
supercluster.
The nature of the differences in the slope and amplitude of the
correlation functions
p and
g will
require further analysis.
One stage would be investigating the spatial cross-correlation function
pg(r) between galaxies and the centers of
pairs.