


6.1. The Spatial Frequency of Double Galaxies
In this chapter we examine the properties of the apparent and spatial
distributions of double systems as well as estimates of the
frequency with which one encounters galaxies in pairs.
The relative number of galaxies per unit volume which form isolated
pairs ( ) is an important
parameter which gives basic information
on the formation of galaxies and systems of galaxies.
Accurate estimates of this parameter are rather difficult, and
we will examine three ways of estimating
, each with its own
shortcomings.
) is an important
parameter which gives basic information
on the formation of galaxies and systems of galaxies.
Accurate estimates of this parameter are rather difficult, and
we will examine three ways of estimating
, each with its own
shortcomings.
1. In computer modelling of the apparent distribution of galaxies
(section 3.1) we assumed that half of all
galaxies in a unit volume form pairs, i.e., that
= 0.5.
For such an unrealistically high spatial frequency of double
galaxies, their relative number in the sample brighter than
magnitude 15.7 would be M* = 0.064, or overall 1.5
times higher than in the catalogue,
K* = 0.042
at the same limiting magnitude. In order to bring
M* and
K* into agreement
we would have to decrease the value of
to 0.33, but this simple
approach is somewhat misleading.
In constructing the model we incorporated a single form of the
luminosity function for field galaxies, members of pairs, and groups and
clusters, and we further assumed that the absolute magnitudes for
components of double systems were mutually uncorrelated.
As we know, the population of real pairs does not exhibit such
simple properties.
In order to effect a transformation between the number of double galaxies in the catalogue and the `correct' number in a volume sample, we may use
 |
(6.1) |
where the expressions to be multiplied by
have the following
meanings. The first factor,
qph, characterizes the photometric selection and
indicates the probability of finding the second pair component in the
catalogue if we are dealing with the brighter of two components.
From the modelling we find qph = 0.103.
The second coefficient, qL, accounts for any possible
luminosity excess for double galaxies. For our models,
qL = 1. The following term,
qcr, covers the selection effects introduced
by our isolation criteria.
According to section 3.2, the `purity' of the
criterion is relatively high, with qcr = 0.71.
Finally, the factor of qre accounts for the number of
false pairs, both optical and members of systems.
By comparing the number of real pairs to the model we find
(section 3.2) qre = 0.57.
Evaluation of (6.1) now gives M* =
0.128.
The observed differences between the catalogue and model pairs may be
viewed as changes in the values of the coefficients
(qph ... qre).
As was shown in section 3.5, the components
of the catalogue pairs exhibit a strong correlation in luminosity.
Taking this into account gives a much weaker value of the photometric
selection for pairs in the catalogue: qph = 0.40.
In addition, the observed excess in the mean absolute magnitude of double
galaxies,  M =
-0.56m compared to field galaxies
(section 3.6), leads to a factor
qL = 100.6 × 0.56 = 2.17.
Furthermore, in the modelling we adopted a distribution of the
separation X which was too flat.
If one incorporates the density distribution n(X) from (3.8),
then the selection criterion for isolated pairs reduces the value of
qcr by almost a factor of two, to 0.36.
The final factor, the fraction of real isolated pairs,
qre = 0.83, was estimated on the basis that all
systems with f < 100 are physical doubles.
M =
-0.56m compared to field galaxies
(section 3.6), leads to a factor
qL = 100.6 × 0.56 = 2.17.
Furthermore, in the modelling we adopted a distribution of the
separation X which was too flat.
If one incorporates the density distribution n(X) from (3.8),
then the selection criterion for isolated pairs reduces the value of
qcr by almost a factor of two, to 0.36.
The final factor, the fraction of real isolated pairs,
qre = 0.83, was estimated on the basis that all
systems with f < 100 are physical doubles.
Using these values, we find for the catalogue pairs, according to (6.1),
that K* =
0.376.
Therefore, for K* = 0.042 we have an
estimated true spatial frequency of double galaxies,
= 0.11.
2. Independent estimates of the parameter
may be found by
analyzing the apparent (bivariant) distribution of galaxies.
One method incorporates measurements of the angular separation
between galaxies: individual pairs do not enter into this method.
Suppose that isolated galaxies and the centers of pairs are distributed in a uniform random pattern across the sky, and that we ignore systems with multiplicity n > 2. Let P(x) be the distribution function in angular separation of the nearest galaxy, on the basis that x is measured from a given center. If P*(x) is the analogous integral function for the distribution of x from centers corresponding to galaxies, then
 |
(6.2) |
where F(x) is the integral distribution function of the
angular separation between pair components, and
* is
the relative number of double galaxies. The required
*
and F(x) can thus be obtained from
the observed distributions:
 |
(6.3) |
This approach was proposed by
Neyman and Scott (1962)
and independently by
Fesenko (1964).
Karachentsev (1971)
applied it to the sample of galaxies brighter than
magnitude 14 from the CGCG catalogue.
The derived distributions P*(x) and
P(x) were calculated from measurements
of the angular separation of neighbouring galaxies from each galaxy and
from randomly selected centers. The estimate of
*
F(x) calculated from these
is shown in figure 41 as the filled circles,
with vertical error bars
indicating standard deviations derived from four sub-samples.
The observed results suggest the smoothed continuous curve.
It follows from these data that the relative number of galaxies located
in pairs is 0.125, with a mean angular separation between components
<x> = 7.7'.
This value is in agreement with the mean projected linear
separation between double galaxies (87 ± 22) kpc, but somewhat
larger than the estimate <X> = 65 kpc found in
section 3.4.
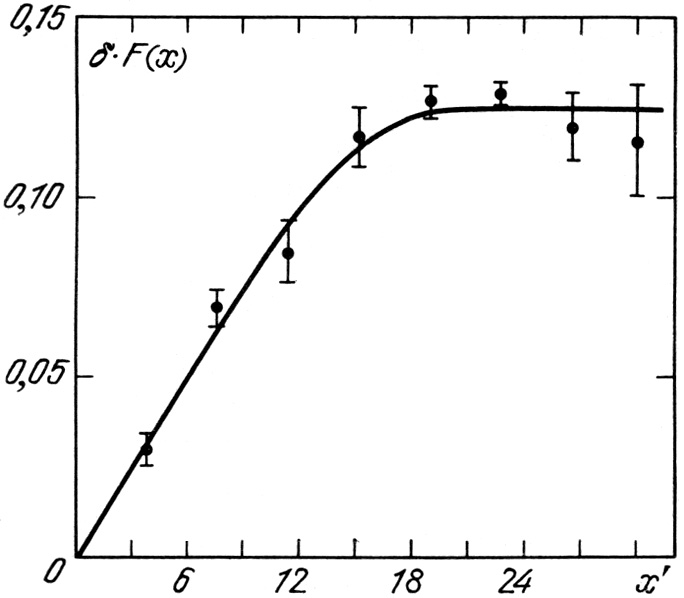 |
Figure 41. |
Note that we estimated the relative number of double galaxies from a
subsample limited to galaxies brighter than apparent magnitude 14.0.
To calculate the spatial frequency of double galaxies it would be necessary
to incorporate the distribution of the components in absolute magnitude.
This difficulty may be partially circumvented by calculating
P*(x) and
P(x) for galaxies of various apparent magnitudes with
galaxies of fixed m serving as the centers of calculation.
Such differential measurements lead to an estimate of the spatial
frequency of double galaxies of
= 0.24.
However, the full advantage of determining
this way cannot be
realised because the necessary assumption of a Poisson distribution
of single galaxies and centers of pairs departs markedly from reality.
In fact, the value of
and the form of the distribution F(x)
are strongly disturbed by the presence of multiple systems with
multiplicity n > 2.
Analogously, but with a more elegant method of differential calculation,
van Albada has constructed a catalogue of multiple systems, as described
by van Moorsel (1983).
van Albada found that 45% of objects in multiple systems belonged to pairs.
Bearing this in mind, we get a corrected (from systems of
multiplicity n > 2) estimate of the spatial frequency of
double galaxies of
= 0.24 × 0.45
 0.11.
0.11.
3. A check on the calculated values of
may be carried out
by analysing the distribution of the very nearest catalogue pairs. From
de Vaucouleurs (1975),
there are 196 galaxies, including 66 dwarf
members, in 10 northern groups nearer than 10 Mpc.
These groups contain 10 isolated pairs from our catalogue, which gives
an estimate = 0.102.
In a subsample without dwarf galaxies the relative number of
double systems was somewhat higher (0.138), in agreement with
section 3.5.
Bottinelli et al. (1984,
1985)
published a compendium of spiral galaxies
with individual distance modulus estimates.
Among 145 northern galaxies within 10 Mpc, 18 are members of isolated pairs.
This relative number,
= 0.124, is in
excellent agreement with the previous results.
Huchra and Geller (1982) examined a third sample of the closest galaxies, and found that 14% occur in double systems.
In conclusion we note the work of Turner et al. (1979) which incorporates modelling of the gravitational clustering of galaxies. Among various results dealing with the dynamical properties of groups and clusters, they found a value for the relative number of galaxies in double systems ~ 0.08. However, they did not clarify which criteria they used for identifying pairs.
Summarizing this set of results we note that they are all in the
interval [0.10 - 0.14] with mean
<> = 0.12.
The scatter in is
satisfactorily small, taking into
account the various methods and their possible systematic errors.