


7.3. Dynamical Friction and the Evolution Rates of Double Galaxies
According to computer models by Toomre and Toomre (1972), van Albada and van Gorkom (1977), White (1978), Duncan et al. (1983) and Borne (1984), contact pairs of galaxies quickly merge into single stellar systems due to dynamical friction. After approaching to separations comparable to the sum of their diameters, pair members only have time to complete two or three damped revolutions, which for typical pairs lasts of order 2 × 10⁹ years. The same conclusion was reached analytically by Alladin and Parthasarathy (1978).
Ostriker and Turner (1979) drew attention to possible observational tests of dynamical friction through a dependence between luminosity and separation of double galaxies, since the fastest mergers are those with very large component masses. Among close double systems one would therefore expect to observe a deficit in galaxies of high luminosity. From the luminosity-separation correlation for 56 Turner pairs, White and Valdes (1980) and Ostriker and Turner (1979) could not agree as to whether one observes this result of dynamical friction or not. To reach some conclusion, it is necessary to study a much more extensive sample, and to take into account various selection effects in the distribution of the observational data.
Figure 56 presents the distribution of the 487 isolated catalogue pairs in total luminosity L12 and projected separation X. The expected overall correlation between L12 and X is clear, but before regarding this as evidence of an evolutionary origin, one must note that several factors might contribute to this correlation.
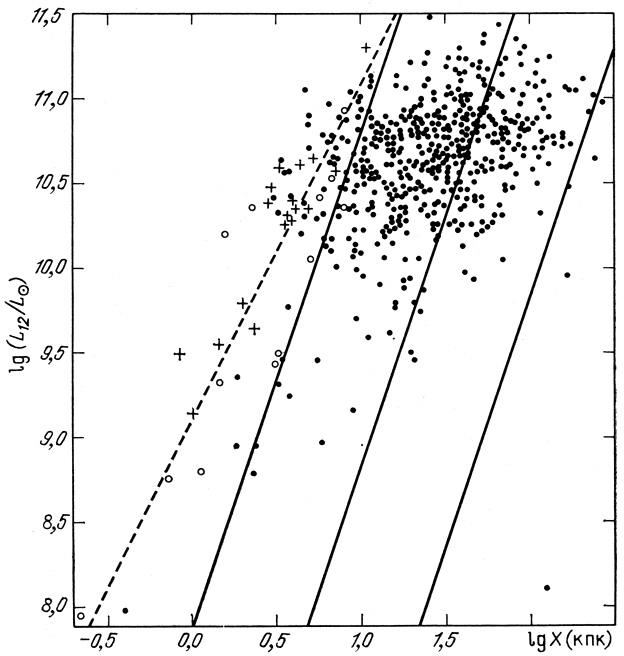 |
Figure 56. |
One factor lies in the difficulty of recognising very tight pairs on charts of the Palomar Atlas. This was recognised in the analysis by Ostriker and Turner (1979). They proposed that components of double systems will be separately visible if their separation is larger than several characteristic scale lengths (X > 5 kpc). As a test we examined 18 cases from our catalogue in which what appeared to be a pair of galaxies was in fact a single object with complicated structure, or even a galaxy in which a star was projected near the central region. Due to the high contrast of the Palomar prints the structure of the very brightest parts of galaxies is over-exposed, and the details there may be lost. A spurious duplicity of such galaxies may be tested by spectral observation, as well as by images at large scales. The 18 false `pairs' are shown in figure 56 as crosses. In all of these cases the angular separation between the `components' lies in the interval (0.17'- 0.32'), so that the linear separation is in the range (0.7 - 11) kpc. This implies that a quantitative exclusion of tight pairs must be based on the angular rather than the linear separation. Therefore, on the diagram we have distinguished with filled circles the 13 pairs whose true duplicity may be considered questionable on the basis of this criterion. These are numbers 97, 172, 186, 217, 283, 301, 307, 310, 311, 330, 346, 370 and 535. Most of these may reflect internal structure or the super-associations which are difficult to distinguish from dwarf satellites. The subsample of false and dubious pairs leads to the regression L12 ~ X2 shown as the dashed line in figure 56. Note that there are only a few tight pairs in the `zone of confusion' to the left of the dashed line, because these must consist of very compact galaxies.
Another selection which could produce a correlation between mass
and separation comes from the isolation criteria.
Among wide pairs, systems with dwarf components have a smaller chance of
satisfying the isolation criteria in comparison to galaxies projected
in close proximity, than do systems of giant galaxies.
Another contribution to an
L12 - X correlation may be due to
the brightest members of groups and clusters, for which the high
luminosity prevents the M/L ratio from exceeding the critical value
100 f adopted to exclude false pairs.
Quantitative analysis of these various selection effects is a very difficult task, and so we have applied the selection effects to the subsample of model pairs satisfying the same selection criteria as the real double systems in our catalogue. The dependence of the mean absolute magnitude of a double galaxy on projected separation is summarized in figure 57. The diamonds indicate the mean value for catalogue pairs and the crosses are for the model pairs. The vertical extent of each symbol indicates the standard deviation of the mean. To imitate the visibility of tight double systems, we excluded objects with angular separations X < 0.3'. Neglecting differences in the zero point for absolute magnitudes, the dependence <M| X> is similar for both samples. Furthermore, a similar effect is shown in figure 58 where analogous symbols indicate the dependence of mean linear diameter on X. As shown by detailed consideration of the region X < 10 kpc, the basic effect is the exclusion of very tight pairs. For wide double systems the dependences of absolute magnitude and linear diameter are due to the selection criteria. The selection effects are overall quite significant, being a factor of 5 in diameter and about 10 in luminosity, on varying the separation between components from 3 to 200 kpc. In the presence of such strong selection effects, confirming the predictions of mergers due to dynamical friction could become quite problematical. For the exact same reasons it would be very difficult to find evidence for any original luminosity-separation correlation which might have come from the formation of double systems in the proto-galactic era.
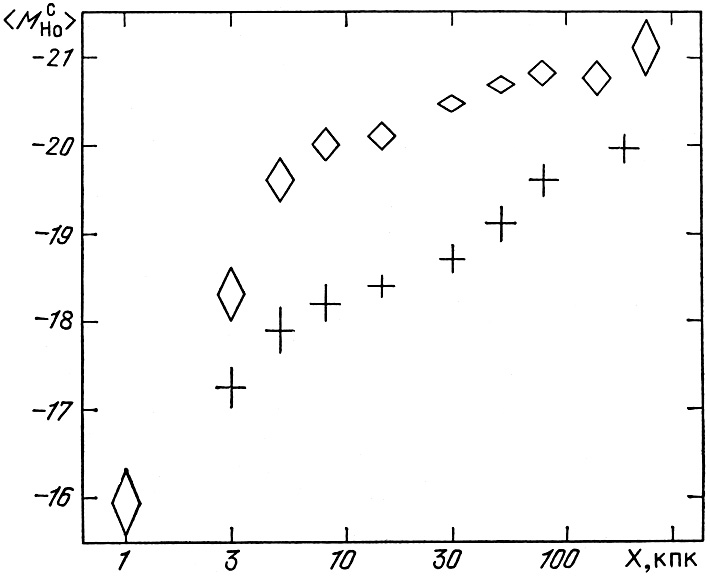 |
Figure 57. |
From the data in figure 56 we now estimate the orbital period of double galaxies around their common center of gravity. According to Kepler's Third Law, for circular motion around the center of mass of a system of total mass M12, the spatial separation r12 and the period T are related by
 |
(7.11) |
Replacing the spatial separation by its projection X and using a
single mass-to-luminosity ratio for both galaxies
<M12 / L12> = 7.5
f, we have
 |
(7.12) |
where 
 TH is the
dimensionless period, expressed in units
of the inverse Hubble parameter H-1.
In figure 56 the diagonal lines represent pairs
with periods
equal to 0.01, 0.1 and 1 in units of cosmological time
H-1.
The distribution of double systems with respect to these isochrones has a
considerable dispersion, induced in part by projection effects.
The detailed distribution of
for 487 pairs is shown in
figure 59.
It has approximately a log-normal form with median
0.5 = 0.055.
Correction for projection factors increases the period by a mean of
(16 / 3
TH is the
dimensionless period, expressed in units
of the inverse Hubble parameter H-1.
In figure 56 the diagonal lines represent pairs
with periods
equal to 0.01, 0.1 and 1 in units of cosmological time
H-1.
The distribution of double systems with respect to these isochrones has a
considerable dispersion, induced in part by projection effects.
The detailed distribution of
for 487 pairs is shown in
figure 59.
It has approximately a log-normal form with median
0.5 = 0.055.
Correction for projection factors increases the period by a mean of
(16 / 3 )
)
 1.7.
1.7.
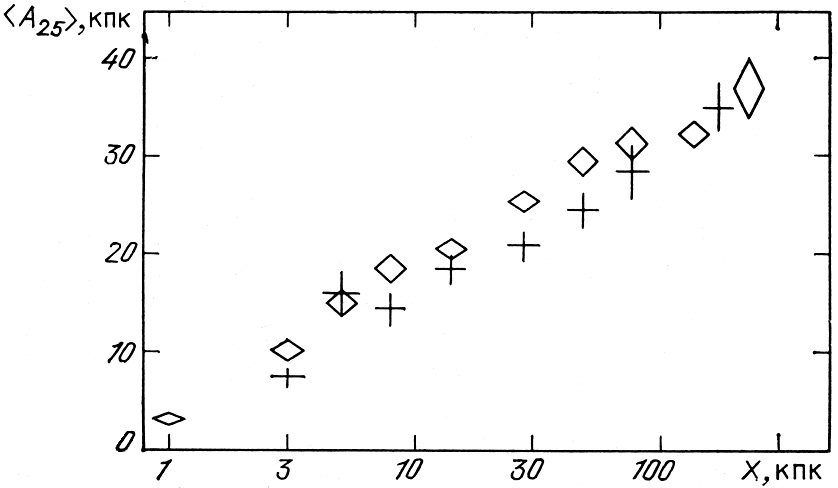 |
Figure 58. |
 |
Figure 59. |
The period may be estimated by another method, using the
individual values of the radial velocity difference y and
projected separation X.
For random orientations of the relative velocity vector
V12 and the
radius vector connecting the components with respect to the line of sight,
we have the obvious expressions
<y> = <V12> / 2 and
<X> =
<r12> / 4.
Thus, as an estimate of the dimensionless orbital period
=
2 Hr12 /
V12 we may use
 = 4HX / y
(14) .
The distribution of
for galaxies is shown by the vertical lines in
figure 59.
In order to reduce the strong effects due to radial velocity measurement
errors, we excluded about 20% of the objects for which
= 4HX / y
(14) .
The distribution of
for galaxies is shown by the vertical lines in
figure 59.
In order to reduce the strong effects due to radial velocity measurement
errors, we excluded about 20% of the objects for which
 y > y.
Aside from differences in the methods of estimating the orbital period,
the distributions show excellent agreement.
Note that pairs of elliptical galaxies have a period of revolution on
average 3.2 times smaller than have pairs of spirals.
The relative number of double galaxies with orbital periods
T > H-1 is in all ~ 1%,
and is practically independent of the method of estimating
.
y > y.
Aside from differences in the methods of estimating the orbital period,
the distributions show excellent agreement.
Note that pairs of elliptical galaxies have a period of revolution on
average 3.2 times smaller than have pairs of spirals.
The relative number of double galaxies with orbital periods
T > H-1 is in all ~ 1%,
and is practically independent of the method of estimating
.
Numerical experiments modelling dynamical friction
make notable predictions about the rate of evolution of double galaxies.
After the components approach until their outer regions are in contact,
the pair enters a brief final stage, merging into a single stellar system.
Because this last phase in the simulation does not last for more than
two or three revolutions of the galaxies around the common center of mass,
and the period of rotation of a typical pair is
0.06 - 0.10,
the characteristic time for `bringing down the curtain' on double
galaxies (m
0.1 - 0.3) is several
times smaller than the age of the Universe.
With this short a time scale for merging comes a very important question:
why do we observe so many tight double systems which have not merged into
single galaxies over the cosmological time
H-1
1010 years ? Before we can hope to answer this question, we
must examine several kinds of data.
The observed orbital motion in pairs of galaxies approaches circularity.
Virtually all of the various scenarios for the origin of double galaxies
predict the maximum of the distribution at the largest eccentricities
(e 1)
(Nash and Monaghan, 1978,
Turner et al., 1979,
Evrard and Yahil, 1985).
Obviously merging will initially affect most strongly those
pairs having the largest eccentricities.
On approaching to small separations the components feel strong
dynamical friction and join the class of single objects.
From our estimates such an evolutionary selection should lead to a decrease
in the relative number of double systems by a factor of about three.
Therefore, the relative number of double galaxies at the present epoch,
 2 = 0.12 (see
section 6.1) leads us to conclude that at
the time of formation every third galaxy was located in a double system.
In this case the evolution of pairs of galaxies might have been one of the
most powerful factors driving, and setting the rate of, the evolution
of galaxies and systems of galaxies at early epochs.
2 = 0.12 (see
section 6.1) leads us to conclude that at
the time of formation every third galaxy was located in a double system.
In this case the evolution of pairs of galaxies might have been one of the
most powerful factors driving, and setting the rate of, the evolution
of galaxies and systems of galaxies at early epochs.
However, the merging of double galaxies should lead to non-conservation
of the number of single galaxies.
If two thirds of the primordial double systems have been merged,
then the expected fraction of single objects now is
1 = 0.24.
This estimate is clearly contradicted by the observations.
The strictest criterion for single isolated galaxies was formulated by
Karachentseva (1973).
The isolated objects of her catalogue formed a quite rare population
(* =
0.04) among galaxies of the CGCG brighter than magnitude 15.7.
Using numerical modelling and considering errors in the criteria of the
first and second kind,
Karachentseva (1980)
showed that the spatial frequency of isolated galaxies does not exceed
1 = 0.05
(15) .
Therefore the observed number of single galaxies per unit volume is lower than that expected from strong merging of double systems by a factor of five. According to the model result, merging leads to the formation of spheroidal galaxies, but isolated galaxies are dominated by disk galaxies of late type (Karachentsev and Karachentseva, 1974). To this one may add an additional problem connected with the magnitudes of the mean luminosity and angular momenta of isolated galaxies (Karachentsev, 1981e).
The contradiction between the rapid rate of merging for double galaxies and the observed rarity of single galaxies may be easily dealt with if one considers another line of evidence. In chapter 6 it was shown that pairs are situated in a multi-stage hierarchy incorporating groups, clusters and superclusters of galaxies. Of the nearest isolated pairs, almost all are located in known de Vaucouleurs groups which are themselves parts of the Local Supercluster. The situation is analogous for more distant double systems for which we can evaluate the three-dimensional correlation function for pair centers. From this, we see that mergers due to dynamical friction will lead to members of the same systems and not to objects of the general galactic field. Finally we note that groups and clusters contain sufficiently large relative numbers of elliptical galaxies as to agree easily with the expected number of merger products.
The relative number (~ 0.24) of galaxies resulting from mergers
was estimated on the basis of circular orbits.
Suppose that at the present time only a third of the original number
of pairs have survived and that only those having preferentially large
orbital eccentricities have undergone mergers, although
this estimate is only a lower limit and the overall effect of merging
may have been significantly stronger.
For systems in a multi-level hierarchy merging should recur.
If the relative number of double systems in groups and clusters
is 2 and the
time for their merging is
m, then
over cosmological time ( =
1) the mean number of mergers will be given by the ratio
<m>
2 /
m.
For 2 = 0.12
and a typical merger time
m = 0.1 - 0.2
we have <m>
1. At earlier epochs galaxies or protogalaxies probably had a rather
fragile structure and were located very close one to another.
Therefore, the early rate of pairwise merging of systems should
have been much higher
(m < 0.1,
<m> > 1), and many present-day
galaxies may be viewed as the products of multiple mergers.
This scenario of rapid evolution of systems of galaxies where a
dominant role is played by pairs suggests a significant number of possible
observational tests. Among them may be noted the following:
the form of the bright end of the luminosity function of galaxies, the
dependence of mean luminosity on morphological type, the radial segregation
of elliptical and spiral galaxies within systems, the properties of the
correlation function for galaxies
( g)
and for pair centers
(p),
the effect of evolution on the numbers and luminosities of galaxies and
their distribution at faint apparent magnitudes, and, last but not least,
the problem of the angular momenta of galaxies.
Selected aspects of this picture have been examined by
White (1977,
1979),
Fall (1979),
Roos and Norman (1979),
Ishizawa et al. (1983),
Verner and Chernin (1987),
and Veeraraghavan and White
(1985).
g)
and for pair centers
(p),
the effect of evolution on the numbers and luminosities of galaxies and
their distribution at faint apparent magnitudes, and, last but not least,
the problem of the angular momenta of galaxies.
Selected aspects of this picture have been examined by
White (1977,
1979),
Fall (1979),
Roos and Norman (1979),
Ishizawa et al. (1983),
Verner and Chernin (1987),
and Veeraraghavan and White
(1985).
We now have sufficient observational data to decide between violent or tranquil evolution of double galaxies. For the desired determination of the rate of their dynamical evolution, one must include model results which fully represent the actual structure and properties of the motion of galaxies in pairs.
14 Strictly speaking we use not the individual values y and X but their ratio. However, for such a logarithmically large spread in mean projection factors this introduces a negligible difference. Back.
15 This value agrees very well with the relative number of isolated galaxies found from modelling (see table 3 in section 3.1). Back.