


If the GPS and CSS sources do indeed evolve into larger sources, then
their global properties as well as those of the large-scale sources
(section 6) must constrain their evolution
(Carvalho 1985;
Fanti et al. 1995;
Begelman 1996;
Readhead et al. 1996a;
O'Dea & Baum 1997).
Fanti et al. (1995)
have given the relationship between the observed variation of number
with linear size, and that along evolutionary tracks assuming power-law
dependencies of the parameters. Fanti et al. assume that velocity
depends on linear size l as v
 lx, and power on linear size as P
l-h and the luminosity function is
lx, and power on linear size as P
l-h and the luminosity function is
 (P)
P-b. Then the relationship between the
exponents is given by
(P)
P-b. Then the relationship between the
exponents is given by
 |
(10) |
where m is the exponent on the observed relation dN /
dl
l-m, m = 1 -
 , and
is the slope measured
on Figure 13 (see also
O'Dea & Baum 1997).
, and
is the slope measured
on Figure 13 (see also
O'Dea & Baum 1997).
The constraints from the data (Fig. 13) are shown in Figure 21 assuming slopes of 0 and 0.4 for the GPS/CSS and large-scale sources, respectively. As discussed in section 6, depending on which points are chosen, a range of slopes can fit the data. Fits to all the data with a single line result in a slope near 0.2, which is bracketed by the values of 0 and 0.4 shown in Figure 21. As an illustration of the constraints that can be placed on evolution, I also show the prediction of the Begelman (1996) self-similar source model. The location of the intersection between the constraints and the model are where Begelman's model is consistent with the data.
 |
Figure 21. Constraints on evolution models from N(l) vs. l. The GPS and CSS sources are shown by the solid line, and the LRL 3CR sources by the dotted line. The dashed line is the prediction from the Begelman model. Adapted from O'Dea & Baum (1997). |
The observations are consistent with a picture in which the sources
expand with constant velocity, and the radio power drops as roughly
P
l-0.5. A possible evolutionary track is illustrated in
Figure 22. The implied drop of radio power over
the lifetime of the sources is at least an order of magnitude and
suggests that at least some of the GPS and CSS sources will evolve into
lower luminosity FR 1 radio sources.
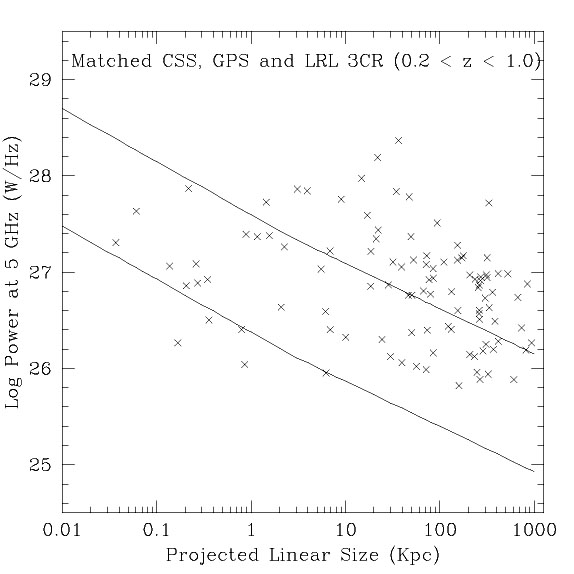 |
Figure 22. Illustrative plot of possible evolutionary tracks on the P vs. l plot. Adapted from O'Dea & Baum (1997). |
Note that if the suggested flatter slope of N versus l (Fig. 13) for the GPS and CSS is correct, this has implications for the evolution of the sources. Reynolds & Begelman (1997) have suggested that the radio sources are intermittent on timescales of ~ 104-105 yr. (11) Alternatively, the flatter slope could mean that for a given variation of velocity with linear size, the GPS and CSS sources decline in radio power somewhat more rapidly than the large-scale sources. O'Dea & Baum (1997) have suggested that this is due to a drop in the efficiency of conversion of jet kinetic energy into radio luminosity as the source expands and ages (cf. Eilek & Shore 1989; Gopal-Krishna & Wiita 1991). As discussed in section 11.2, a modest increase in efficiency for the smaller sources is not ruled out by the current data.
11 Intermittence was previously suggested by Baum et al. (1990) to explain the GPS sources with extended radio structure. Back.