


2.3. The observed SEDs of dusty galaxies
Information about the submm SEDs of galaxies has been
gathered from targeted mm and submm observations of samples of
low-redshift far-IR-selected galaxies from the IRAS catalog,
(Andreani and Franceschini,
1996;
Dunne et al., 2000;
Lisenfeld et al., 2000;
Dunne and Eales, 2001),
and from far-IR and submm observations of high-redshift
galaxies (see Fig. 2). The
most extensive local survey (SLUGS;
Dunne et al., 2000)
consists of 850-µm SCUBA observations
of 104 galaxies selected from the low-redshift IRAS
Bright Galaxy Sample (BGS;
Soifer et al., 1987).
After fitting single-temperature

 B SEDs to
the galaxies, Dunne et al. found that
B SEDs to
the galaxies, Dunne et al. found that
 = 1.3 ±
0.2 and Td = 38 ± 3 K
described the sample as a whole,
with a natural dispersion in the properties from galaxy to galaxy. This
IRAS-selected sample could be
biased against less dusty galaxies. Dunne et al. are
currently addressing this issue by observing a complementary sample
of B-band selected low-redshift galaxies, which should be
representative of optically luminous low-redshift galaxies as a whole.
= 1.3 ±
0.2 and Td = 38 ± 3 K
described the sample as a whole,
with a natural dispersion in the properties from galaxy to galaxy. This
IRAS-selected sample could be
biased against less dusty galaxies. Dunne et al. are
currently addressing this issue by observing a complementary sample
of B-band selected low-redshift galaxies, which should be
representative of optically luminous low-redshift galaxies as a whole.
Note, however, that when fitting only a few datapoints, there is a
significant correlation between values of
and
Td that can
account for the data (left panel of Fig. 3). This
can lead to
ambiguity in the results, further emphasizing the difficulty in
associating the dust mass or temperature inferred from a galaxy
SED with the real physical properties of the galaxy.
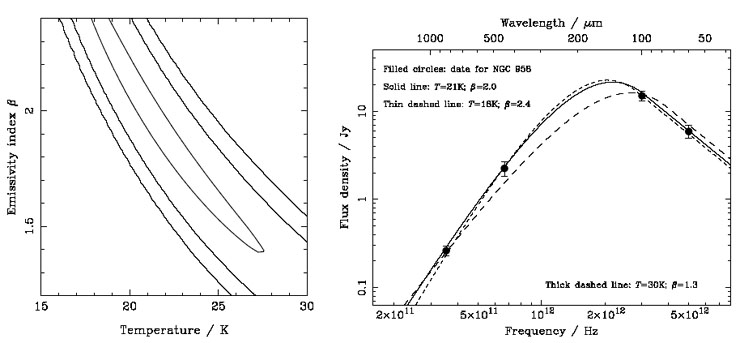 |
Figure 3. An illustration of some of the
issues involved in describing the SEDs of dusty galaxies. On the left
is a probability contour plot that shows the 0.5, 5 ×
10-3 and 5 × 10⁻⁵ probability contours
for a fit to an SED model defined by the variable
parameters |
The addition of 450-µm data for 19 of the 104
galaxies in the SLUGS sample
(Dunne and Eales, 2001),
tends to split the galaxy SEDs
into two categories: those that retain a definite 40-K
spectrum after including the 450-µm data,
and those for which cooler single-temperature SEDs, more similar to
the SEDs of normal spiral galaxies, then provide a better
fit. The first group are typically
the more luminous galaxies in the sample, while the second
includes 3 of the 5 lowest luminosity galaxies from the sample.
Dunne and Eales (2001)
propose a two-temperature model to account
for the changes in light of the new 450-µm data; however, a
cooler single-temperature model with a larger value of
provides a
fit of similar quality. The results for one of the most significantly
different fits is shown in the right-hand panel of
Fig. 3.
With the addition of the 450-µm data, the nature of the SEDs of
low-redshift, low-luminosity galaxies become more diverse. However,
the more luminous galaxies, which are likely to be the most similar to
typical high-redshift submm galaxies, are still described
reasonably well by the original
Dunne et al. (2000)
38-K SED.
An alternative approach is to determine an
SED that can describe the observed flux density distribution of galaxies in
the far-IR and submm wavebands, which are sensitive
to galaxies at low, moderate and high redshifts
(Blain et al., 1999b;
Trentham et al., 1999;
Barnard and Blain, 2002).
Using the
B functional
form, values of
 1.5 and
Td 40
K are required to
provide a good description of the data, rather similar to the values
derived for temperatures of individual low-redshift luminous dusty
galaxies in
Dunne et al. (2000) and
Lisenfeld et al. (2000),
and for both the small number of high-redshift submm-selected galaxies
with known redshifts and mid-IR spectral constraints
(Ivison et al., 1998a,
2000a)
and typical high-redshift QSOs (for example
Benford et al., 1999).
These temperatures are significantly less than those determined for the
most extreme high-redshift galaxies
(Lewis et al., 1998),
and significantly greater than the
Td = 17 K inferred from the maps of
the Milky Way made using the all-sky survey from the
FIRAS instrument on the Cosmic Background Explorer (COBE)
satellite in the early 1990's
(Reach et al., 1995).
Note that there are examples of moderate-redshift
infrared-selected galaxies with both hotter and colder typical dust
temperatures than 40 K: see
Deane and Trentham
(2001) and
Chapman et al. (2002d)
respectively. At present
it seems likely that a 40-K dust temperature is a reasonable assumption
for high-redshift submm-selected galaxies.
1.5 and
Td 40
K are required to
provide a good description of the data, rather similar to the values
derived for temperatures of individual low-redshift luminous dusty
galaxies in
Dunne et al. (2000) and
Lisenfeld et al. (2000),
and for both the small number of high-redshift submm-selected galaxies
with known redshifts and mid-IR spectral constraints
(Ivison et al., 1998a,
2000a)
and typical high-redshift QSOs (for example
Benford et al., 1999).
These temperatures are significantly less than those determined for the
most extreme high-redshift galaxies
(Lewis et al., 1998),
and significantly greater than the
Td = 17 K inferred from the maps of
the Milky Way made using the all-sky survey from the
FIRAS instrument on the Cosmic Background Explorer (COBE)
satellite in the early 1990's
(Reach et al., 1995).
Note that there are examples of moderate-redshift
infrared-selected galaxies with both hotter and colder typical dust
temperatures than 40 K: see
Deane and Trentham
(2001) and
Chapman et al. (2002d)
respectively. At present
it seems likely that a 40-K dust temperature is a reasonable assumption
for high-redshift submm-selected galaxies.
Inevitably, however, there will be a population of hotter high-redshift galaxies (Wilman et al., 2000; Trentham and Blain, 2001). These galaxies would be underrepresented in existing submm surveys, but may make a significant contribution to the 240-µm background radiation intensity (Blain and Phillips, 2002). Further observational information to test the assumption of a 40-K dust temperature is keenly awaited. As we discuss below, in Section 2.6, the assumed dust temperature has a significant effect on the selection function of submm galaxy surveys, and on the properties that are inferred for the galaxies that are found in these surveys.
 = - 1.95,
taking into account four SED datapoints for the
galaxy
= - 1.95,
taking into account four SED datapoints for the
galaxy