


5.2. Observational tests of models
The key observational test of models of submm-wave galaxy formation is the redshift distribution, which is know in outline from radio-submm observations (Smail et al., 2000). Determining the redshift distribution is a key goal of extensive ongoing follow-up observations, but the process has proved to be difficult and time-consuming, as documented extensively by Smail et al. (2002). The crucial problems are the faintness of the counterparts, combined with the relatively poor positional accuracy of the centroids of the submm galaxies, which are unresolved due to the coarse spatial resolution of existing submm images.
Detailed measurements of the counts of galaxies at both brighter and fainter flux densities than those shown in Fig. 9 would also constrain models. However, determining the bright counts requires a large-area survey, which is likely to be relatively inefficient (Fig. 23), while determining the faint counts requires greater angular resolution than can be provided by the telescopes used to make existing surveys, to avoid source confusion. The very bright counts will certainly be probed directly towards the end of the decade by the Planck Surveyor all-sky survey at a resolution of 5 arcmin, and sooner by large-area surveys using forthcoming large-format mm/submm-wave bolometer arrays on ground-based telescopes, including BOLOCAM (Glenn et al., 1998) and SCUBA-II. Limits on the bright submm-wave counts can be imposed from the number of candidate point sources that can be found in large-area submm maps of Galactic fields (Pierce-Price et al., 2001; Barnard et al., 2002). The faint counts will ultimately be determined directly using the SMA, CARMA and ALMA interferometers.
The results of deep ISO surveys have been regularly cited as a
useful constraint on galaxy evolution
(Rowan-Robinson et al.,
1997;
Xu, 2000;
Chary and Elbaz, 2001).
This is certainly true out to
z  1. However, when
estimating a total luminosity density from 15-µm data,
it is vital that the correct SED is used to extrapolate
to longer wavelengths, as it is easy to overestimate the
amount of luminosity associated with a 15-µm source by
assuming a mid-IR SED that is too steep. For example, compare the
inferred luminosity density results at redshifts
z 0.7 quoted by
Rowan-Robinson et
al. (1997)
and Flores et al. (1999).
The results differ by a factor of 5;
Flores et al. (1999)
obtain the lower result by
using radio observations to constrain the total luminosity
of the galaxies detected at 15 µm.
Extrapolating mid-IR data towards the peak
of the SED at longer wavelengths is more difficult than
extrapolating submm observations to fix the position of
the peak of the SED that lies at
shorter wavelengths. This is both because the form of the SED is
intrinsically simpler on the long-wavelength side of
the peak, and because the well-determined spectrum of the far-IR background
radiation can be used to constrain the luminosity-averaged dust
temperature of the submm galaxies. Mid-IR observations with
SIRTF after 2002 will provide much more information about the
SEDs and evolution of dusty galaxies to redshifts
z 2.
1. However, when
estimating a total luminosity density from 15-µm data,
it is vital that the correct SED is used to extrapolate
to longer wavelengths, as it is easy to overestimate the
amount of luminosity associated with a 15-µm source by
assuming a mid-IR SED that is too steep. For example, compare the
inferred luminosity density results at redshifts
z 0.7 quoted by
Rowan-Robinson et
al. (1997)
and Flores et al. (1999).
The results differ by a factor of 5;
Flores et al. (1999)
obtain the lower result by
using radio observations to constrain the total luminosity
of the galaxies detected at 15 µm.
Extrapolating mid-IR data towards the peak
of the SED at longer wavelengths is more difficult than
extrapolating submm observations to fix the position of
the peak of the SED that lies at
shorter wavelengths. This is both because the form of the SED is
intrinsically simpler on the long-wavelength side of
the peak, and because the well-determined spectrum of the far-IR background
radiation can be used to constrain the luminosity-averaged dust
temperature of the submm galaxies. Mid-IR observations with
SIRTF after 2002 will provide much more information about the
SEDs and evolution of dusty galaxies to redshifts
z 2.
In Fig. 22 we show the deep 15-µm
counts predicted by models designed to account for the submm data
(Blain et al., 1999b,
c),
updated to the current data and cosmology.
If the mid-IR SED is chosen appropriately, then the fit is quite
acceptable. Including PAH emission features or varying the mid-IR SED index
 has
relatively little effect on the result. The same approach can be used to
estimate the deep cm-wave radio counts. If we assume just the
form of the radio-far-IR correlation
(Condon, 1992),
without any fine tuning, and a radio SED of the form
f
has
relatively little effect on the result. The same approach can be used to
estimate the deep cm-wave radio counts. If we assume just the
form of the radio-far-IR correlation
(Condon, 1992),
without any fine tuning, and a radio SED of the form
f
 -0.6, then
the predicted 8.4-GHz counts brighter than 10 µJy,
based on the submm-based models are 1.05 and 0.98 arcmin-2
respectively; the corresponding power-law indices of the
count function N( > S)
S are
= - 1.4 and -1.3
respectively. The results in both models match
the observed 8.4-GHz 10-µJy count of 1.01 ± 0.14
arcmin-2 with
= - 1.25 ± 0.2
(Partridge et al., 1997).
The reasonable agreement between the predictions of the
models, which are constrained only by
observations in the submm and far-IR, and the observed
deep mid-IR and radio counts confirms that the models are reliable.
The source confusion estimates
shown in Fig. 13, which are based
on the same models, should thus be reliable over a wide wavelength range
from about 10 cm to 10 µm.
-0.6, then
the predicted 8.4-GHz counts brighter than 10 µJy,
based on the submm-based models are 1.05 and 0.98 arcmin-2
respectively; the corresponding power-law indices of the
count function N( > S)
S are
= - 1.4 and -1.3
respectively. The results in both models match
the observed 8.4-GHz 10-µJy count of 1.01 ± 0.14
arcmin-2 with
= - 1.25 ± 0.2
(Partridge et al., 1997).
The reasonable agreement between the predictions of the
models, which are constrained only by
observations in the submm and far-IR, and the observed
deep mid-IR and radio counts confirms that the models are reliable.
The source confusion estimates
shown in Fig. 13, which are based
on the same models, should thus be reliable over a wide wavelength range
from about 10 cm to 10 µm.
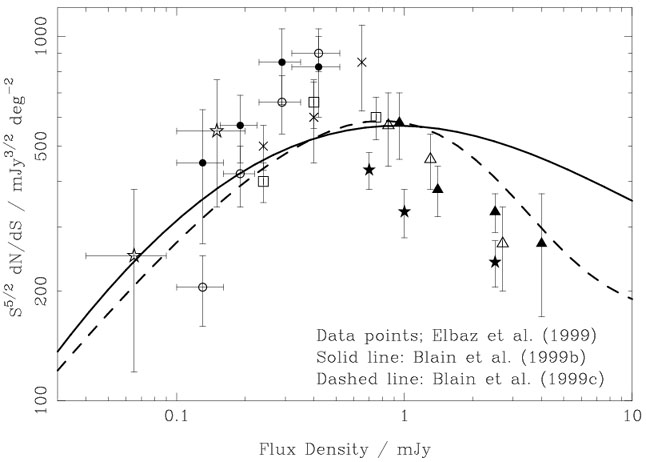 |
Figure 22. A summary of observed
(Elbaz et al., 1999)
and predicted
(Blain et al., 1999b,
c)
differential counts of galaxies in the 15-µm
ISO band. The model predictions assume only a power-law SED in
the mid-IR, with
f |