


Although the simple isothermal sphere can reproduce the flatness of the rotation curves of the disks of spiral galaxies at large radii, there are both observational and theoretical arguments in favor of halos which are flattened, rather than spherical. Direct observational evidence for halo flattening that has come from studies of individual galaxies is somewhat scarce, however, owing to the fact that there are relatively few galaxies for which the shape of the halo potential can be probed directly. Nevertheless, the evidence for flattened halos of individual galaxies is diverse and includes such observations as the dynamics of polar ring galaxies, the geometry of X-ray isophotes, the flaring of HI gas in spirals, the evolution of gaseous warps, and the kinematics of Population II stars in our own Galaxy. In particular, studies of disk systems which probe distances of order 15 kpc from the galactic planes suggest that the ratio of shortest to longest principle axes of the halos is c / a = 0.5 ± 0.2 (see, e.g., the comprehensive review by Sackett [100] and references therein). Studies of a number of strong lens galaxies have also suggested that the mass distributions of the lenses are not precisely spherical. For example, Maller et al. [101] found that, provided the disk mass is small compared to the halo mass, the halo of the spiral galaxy which lenses the quasar B1600+434 is consistent with c / a = 0.53. In addition, the 17 strong lens systems studied by Keeton, Kochanek & Falco [102] showed some preference for flattened mass distributions, although extremely flattened (i.e., "disky") mass distributions were ruled out. Finally, a recent analysis of the luminous halos of 1047 edge-on disk galaxies in the SDSS suggests that the old stellar populations of these galaxies consist of moderately flattened spheroids with axis ratios of c / a ~ 0.6 [103].
On the theoretical side, high-resolution simulations
of dissipationless CDM models consistently produce
markedly non-spherical galaxy halos
with a mean projected ellipticity of
 ~ 0.3 (see, e.g.,
[104],
[105]).
It is known, however, that the dark matter will react to the
condensation of baryons during galaxy formation (e.g.,
[106])
and that the resulting increase in the central density leads to a more
spherical shape than if dissipation were not considered (e.g.,
[107]).
Recent simulations performed by Kazantzidis et al.
[108]
show that on scales r < < rvir, the effects
of gas cooling cause a
substantial circularization of the mass density profile,
leading to a projected ellipticity of
~ 0.4 to 0.5 in the
inner regions of the galaxy.
However, on scales r ~ rvir Kazantzidis et al.
[108]
find that the projected ellipticity is
~ 0.3.
Since both the weak lensing shear and satellite dynamics are determined
primarily by the large-scale mass distribution of the halos, the roundness
of the mass distribution on small scales due
to gas cooling should not have a dramatic effect.
From a theoretical standpoint, therefore, it is
not at all unreasonable to expect that
galaxy-galaxy lensing and satellite dynamics should reflect a
significant flattening of the halos.
~ 0.3 (see, e.g.,
[104],
[105]).
It is known, however, that the dark matter will react to the
condensation of baryons during galaxy formation (e.g.,
[106])
and that the resulting increase in the central density leads to a more
spherical shape than if dissipation were not considered (e.g.,
[107]).
Recent simulations performed by Kazantzidis et al.
[108]
show that on scales r < < rvir, the effects
of gas cooling cause a
substantial circularization of the mass density profile,
leading to a projected ellipticity of
~ 0.4 to 0.5 in the
inner regions of the galaxy.
However, on scales r ~ rvir Kazantzidis et al.
[108]
find that the projected ellipticity is
~ 0.3.
Since both the weak lensing shear and satellite dynamics are determined
primarily by the large-scale mass distribution of the halos, the roundness
of the mass distribution on small scales due
to gas cooling should not have a dramatic effect.
From a theoretical standpoint, therefore, it is
not at all unreasonable to expect that
galaxy-galaxy lensing and satellite dynamics should reflect a
significant flattening of the halos.
8.1. Evidence for Flattened Halos from Galaxy-Galaxy Lensing
Unlike a spherically-symmetric lens for which the gravitational lensing
shear is isotropic about the lens center, the shear due to an elliptical
lens is anisotropic about the lens center. Specifically, at a given
angular distance,  ,
from an elliptical lens,
source galaxies which are located closer to the major axis
of the mass distribution of the lens
will experience greater shear than sources which
are located closer to the minor axis (e.g.,
[8]).
Noting this, Natarajan & Refregier
[109]
and Brainerd & Wright
[110]
modeled the dark matter halos of field galaxies as infinite
singular isothermal ellipsoids
and made rough estimates of the sizes of observational data sets which would
be required to detect "anisotropic" galaxy-galaxy lensing and, hence,
to constrain the net flattening of the halo population. Both studies
concluded
that, if the mean flattening of the halos is of order 0.3, then only
a relatively modest amount of imaging data would be necessary to
observe the effects of halo flattening on the weak lensing signal.
,
from an elliptical lens,
source galaxies which are located closer to the major axis
of the mass distribution of the lens
will experience greater shear than sources which
are located closer to the minor axis (e.g.,
[8]).
Noting this, Natarajan & Refregier
[109]
and Brainerd & Wright
[110]
modeled the dark matter halos of field galaxies as infinite
singular isothermal ellipsoids
and made rough estimates of the sizes of observational data sets which would
be required to detect "anisotropic" galaxy-galaxy lensing and, hence,
to constrain the net flattening of the halo population. Both studies
concluded
that, if the mean flattening of the halos is of order 0.3, then only
a relatively modest amount of imaging data would be necessary to
observe the effects of halo flattening on the weak lensing signal.
In estimating the amount of data that would be required to detect
anisotropic galaxy-galaxy lensing, both Natarajan & Refregier
[109]
and Brainerd & Wright
[110]
made the simplifying assumption that each distant source galaxy is
lensed by only
one foreground galaxy. However, for a somewhat deep imaging survey
(Ilim ~ 23), the simulations of galaxy-galaxy
lensing performed by Brainerd, Blandford & Smail
[13]
indicated that most of the galaxies with magnitudes in the range
22  I
23 would
have been lensed at a comparable level by two or
more foreground galaxies. In a realistic data set, these
multiple weak deflections might significantly affect the signal-to-noise
that could be achieved when attempting to detect anisotropic galaxy-galaxy
lensing. This motivated Wright & Brainerd
[111]
to carry out detailed
Monte Carlo simulations of galaxy-galaxy lensing by flattened halos,
including the effects of multiple weak deflections
on the final images of distant galaxies.
I
23 would
have been lensed at a comparable level by two or
more foreground galaxies. In a realistic data set, these
multiple weak deflections might significantly affect the signal-to-noise
that could be achieved when attempting to detect anisotropic galaxy-galaxy
lensing. This motivated Wright & Brainerd
[111]
to carry out detailed
Monte Carlo simulations of galaxy-galaxy lensing by flattened halos,
including the effects of multiple weak deflections
on the final images of distant galaxies.
Wright & Brainerd
[111]
showed that multiple weak deflections
create systematic effects which could hinder
observational efforts to use weak lensing to constrain the projected
shapes of the dark matter halos of field galaxies. They modeled the dark
matter halos of lens galaxies as truncated singular isothermal
ellipsoids, and for an observational data set in which the galaxies had
magnitudes in the range
19 I
23, they found that
multiple deflections resulted in strong correlations
between the post-lensing image shapes of most foreground-background
pairs of galaxies. Imposing a simple redshift cut during
the analysis of the data set,
zl < 0.5 and zs > 0.5, was
sufficient to reduce the correlation
between the final images of lenses and sources to the point that
the expected anisotropy in the weak lensing signal was detectable via
a straightforward average. Wright & Brainerd
[111]
concluded that previous theoretical calculations
of weak lensing due to flattened halos had considerably underestimated the
sizes of the observational
data sets which would be required to detect this effect. In particular,
for a multi-color survey in which the galaxies had apparent magnitudes of
19 I
23 and the
imaging quality was modest, Wright & Brainerd
[111]
found that a 4 detection
could be obtained with a survey area of order 22 sq. deg., provided
photometric redshift estimates were made for the galaxies, the
typical error in zphot was
0.1, and only
source galaxies with azimuthal coordinates that were within
± 20° of the lens symmetry axes were used in the data analysis.
detection
could be obtained with a survey area of order 22 sq. deg., provided
photometric redshift estimates were made for the galaxies, the
typical error in zphot was
0.1, and only
source galaxies with azimuthal coordinates that were within
± 20° of the lens symmetry axes were used in the data analysis.
To date, only one intrepid team of investigators has claimed a detection
of flattened halos from observations of galaxy-galaxy lensing. In
their analysis of the RCS galaxy-galaxy lensing signal Hoekstra,
Yee & Gladders
[48]
took the approach of modeling the lens galaxies
as having halos with ellipticities that scaled linearly with the
ellipticity of the image of the lens:
halo =
f
light.
Further, they assumed that the major axis of the lens image was aligned
with the major axis of the halo in projection on the sky. This is a
sensible assumption provided the majority of the lenses are relaxed
systems, and it is justified at least partially by the observations
of Kochanek
[112]
who found that the major axes of the mass and
light of strong lens galaxies were aligned to within ~ 10°
in projection on the sky.
Hoekstra, Yee & Gladders
[48]
performed a maximum likelihood analysis and concluded that spherical halos
(i.e., f = 0) could be ruled out at the 99.5% confidence level
on the basis of their weak lensing signal (see
Figure 13).
Formally, Hoekstra, Yee & Gladders
[48]
found f = 0.77+0.18-0.21.
Since the mean ellipticity of the lens images in their study was
<light> = 0.414, this implies a mean halo
ellipticity of <halo> = 0.33+0.07-0.09
and a projected axis ratio of
c / a = 0.67+0.09-0.07. This is in
excellent agreement with the expectations for CDM halos, as well
as previous observational constraints on halo flattening obtained
on large physical scales (see, e.g.,
[100]).
While it may yet be a bit premature to call this result a "definitive"
measurement of the flattening of field galaxy halos, it is certainly
impressive and the statistics will only improve as weak lensing
surveys become larger.
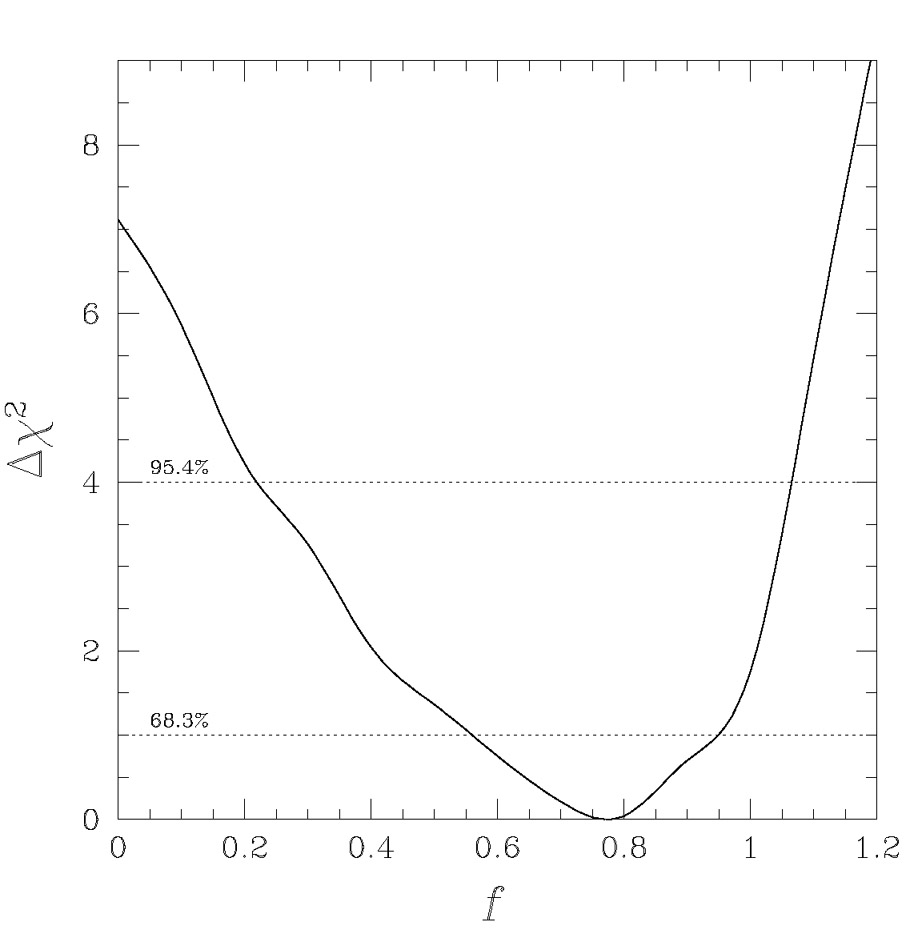 |
Figure 13. Confidence bounds with which
spherical halos can be rejected on the
basis of galaxy-galaxy lensing in the RCS
[48].
Halos of lens galaxies were modeled as having ellipticities of
|
8.2. Evidence for Flattened Halos from Satellite Galaxies
In the case of substantially flattened halos of host galaxies, one would naively expect that satellite galaxies would show a somewhat anisotropic distribution about the host. That is, barring possible effects due to infall rates and orbital decay, one would expect the satellites to have some preference for being located near to the major axis of the host's halo. Until very recently, however, such an observation had not been confidently made and, moreover, a preference for clustering of satellite galaxies along the minor axes of host galaxies has been reported at a statistically significant level by a handful of authors ([20], [68], [113]). The apparent alignment of satellite galaxies with the minor axes of the host galaxies is often referred to as the Holmberg effect and in the naive picture of satellite orbits in flattened potentials, observations of the Holmberg effect lead to the uncomfortable conclusion that not only is the halo mass flattened, but it is also anti-aligned with the luminous regions of the galaxy.
While one is tempted to dismiss the minor axis clustering of satellites
observed by Zaritsky et al.
[20]
and Holmberg
[113]
as being due to some combination of selection biases and very small sample
sizes, it is not easy to use this argument for the results of
Sales & Lambas
[68].
In their study, Sales & Lambas
[68]
selected hosts and satellites from the final data release of
the 2dFGRS, with a resulting sample
size of 1498 hosts and 3079 satellites. The satellites were constrained
to be within projected radii
rp  500
kpc of their host and to be within a velocity difference
|dv| < 500 km sec-1. Further, host
images were required to have eccentricities of at least 0.1 in order
that the orientation of their major axes be well-determined. When Sales
& Lambas
[68]
searched their entire sample for anisotropies in the distribution
of satellites about 2dFGRS hosts, their results were consistent with
an isotropic distribution. However, when they
restricted their sample to only hosts
and satellites whose radial velocities differed by
|dv| < 160 km sec-1, an apparently strong detection
of the Holmberg effect (i.e., minor axis clustering of the satellites)
was found.
500
kpc of their host and to be within a velocity difference
|dv| < 500 km sec-1. Further, host
images were required to have eccentricities of at least 0.1 in order
that the orientation of their major axes be well-determined. When Sales
& Lambas
[68]
searched their entire sample for anisotropies in the distribution
of satellites about 2dFGRS hosts, their results were consistent with
an isotropic distribution. However, when they
restricted their sample to only hosts
and satellites whose radial velocities differed by
|dv| < 160 km sec-1, an apparently strong detection
of the Holmberg effect (i.e., minor axis clustering of the satellites)
was found.
More recently, Brainerd
[64]
investigated the distribution
of satellites about hosts in the second data release of the SDSS.
She selected her samples using three different criteria: (1) the
criteria used by Sales & Lambas
[68]
in their investigation of
the Holmberg effect for 2dFGRS galaxies, (2) the criteria used
by McKay et al.
[65]
and Brainerd & Specian
[66]
in their
analyses of satellite dynamics in the SDSS and 2dFGRS, respectively,
and (3) the selection criteria used by Zartisky et al.
[20]
in their investigation of the Holmberg effect. In addition, Brainerd
[64]
restricted the analyses to hosts with ellipticities
 0.2 and satellites that
were found within a projected radius of 500 kpc. The three selection
criteria lead to samples of: (1) 1351 hosts and 2084 satellites,
(2) 948 hosts and 1294 satellites, and (3) 400 hosts and 658 satellites
respectively.
0.2 and satellites that
were found within a projected radius of 500 kpc. The three selection
criteria lead to samples of: (1) 1351 hosts and 2084 satellites,
(2) 948 hosts and 1294 satellites, and (3) 400 hosts and 658 satellites
respectively.
In all three samples, Brainerd
[64]
found that the distribution of satellites about their hosts was
inconsistent with an isotropic distribution.
Formally, when a Kolmogorov-Smirnov test was applied to the
distribution of satellite locations, an
isotropic distribution was rejected at a confidence level of > 99.99%
for sample 1, > 99.99% for sample 2, and 99.89% for sample 3.
Further, the mean angle between the major
axis of the host and the direction vector on the sky that connected the
centroids of the hosts and satellites was found to be
< > =
41.6° ± 0.6° for sample 1,
<> =
41.6° ± 0.7° for sample 2, and
<> =
41.6° ± 1.0° for
sample 3. That is, a clear anisotropy in the distribution of satellites
about the hosts was seen, and the satellites showed a preference
for being aligned with the major axis of the host rather than
the minor axis (see Figure 14).
In addition, Brainerd
[64]
investigated the dependence of
<>
with projected radius on the sky and found that the majority of the
anisotropy arose on small scales
( 200 kpc) in all
three samples (see Figure 15). In other words, the
anisotropy was detected on physical scales that are comparable to the
expected virial radii of large, bright galaxies. On scales much
larger than the expected virial radii of galaxy-sized halos
(rp ~ 400 kpc to 500 kpc), the distribution of
satellites about
the SDSS hosts was consistent with an isotropic distribution at the
1 level.
> =
41.6° ± 0.6° for sample 1,
<> =
41.6° ± 0.7° for sample 2, and
<> =
41.6° ± 1.0° for
sample 3. That is, a clear anisotropy in the distribution of satellites
about the hosts was seen, and the satellites showed a preference
for being aligned with the major axis of the host rather than
the minor axis (see Figure 14).
In addition, Brainerd
[64]
investigated the dependence of
<>
with projected radius on the sky and found that the majority of the
anisotropy arose on small scales
( 200 kpc) in all
three samples (see Figure 15). In other words, the
anisotropy was detected on physical scales that are comparable to the
expected virial radii of large, bright galaxies. On scales much
larger than the expected virial radii of galaxy-sized halos
(rp ~ 400 kpc to 500 kpc), the distribution of
satellites about
the SDSS hosts was consistent with an isotropic distribution at the
1 level.
 |
Figure 14. Normalized probability
distribution of the location
of satellite galaxies relative to the major axes of host galaxies
in the second data release of the SDSS
[64].
Dashed line shows the expectation for an isotropic distribution.
Formal confidence levels at which isotropic distributions
can be rejected via
|
Aside from the Brainerd [64] claim of "planar" (rather than "polar") alignment of satellites with the symmetry axes of their hosts, there has been only one other similar claim. Valtonen, Teerikorpi & Argue [114] found a tendency for compact satellites to be aligned with the major axes of highly-inclined disk galaxies; however, their sample consisted of only 7 host galaxies. Although it is extremely tempting to accept its veracity based upon an intuitive sense that planar alignment of satellites is more dynamically sensible than polar alignment, it is clear that the Brainerd [64] result is badly in need of independent confirmation.
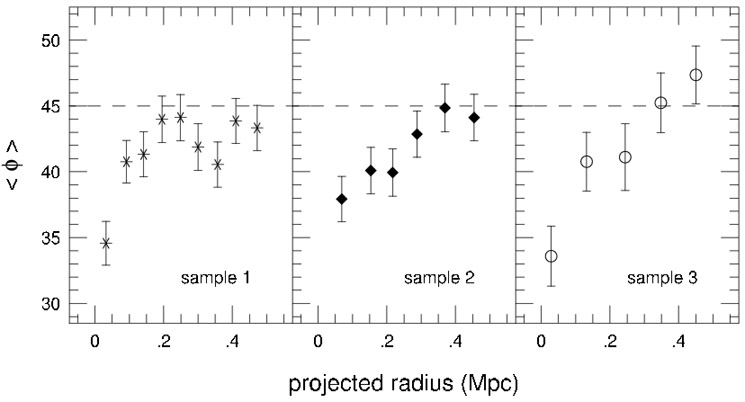 |
Figure 15. Mean orientation of satellite galaxies with respect to the major axes of the hosts as a function of the projected radius for galaxies in the second data release of the SDSS [64]. Dashed line shows the expectation for an isotropic distribution. Here h = 0.7 has been adopted. |
Sales & Lambas [68] used a data set of very similar size (and in one case identical selection criteria) to that of Brainerd [64] yet did not detect any anisotropy in the satellite distribution when they analysed their entire sample. Why this is the case remains a mystery at the moment, but it may be attributable to a combination of two things. First, the velocity errors in the 2dFGRS are typically larger than those in the SDSS (~ 85 km sec-1versus ~ 20 km sec-1 to ~ 30 km sec-1). At some level, this would lead to a higher fraction of interlopers (i.e., false satellites) in the Sales & Lambas [68] sample than in the Brainerd [64] samples. Second, van den Bosch et al. [115] found that when they combined mock redshift surveys with the 2dFGRS, there was a clear absence of satellites at small projected radii in the 2dFGRS. Since the majority of the anisotropy seen by Brainerd [64] appears to come primarily from small scales, it could be that Sales & Lambas [68] simply had too few pairs of hosts and satellites at small separations to detect the anisotropy. Any lack of host-satellite pairs in the 2dFGRS data, however, does not explain why a Holmberg effect was detected by Sales & Lambas [68] when they restricted their analysis to host-satellite pairs with |dv| < 160 km sec-1. When Brainerd [64] imposed the same restriction on her sample 1 (i.e., the sample selected using the Sales & Lambas [68] selection criteria), she found that the satellites with |dv| < 160 km sec-1 displayed an anisotropy that was identical to that of the full sample: a clear alignment of the satellites with the host major axes. The cause of this discrepancy is not at all obvious. It may in part be attributable to the fact that a value of |dv| = 160 km sec-1is comparable to the error in a typical measurement of | dv| for hosts and satellites in the 2dFGRS. Also, work by van den Bosch et al. [69] suggests that the interloper fraction is substantially higher for host-satellite pairs with low values of | dv| than it is for host-satellite pairs with high values of | dv|. It could, therefore, be possible that the Sales & Lambas [68] sample with |dv| < 160 km sec-1is heavily contaminated with interlopers and some strange, unknown selection bias is giving rise to their signal.
Finally, it is worth notating that not only are the observational conclusions about the distribution of satellite galaxies particularly muddy at the moment, so too are the theoretical conclusions. Zaritsky et al. [20] compared their observed Holmberg effect with high-resolution CDM simulations and were unable to recover their observations. Peñarrubia et al. [116] investigated both polar and planar orbits of satellites inside a massive, flattened dark matter halo and found that the planar orbits decayed more quickly that the polar orbits. They therefore suggest that such differences in orbital decay rates could be the origin of the Holmberg effect. Abadi et al. [117] suggest that the Holmberg effect could be caused by the cumulative effects of accretion of satellites by the primary. However, Knebe et al. [118] found that the orbits of satellites of primary galaxies in cluster environments were located preferentially within a cone of opening angle 40° (i.e., planar alignment, not polar). Since the structure of cold dark matter halos is essentially independent of the mass scale of the halo (e.g., [119], [120]), the implication of this result would be a preference for the satellites of isolated galaxies to be aligned with the major axis of the host. All of this in mind, perhaps the only answer to the question "Are either the Sales & Lambas [68] or Brainerd [64] observations of anisotropic satellite distributions consistent with galaxy halos in a CDM universe?" is, for now, "Maybe".
 2 tests are
shown in each panel. Also shown is
<
2 tests are
shown in each panel. Also shown is
<