


12.1.3. Pictorial Presentation of HI Data
In the best cases, the body of HI data on a galaxy can be thought of as a three-dimensional array of intensities, expressed in terms of two angular coordinates in the plane of the sky and radial velocity, which may be referred to as a "data cube." The array values are set by the six-dimensional position-velocity distribution of the galaxian HI. In an idealized form, one can assume that the HI is confined to a thin disk and that axial symmetry holds for both its distribution and velocity field. In panels (a) and (c) of Figure 12.1, both the radial dependence of the HI surface density and the rotation curve are idealized averages of those observed in intermediate-type spirals. Integration of the data cube along the radial velocity axis will yield a map of the column density distribution in the sky; in panel (b) of Figure 12.1, the disk is simulated at a viewing inclination of 60°. The degree of shading represents the column density map. Each member of the superimposed family of lines identifies the locus of points characterized by a constant radial velocity. If instead of integrating over radial velocity, we slice the data cube at a constant value of one of the sky coordinates, for example, slightly off and parallel to the major axis of the tilted disk, we obtain a position-velocity map (d) which mimics the rotation curve (b), blurred by the limitations of spatial and spectral resolution. A slice of the cube at constant velocity will yield a "channel map," as in panel (e): the angular distribution of all galaxian HI whose velocity falls within a narrow velocity range, for example, the span of a single receiver channel, now mimicking one of the loci of panel (b). Finally, observation of the galaxy with a single dish that does not resolve the HI disk will yield an integrated profile of the type shown in panel (f). Of course, real data will be cursed (or blessed ... ) with asymmetries, spiral features, small-scale irregularities, flared or disrupted disks, etc. Sub-arcminute-resolution HI maps are now available for several dozen galaxies, and single-dish profiles for approximately 6000. A catalog of extragalactic HI observations (Richter et al. 1983) is maintained, updated, and available to the astronomical community.
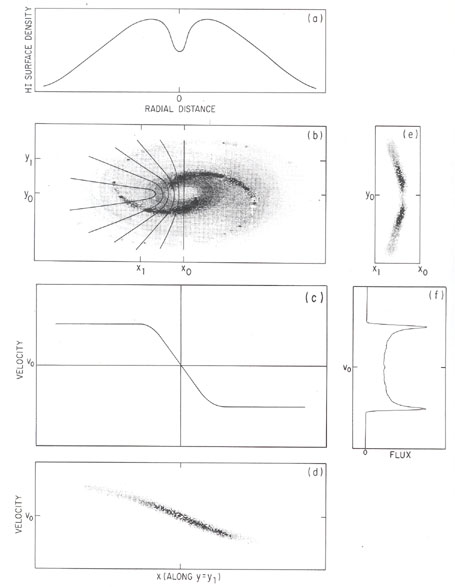 |
Figure 12.1. Pictorial representation of HI data. Panel (b) simulates the distribution of HI in a galaxian disk inclined 60° with respect to the plane normal to the line of sight; the shade intensity is visualized as being proportional to the HI column density across the disk. Superimposed on the left part of the image is a family of curves which identifies isovelocity contours. Because this is a symmetric idealized representation, isovelocity contours on the right part of the galaxies are mirror images of those on the left. Panel (a) illustrates the azimuthally averaged HI surface density, as a function of distance from the center of the galaxy. Panel (c) describes the rotational velocity of the galaxy, as measured along the major axis y = y0; correction of this function by a factor 1 / sin i, where i is the inclination (60° here) of the disk, yields the galaxy's rotation curve. The systemic velocity of the galaxy is V0; the straight, vertical isovelocity contour in panel (b) identifies the locus of points at V = V0. A slice of the galaxy along y = y1 gives a position-velocity map as in panel (d), which in shape (but not in slope) mimics the curve in panel (c); again, intensity of shade is proportional to column density; the smoothing effects of a nonzero angular and spectral resolution have been introduced and are responsible for the breadth of the region with significant emission in panel (d). A "moment map" (or a "channel map"), i.e., the surface density distribution of HI within a narrow-velocity interval (e.g., a single spectral channel) is illustrated in panel (e); the chosen velocity interval in panel (e) corresponds roughly to that between the second and third isovelocity contours plotted in panel (b). Finally, panel (f) shows a spectrum of the whole galaxy, as seen by a single dish that cannot resolve its HI disk. |