


Observational study of normal galaxies at z
 3 is still a
rather recent phenomenon. The last invited review on the subject to this
journal, only 5 years past
(Pritchet 1994),
began with the sad pronouncement that the predicted widespread
population of primeval galaxies had thus far escaped detection. At the
time, our knowledge of individual sources at z > 3 was
restricted to a dozen or so radio galaxies and a larger census of
quasars. Now the pioneering work of Steidel and collaborators has
uncovered several hundreds of Lyman-break systems at z
3 and
spectroscopically confirmed galaxies have recently crossed the z
= 5 barrier. Studies of the earliest epochs of the universe are no
longer restricted to AGN and quasar enthusiasts: since 1997 December
(Franx et al. 1997)
the most distant sources known to astronomers have consistently been
apparently normal, star-forming galaxies. Although this review
emphasizes the search techniques for identifying distant galaxies, we
now briefly consider what has been and can be learned about the early
universe from these studies.
3 is still a
rather recent phenomenon. The last invited review on the subject to this
journal, only 5 years past
(Pritchet 1994),
began with the sad pronouncement that the predicted widespread
population of primeval galaxies had thus far escaped detection. At the
time, our knowledge of individual sources at z > 3 was
restricted to a dozen or so radio galaxies and a larger census of
quasars. Now the pioneering work of Steidel and collaborators has
uncovered several hundreds of Lyman-break systems at z
3 and
spectroscopically confirmed galaxies have recently crossed the z
= 5 barrier. Studies of the earliest epochs of the universe are no
longer restricted to AGN and quasar enthusiasts: since 1997 December
(Franx et al. 1997)
the most distant sources known to astronomers have consistently been
apparently normal, star-forming galaxies. Although this review
emphasizes the search techniques for identifying distant galaxies, we
now briefly consider what has been and can be learned about the early
universe from these studies.
7.1. Surface Densities of High-Redshift Galaxies
Our various types of distant galaxies may be illustrative of peculiar, rare denizens of the cosmic past (the few powerful steep-spectrum radio sources at z > 4), or they may be more modest star-forming citizens, representative of an era when normal galaxies were modest fractions of L* and M*, typical luminosities and masses of the current cosmic epoch near z = 0.
In Table 5 we summarized the measured (estimated) surface densities of the various classes of distant sources discussed. Of particular note are the optical/near-infrared selected sources which present our best hope at being identified with precursors of present-day typical galaxies.
Fig. 10 illustrates the cumulative galaxy
surface density as a function of redshift and
I814AB magnitude - i.e., the surface
density of galaxies of redshift greater than a given redshift for
different magnitude thresholds. For example, to a limiting magnitude of
I814AB = 26,
 5 galaxies
arcmin-2 are expected at z > 3. The histograms
derive from Stony Brook photometric redshift measurements in the
(Northern) HDF. The curves are fits to the measurements, assuming that
the evolving galaxy luminosity function is parameterized by the
Schechter (1976)
luminosity function,
5 galaxies
arcmin-2 are expected at z > 3. The histograms
derive from Stony Brook photometric redshift measurements in the
(Northern) HDF. The curves are fits to the measurements, assuming that
the evolving galaxy luminosity function is parameterized by the
Schechter (1976)
luminosity function,
 |
(1) |
where  (L)
is the number density of galaxies per unit comoving volume and the
characteristic galaxy luminosity at rest-frame 1500 Å,
L*,1500, evolves with redshift as
(L)
is the number density of galaxies per unit comoving volume and the
characteristic galaxy luminosity at rest-frame 1500 Å,
L*,1500, evolves with redshift as
 |
(2) |
Lanzetta (2000)
finds that the photometric redshifts are best fitted with a
characteristic absolute magnitude at 1500 Å
M*,1500z=3 = -19.5 ± 0.5, a
moderately steep luminosity function
 = -1.43 ± 0.05,
and an evolving characteristic luminosity where
= -1.43 ± 0.05,
and an evolving characteristic luminosity where
 = -0.7
± 0.4. Also plotted in Figure 10 is our
estimated lower limit to the surface density of serendipitous sources at
z > 4.5 from long-slit searches (> 1 arcmin-2).
= -0.7
± 0.4. Also plotted in Figure 10 is our
estimated lower limit to the surface density of serendipitous sources at
z > 4.5 from long-slit searches (> 1 arcmin-2).
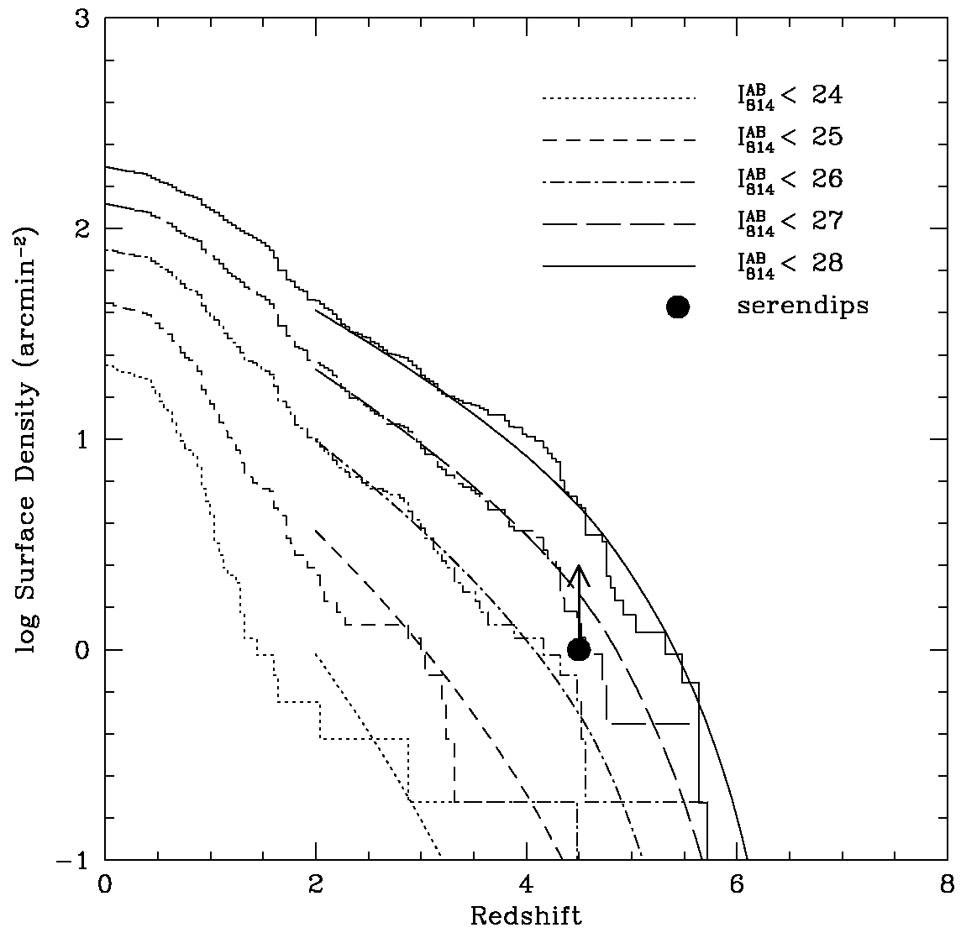 |
Figure 10. Cumulative surface density of
galaxies as a function of redshift and limiting
I814AB magnitude. Histograms are Stony
Brook photometric redshift measurements of the cumulative surface
density of galaxies in the (Northern) HDF. Curves are fits to the
histograms assuming a parametrization of the evolving galaxy luminosity
function (see text). The point at z = 4.5 indicates our estimate
of the lower limit to the observed surface density of high-redshift
serendipitous
Ly |
Substantial caveats regarding this plot should be kept in mind before
extragalactic astronomers halt spectroscopic redshift surveys. First,
the modest angular size of the HDF implies that substantial cosmic
variance may skew the results, particularly at the brightest absolute
magnitudes for each redshift interval.
Gwyn (2000)
notes significant differences in the distribution of photometric
redshifts between the HDF-North and the HDF-South. Similarly, since the
HDF samples a very small volume of the local universe, the low-redshift
surface densities are poorly determined. Second, the redshifts are based
on photometric determinations rather than spectroscopic
determinations. As shown in
Section 4.2, photometric measurements are
fairly robust at the magnitude and redshift ranges tested thus
far. However, photometric redshifts are poorly tested in the difficult
spectroscopic redshift ranges of 1
 z
2.5 and z
4, as well as at
the extremely faint flux limits plotted in
Figure 10. Finally, these surface densities are
based on optically selected objects. If a large population of
dust-enshrouded galaxies exists, they may be missed in the optical
surveys.
z
2.5 and z
4, as well as at
the extremely faint flux limits plotted in
Figure 10. Finally, these surface densities are
based on optically selected objects. If a large population of
dust-enshrouded galaxies exists, they may be missed in the optical
surveys.
 1.0 ×
10-17 ergs cm-2 s-1, 5
1.0 ×
10-17 ergs cm-2 s-1, 5
 ). Figure courtesy