Copyright © 2002 by Annual Reviews. All rights reserved
| Annu. Rev. Astron. Astrophys. 2002. 40:
643-680 Copyright © 2002 by Annual Reviews. All rights reserved |


In the twenty years following the first papers by Sunyaev and Zel'dovich (Sunyaev & Zel'dovich, 1970, 1972) there were few firm detections of the SZE despite a considerable amount of effort (Birkinshaw, 1991). Over the last several years, however, observations of the effect have progressed from low S/N detections and upper limits to high confidence detections and detailed images. In this section we briefly review the current state of SZE observations.
The dramatic increase in the quality of the observations is due to improvements both in low-noise detection systems and in observing techniques, usually using specialized instrumentation to control carefully the systematics that often prevent one from obtaining the required sensitivity. The sensitivity of a low-noise radio receiver available 20 years ago should have easily allowed the detection of the SZE toward a massive cluster. Most attempts, however, failed due to uncontrolled systematics. Now that the sensitivities of detector systems have improved by factors of 3 to 10, it is clear that the goal of all modern SZE instruments is the control of systematics. Such systematics include, for example, the spatial and temporal variations in the emission from the atmosphere and the surrounding ground, as well as gain instabilities inherent to the detector system used.
The observations must be conducted on the appropriate angular scales. Galaxy clusters have a characteristic scale size of order a megaparsec. For a reasonable cosmology, a megaparsec subtends an arcminute or more at any redshift; low redshift clusters will subtend a much larger angle, for example the angular extent of the Coma cluster (z = 0.024) is of order a degree (core radius ~ 10') (Herbig et al, 1995). The detection of extended low surface brightness objects requires precise differential measurements made toward widely separated directions on the sky. The large angular scale presents challenges to control offsets due to differential ground pick-up and atmospheric variations.
3.1. Sources of Astronomical Contamination and Confusion
In designing an instrument for SZE observation, one also needs to take into account several sources of possible contamination and confusion from astronomical sources. One such source is anisotropy of the CMB itself (see Figure 3). For distant clusters with angular extents of a few arcminutes or less it is not a serious problem as the CMB anisotropy is expected (Hu & White, 1997) and indeed found to be damped considerably on these scales (Church et al, 1997, Subrahmanyan et al, 2000, Dawson et al, 2001, see also Holzapfel et al, 1997 and LaRoque et al, 2002) for CMB limits to SZE contamination). For nearby clusters, or for searches for distant clusters using beams larger than a few arminutes, the intrinsic CMB anisotropy must be considered. The unique spectral behavior of the thermal SZE can be used to separate it from the intrinsic CMB in these cases. Note, however, that for such cases it will not be possible to separate the kinetic SZE effects from the intrinsic CMB anisotropy without relying on the very small spectral distortions of the kinetic SZE due to relativistic effects.
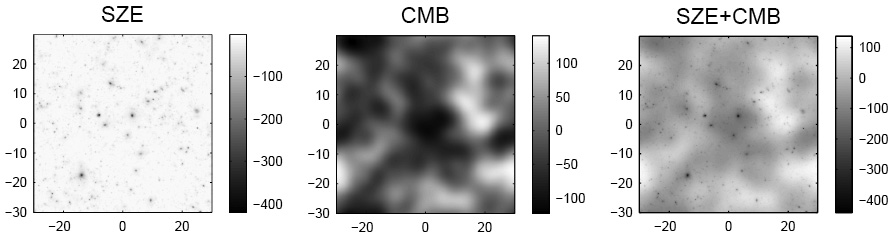 |
Figure 3. Illustration of the
characteristic angular scales of primary
CMB anisotropy and of the SZE. The images each cover one square
degree and the gray scales are in µK. The left panel shows
a image of the SZE from many clusters at 150 GHz (2 mm) obtained from a
state-of-the-art hydrodynamic simulation
(Springel et
al, 2001).
The clusters appear point-like at this angular scale. The center panel
is a realization of CMB anisotopy for a
|
Historically, the major source of contamination in the measurement of
the SZE has been radio point sources. It is obvious that emission
from point sources located along the line of the sight to the cluster
could fill in the SZE decrement, leading to an underestimate. The
radio point sources are variable and therefore must be
monitored. Radio emission from the cluster member galaxies, from the
central cD galaxy in particular, is often the largest source of radio
point source contamination, at least at high radio frequencies
(Cooray et al,
1998,
LaRoque et al,
2002).
The typical spectral index of the radio point sources is
 ~ 0.7 for
S
~ 0.7 for
S
 -, where
S
is the point source flux. In the RJ limit, the SZE flux is proportional
to 2 and therefore
point sources are much less of an issue at higher radio frequencies.
-, where
S
is the point source flux. In the RJ limit, the SZE flux is proportional
to 2 and therefore
point sources are much less of an issue at higher radio frequencies.
Although it is most likely that insufficient attention to radio point sources would lead to the underestimate of the SZE effect, it could also lead to an overestimate. The most obvious example is if unaccounted point sources are in the reference fields surrounding the cluster. An effect due to gravitational lensing has also been pointed out for low frequency observations where the flux from many point sources must be taken into account before a reliable measure of the SZE can be made. Essentially, gravitational lensing increases the efficiency of detecting point sources toward the center of the cluster which could lead to an overestimate of the SZE decrement (Loeb & Refregier, 1997). This effect should be negligible at frequencies greater than roughly 30 GHz.
At frequencies near the null of the thermal SZE and higher, dust
emission from extragalactic sources as well as dust emission from our
own galaxy must be considered. Dust emission from our Galaxy rises
steeply as 2+ with the
observed dust opacity index
found to be
0 < <
2 over the frequencies of interest.
with the
observed dust opacity index
found to be
0 < <
2 over the frequencies of interest.
At the angular scales and frequencies of interest for most SZE
observations, contamination from diffuse Galactic dust emission will
not usually be significant and is easily compensated. Consider
instead the dusty extragalactic sources such as those that have been
found toward massive galaxy clusters with the SCUBA bolometer array
(Smail et al,
1997).
Spectral indices for these sources are estimated to be ~ 1.5 - 2.5
(Blain, 1998,
Fischer &
Lange, 1993).
Sources with 350 GHz (850 µm) fluxes greater than 8 mJy are
common and all clusters surveyed had multiple sources with fluxes
greater than 5 mJy. A 10 mJy source at 350 GHz corresponds to
 TCMB
= 345 µK for 1' beam, or a Compton y-parameter of
6 × 10⁻⁵. The same source scaled to 270 GHz, assuming a
2 spectrum, corresponds
to
TCMB
= 140 µK at 270 GHz for 1' beam and a
y-parameter of 6 × 10⁻⁵. Scaling to the SZE
thermal null at 218 GHz gives 3.9 mJy which corresponds to a
TCMB
= 85 µK for a 1' beam. This in turn translates directly to an
uncertainty in a measurement of the cluster peculiar velocity
(Eq. 6); for a massive cluster with an optical depth of
0.01 and an electron temperature of 10 keV, 85 µK corresponds to
a peculiar velocity of 930 km s-1. The contamination is more
severe for less massive clusters with the dependence scaling as
vpec
R2
/ M
M-1/3
Te-1/2. The contamination scales inversely
with the beam area.
TCMB
= 345 µK for 1' beam, or a Compton y-parameter of
6 × 10⁻⁵. The same source scaled to 270 GHz, assuming a
2 spectrum, corresponds
to
TCMB
= 140 µK at 270 GHz for 1' beam and a
y-parameter of 6 × 10⁻⁵. Scaling to the SZE
thermal null at 218 GHz gives 3.9 mJy which corresponds to a
TCMB
= 85 µK for a 1' beam. This in turn translates directly to an
uncertainty in a measurement of the cluster peculiar velocity
(Eq. 6); for a massive cluster with an optical depth of
0.01 and an electron temperature of 10 keV, 85 µK corresponds to
a peculiar velocity of 930 km s-1. The contamination is more
severe for less massive clusters with the dependence scaling as
vpec
R2
/ M
M-1/3
Te-1/2. The contamination scales inversely
with the beam area.
As with SZE observations at radio frequencies, the analyses of high frequency observations also need to consider the effects of point sources and require either high dynamic angular range, large spectral coverage, or both, to separate the point source emission from the SZE.
All observations sensitive enough to observe the SZE are differential. The primary issue for single dish observations is how to switch the beam on the sky without introducing systematics comparable to the SZE. This beam switching can be accomplished in several ways, including but not limited to Dicke switching between feeds and chopping mirrors which switch or sweep the beam on the sky. With a single dish telescope, modulation of the beam sidelobes can lead to an offset. This offset can be removed if it remains stable enough to be measured on some portion of the sky without a cluster. However, temperature variations of the optics and features on the ground will cause the offset to change as the source is tracked. Therefore, it has become common practice to observe leading and trailing fields when they have the same position with respect to the ground as the source. In this way, any constant or linear drift in offset can be removed at the price of observing efficiency and sensitivity.
The first measurements of the SZE were made with single dish radio telescopes at centimeter wavelengths. Advances in detector technology made the measurements possible, although early observations appear to have been plagued by systematic errors that led to irreproducible and inconsistent results. Eventually, successful detections using beam switching techniques were obtained. During this period, the pioneering work of Birkinshaw and collaborators with the OVRO 40 meter telescope stands out for its production of results which served to build confidence in the technique (Birkinshaw et al, 1978a, 1978b, Birkinshaw, 1991). More recently, leading and trailing beam switching techniques have been used successfully with the OVRO 5 meter telescope at 32 GHz to produce reliable detections of the SZE in several intermediate redshift clusters (Herbig et al, 1995, Myers et al, 1997, Mason et al, 2001). The SEST 15 meter and IRAM 30 meter telescopes have been used with bolometric detectors at 140 GHz and chopping mirrors to make significant detections of the SZE effect in several clusters (Andreani et al, 1996, Andreani et al, 1999, Desert et al, 1998, Pointecouteau et al, 1999, Pointecouteau et al, 2001). The Nobeyama 45 m telescope has also been been used at 21 GHz, 43 GHz, and 150 GHz to detect and map the SZE (Komatsu et al, 2001, 1999).
In the Sunyaev-Zel'dovich Infrared Experiment (SuZIE), pixels in a six element 140 GHz bolometer array are electronically differenced by reading them out in a differential bridge circuit (Holzapfel et al, 1997). Differencing in this way makes the experiment insensitive to temperature and amplifier gain fluctuations that produce 1/f noise. This increased low frequency stability allows SuZIE to observe in a drift scanning mode where the telescope is fixed and the rotation of the earth moves the beams across the sky. Using this drift scanning technique, the SuZIE experiment has produced high signal to noise strip maps of the SZE emission in several clusters (Holzapfel et al, 1997, Mauskopf et al, 2000a).
Because of the high sensitivity of bolometric detectors at millimeter wavelengths, single dish experiments are ideally suited for the measurement of the SZE spectrum. By observing at several millimeter frequencies these instruments should be able to separate the thermal and kinetic SZEs from atmospheric fluctuations and sources of astrophysical confusion. One of the first steps to realizing this goal is the measurement of SZE as an increment. So far, there have been only a few low signal to noise detections at a frequency of approximately 270 GHz. The main reason for the lack of detection is the increased opacity of the atmosphere at higher frequencies. Holzapfel et al (1997) report a detection of Abell 2163 with the SuZIE instrument at 270 GHz. Andreani et al (1996) claim detections of the SZE increment in two clusters, although observations of a third cluster appear to be contaminated by foreground sources or systematic errors (Andreani et al, 1999).
Figure 4 shows the measured SZE spectrum of Abell 2163, spanning the decrement and increment with data obtained from different telescopes and techniques (Holzapfel et al, 1997, Desert et al, 1998, LaRoque et al, 2002). The SZE spectrum is a good fit to the data demonstrating the consistency and robustness of modern SZE measurements.
 |
Figure 4. The measured SZE spectrum of Abell 2163. The data point at 30 GHz is from the Berkeley-Illinois-Marlyand-Association (BIMA) array (LaRoque et al, 2002), at 140 GHz it is the weighted average of Diabolo and SuZIE measurements (Desert et al, 1998, Holzapfel et al, 1997) and at 218 GHz and 270 GHz from SuZIE (Holzapfel et al, 1997). The best fit thermal and kinetic SZE spectra are shown by the dashed line and the dotted lines, respectively, with the spectra of the combined effect shown by the solid line. The limits on the Compton y-parameter and the peculiar velocity are y0 = 3.56+0.41-0.41 +0.27-0.19 × 10⁻⁴ and vp = 410+1030-850 +460-440 km s-1, respectively, with statistical followed by systematic uncertainties at 68% confidence (Holzapfel et al, 1997, LaRoque et al, 2002). |
Single dish observations of the SZE are just beginning to reach their potential and the future is very promising. The development of large format millimeter wavelength bolometer arrays will increase the mapping speed of current SZE experiments by orders of magnitude. The first of this new generation of instruments is the BOLOCAM 151 element bolometer array (Mauskopf et al, 2000b, Glenn et al, 1998) which will soon begin routine observations at the Caltech Submillimeter Observatory. BOLOCAM will observe in drift scanning mode and produce differences between bolometer signals in software. To the extent that atmospheric fluctuations are common across a bolometric array, it will be possible to realize the intrinsic sensitivity of the detectors. Operating from high astronomical sites with stable atmospheres and exceptionally low precipitable water vapor, future large format bolometer arrays have the potential to produce high signal to noise SZE images and search for distant SZE clusters with unprecedented speed.
3.3. Interferometric Observations
The stability and spatial filtering inherent to interferometry has been exploited to make high quality images of the SZE. The stability of an interferometer is due to its ability to perform simultaneous differential sky measurements over well defined spatial frequencies.
An interferometer measures the time averaged correlation of the
signals received by a pair of telescopes - all interferometric arrays
can be thought of as a collection of n(n - 1) / 2
two-element interferometers. For each pair of telescopes, the
interferometer effectively multiplies the sky brightness
at the observing frequency by a cosine, integrates the product and
outputs the time average amplitude of the product (see
Thompson et
al. 2001).
In practice the signals are split and two
correlations are performed with one being performed with a 90 degree
relative phase shift so that the output of the interferometer,
referred to as the visibility, is the complex Fourier transform
(amplitude and phase) of the sky brightness.
The interferometer is therefore only sensitive to angular scales
(spatial frequencies) near B /
 , where the baseline
B is the
projected separation of the telescopes as seen by the source and
is the observation
wavelength. The interferometer response
is essentially insensitive to gradients in the atmospheric emission or
other large scale emission features.
, where the baseline
B is the
projected separation of the telescopes as seen by the source and
is the observation
wavelength. The interferometer response
is essentially insensitive to gradients in the atmospheric emission or
other large scale emission features.
There are several other features which allow an interferometer to achieve extremely low systematics. For example, only signals which correlate between array elements will lead to detected signal. For most interferometers, this means that the bulk of the sky noise for each element will not lead to signal. Amplifier gain instabilities for an interferometer will not lead to large offsets or false detections, although if severe they may lead to somewhat noisy signal amplitude. To remove the effects of offsets or drifts in the electronics as well as the correlation of spurious (non-celestial) sources of noise, the phase of the signal received at each telescope is modulated and then the proper demodulation is applied to the output of the correlator.
The spatial filtering of an interferometer also allows the emission
from radio point sources to be separated from the SZE emission. This
is possible because at high angular resolution
( 10") the
SZE contributes very little flux. This allows one to use long
baselines - which give high angular resolution - to detect and
monitor the flux of radio point sources while using short baselines to
measure the SZE. Nearly simultaneous monitoring of the point sources
is important as they are often time variable. The signal from the
point sources is then easily removed, to the limit of the dynamic
range of the instrument, from the short baseline data which are
sensitive also to the SZE.
10") the
SZE contributes very little flux. This allows one to use long
baselines - which give high angular resolution - to detect and
monitor the flux of radio point sources while using short baselines to
measure the SZE. Nearly simultaneous monitoring of the point sources
is important as they are often time variable. The signal from the
point sources is then easily removed, to the limit of the dynamic
range of the instrument, from the short baseline data which are
sensitive also to the SZE.
Figure 5 illustrates the spatial filtering of an interferometer with data on the galaxy cluster RXJ 1347 - 1145 from the BIMA interferometer outfitted with 30 GHz receivers (e.g., Carlstrom et al. 1996, Carlstrom et al. 2000). Panel a) shows the point source subtracted SZE image (contours) overlaid on a ROSAT X-ray image (color scale). Spatial scales typical of galaxy clusters were stressed before deconvolution. A higher resolution SZE image is shown in panel b), showing the range of spatial scales measured by the interferometer. Panel c) shows the long baseline (high angular resolution) data only. The bright on-center point source is readily apparent.
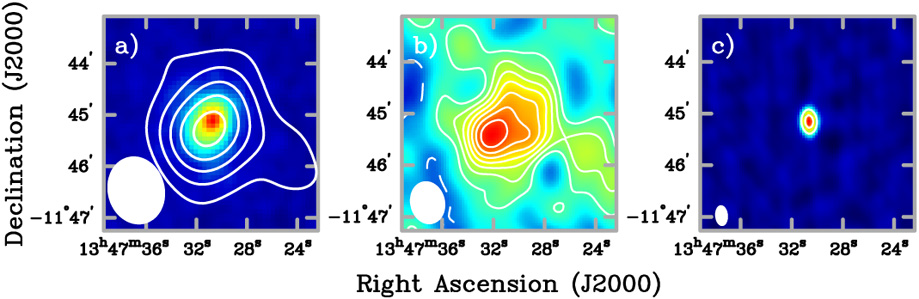 |
Figure 5. Interferometric images of the SZE
of galaxy cluster RXJ 1347-1145 emphasizing different spatial
scales. The FWHM ellipse of
the synthesized beam is shown in the lower left corner of each panel.
(a) Point source subtracted SZE image (contours) overlaid on ROSAT
X-ray image (false color). The contours are multiples of 185 µK
(~ 2 |
For the reasons given above, interferometers offer an ideal way to achieve high brightness sensitivity for extended low-surface brightness emission, at least at radio wavelengths. Most interferometers, however, were not designed for imaging low-surface brightness sources. Interferometers have been built traditionally to obtain high angular resolution and thus have employed large individual elements for maximum sensitivity to small scale emission. As a result special purpose interferometric systems have been built for imaging the SZE (Jones et al, 1993, Carlstrom et al, 1996, Padin et al, 2000). All of them have taken advantage of low-noise high-electron-mobility-transistor (HEMT) amplifiers (Pospieszalski et al, 1995) to achieve high sensitivity.
The first interferometric detection (Jones et al, 1993) of the SZE was obtained with the Ryle Telescope (RT). The RT was built from the 5 Kilometer Array, consisting of eight 13 m telescopes located in Cambridge, England operating at 15 GHz with East-West configurations. Five of the telescopes can be used in a compact E-W configuration for imaging of the SZE (Jones et al, 1993, Grainge et al, 1993, Grainge et al, 1996, Grainge et al, 2000, Saunders et al, 2000, Grainger et al, 2001, Grainge et al, 2001, Jones et al, 2001).
The OVRO and BIMA SZE imaging project uses 30 GHz (1 cm) low noise receivers mounted on the OVRO 1 and BIMA 2 mm-wave arrays in California. They have produced SZE images toward 60 clusters to date (Carlstrom et al, 1996, Carlstrom et al, 2000, Patel et al, 2000, Grego et al, 2000, Reese et al, 2000, Grego et al, 2001, Joy et al, 2001, LaRoque et al, 2002, Reese et al, 2002). A sample of their SZE images is shown in Figure 6. Figure 6 also clearly demonstrates the independence of the SZE on redshift. All of the clusters shown have similar high X-ray luminosities and, as can be seen, the strength of the SZE signals are similar despite the factor of five in redshift. The OVRO and BIMA arrays support two dimensional configuration of the telescopes, including extremely short baselines, allowing good synthesized beams for imaging the SZE of clusters at declinations greater than ~ - 15 degrees.
 |
Figure 6. Deconvolved interferometric SZE
images for a sample of galaxy clusters over a large redshift range
(0.17 |
The Ryle Telescope, OVRO, and BIMA SZE observations are insensitive to the angular scales required to image low redshift clusters, z < < 0.1. Recently, however, the Cosmic Background Imager (CBI) (Padin et al, 2000) has been used to image the SZE in a few nearby clusters (Udomprasert et al, 2000). The CBI is composed of thirteen 0.9 m telescopes mounted on a common platform with baselines spanning 1 m to 6 m. Operating in ten 1 GHz channels spanning 26 - 36 GHz, it is sensitive to angular scales spanning 3' to 20'. The large field of view of the CBI, 0.75 degrees FWHM, makes it susceptible to correlated contamination from terrestrial sources, i.e., ground emission. To compensate, they have adopted the same observing strategy as for single dish observations (Section 3.2), and subtract data from leading and trailings fields offset by ± 12.5 minutes in Right Ascension from the cluster.
Interferometric observations of the SZE, as for single dish observations, are just beginning to demonstrate their potential. Upcoming instruments will be over an order of magnitude more sensitive. The OVRO - BIMA SZE imaging team is now building the Sunyaev-Zel'dovich Array (SZA), consisting of eight 3.5 m telescopes outfitted with 26 - 36 GHz and 85 - 115 GHz low-noise receivers and employing an 8 GHz wideband correlator. The SZA is expected to be operational by the end of 2003. It will be deployed with the existing six 10.4 m OVRO telescopes and nine 6.1 BIMA telescopes at a new high site if the site is ready in time. If not, the array will be deployed in the Owens Valley with the existing OVRO telescopes. The SZA will operate both in a dedicated survey mode and also as a fully heterogeneous array with the larger telescopes. The heterogeneous array will provide unprecedented imaging of the SZE at high resolution.
The Ryle Telescope (RT) SZE team is also building the ArcMinute Imager (AMI), consisting of ten 3.7m telescopes operating at 15 GHz near the RT in Cambridge. It is not planned to operate AMI as a heterogeneous array with the Ryle telescope, but the RT would be used for concurrent point source monitoring.
Additionally, plans have been discussed to reconfigure the CBI to 90 GHz. With its thirteen 0.9 m telescopes and 10 GHz bandwidth, the CBI would be a formidable SZE survey machine. A similar fixed platform interferometer, the Array for Microwave Background Anisotropy (AMiBA), is also being built with nineteen 1.2 m telescopes and operating at 90 GHz. AMiBA, like the reconfigured CBI, would also be ideally suited for performing SZE surveys at moderate resolution.
This next generation of interferometric SZE instruments will conduct deep SZE surveys covering tens and possibly hundreds of square degrees. While not as fast as planned large format bolometric arrays, the interferometers will be able to provide more detailed imaging. In particular, the high resolution and deep imaging provided by the SZA/OVRO/BIMA heterogeneous array (referred to as CARMA, the Combined ARray for Millimeter Astronomy) operating at 90 GHz will provide a valuable tool for investigating cluster structure and its evolution. As discussed in Section 5.5, such studies are necessary before the full potential of large SZE surveys for cosmology can be realized.
1 An array of six 10.4 m telescopes located in the Owens Valley, CA and operated by Caltech Back.
2 An array of ten 6.1 m mm-wave telescopes located at Hat Creek, California and operated by the Berkeley-Illinois-Maryland-Association Back.
 CDM
cosmology. The right panel
illustrates that the SZE can be distinguished readily from primary
CMB anisotropy provided the observations have sufficient angular
resolution.
CDM
cosmology. The right panel
illustrates that the SZE can be distinguished readily from primary
CMB anisotropy provided the observations have sufficient angular
resolution. ), and negative
contours are shown as solid lines. A 1500
), and negative
contours are shown as solid lines. A 1500
 z
z