Copyright © 2002 by Annual Reviews. All rights reserved
| Annu. Rev. Astron. Astrophys. 2002. 40:
643-680 Copyright © 2002 by Annual Reviews. All rights reserved |


In this section we review the use of the SZE for cosmological studies and provide an update on current constraints. Emphasis is given to the cosmology that can, in principle, be extracted from SZE survey yields, as well as the observational and theoretical challenges which must be met before the full potential of SZE surveys for cosmology can be realized.
Future SZE surveys, with selection functions that are essentially a uniform mass limit with redshift (Section 4), will provide ideal cluster samples for pursuing cosmology. A large catalog of distant clusters will enable studies of large scale structure using the same methods as are applied to large catalogs of galaxies. The SZE surveys will also provide a direct view of the high redshift universe. Should clusters exist at redshifts much higher than currently predicted, i.e., if the initial mass fluctuations were non-Gaussian, they will be found by SZE surveys, but missed in even the deepest X-ray observations planned.
The SZE survey samples can be used to increase the precision of the
more traditional applications of the SZE to extract cosmological
parameters, such as cluster distance measurements and the Hubble
constant, the ratio
 B /
M, and
cluster peculiar velocities. These are discussed in
Section 5.1, Section 5.2 and
Section 5.3, respectively. The ability to derive these
parameter depends primarily on the ability to use the SZE and other
cluster observables to constrain or even overconstrain cluster
properties. Precise SZE measurements will allow tests of the
underlying assumptions in these derivations. For example, high
resolution imaging of SZE, X-ray, and lensing, will allow detailed
tests of the assumption of hydrostatic equilibrium
(Miralda-Escude & Babul, 1995,
Loeb & Mao,
1994,
Wu & Fang, 1997,
Squires &
Kaiser, 1996,
Allen &
Fabian, 1998). The
sample yields will also allow the determination of global properties
of clusters and their relationship to observables. For example, it is
already possible to estimate cluster gas temperatures without X-ray
data using current SZE data
(Joy et al, 2001).
B /
M, and
cluster peculiar velocities. These are discussed in
Section 5.1, Section 5.2 and
Section 5.3, respectively. The ability to derive these
parameter depends primarily on the ability to use the SZE and other
cluster observables to constrain or even overconstrain cluster
properties. Precise SZE measurements will allow tests of the
underlying assumptions in these derivations. For example, high
resolution imaging of SZE, X-ray, and lensing, will allow detailed
tests of the assumption of hydrostatic equilibrium
(Miralda-Escude & Babul, 1995,
Loeb & Mao,
1994,
Wu & Fang, 1997,
Squires &
Kaiser, 1996,
Allen &
Fabian, 1998). The
sample yields will also allow the determination of global properties
of clusters and their relationship to observables. For example, it is
already possible to estimate cluster gas temperatures without X-ray
data using current SZE data
(Joy et al, 2001).
The new frontier for SZE cosmology will be in exploiting the ability
of future SZE surveys to measure cleanly the number density of
clusters and its evolution in time. The redshift distribution of
galaxy clusters is critically sensitive to
M and the
properties of
the dark energy. For sufficiently large and deep SZE surveys, it is
possible, in principle, to extract the equation of state of the dark
energy. This is discussed in Section 5.4 and the
theoretical and observational challenges are outlined in
Section 5.5.
5.1. Distance Determinations, Hubble Constant
Several years after the SZE was first proposed
(Sunyaev &
Zel'dovich, 1970,
1972)
it was recognized that the distance to a cluster could be
determined with a measure of its SZE and X-ray emission
(Cavaliere et
al, 1977,
Gunn, 1978,
Silk & White,
1978,
Cavaliere
& Fusco-Femiano, 1978,
Birkinshaw,
1979).
The distance is determined by exploiting the different
density dependencies of the SZE and X-ray emission. The SZE is
proportional to the first power of the density;
 TSZE ~
 d
d ne Te, where ne is
the electron density, Te is the
electron temperature, and
d is along the
line-of-sight. The
distance dependence is made explicit with the substitution
d =
DAd
ne Te, where ne is
the electron density, Te is the
electron temperature, and
d is along the
line-of-sight. The
distance dependence is made explicit with the substitution
d =
DAd
 , where
DA is the angular diameter distance of the cluster.
, where
DA is the angular diameter distance of the cluster.
The X-ray emission is proportional to the second power of the density;
Sx ~
d
ne2
 eH, where
eH is
the X-ray cooling
function. The angular diameter distance is solved for by eliminating
the electron density 3 yielding
eH, where
eH is
the X-ray cooling
function. The angular diameter distance is solved for by eliminating
the electron density 3 yielding
 |
(9) |
where these quantities have been evaluated along the line of sight
through the center of the cluster (subscript 0) and
 c refers
to a characteristic scale of the cluster along the line of sight,
whose exact meaning depends on the density model adopted. Only the
characteristic scale of the cluster in the plane of the sky is
measured, so one must relate the line of sight and plane of sky
characteristic scales. For detailed treatments of this calculation see
Birkinshaw
& Hughes (1994) and
Reese et al
(2000).
Combined with the
redshift of the cluster and the geometry of the universe, one may
determine the Hubble parameter, with the inverse dependencies on the
observables as that of
DA. With a sample of galaxy clusters, one
fits the cluster distances versus redshift to the theoretical angular
diameter distance relation, with the Hubble constant as the
normalization, e.g., see Figure 9.
c refers
to a characteristic scale of the cluster along the line of sight,
whose exact meaning depends on the density model adopted. Only the
characteristic scale of the cluster in the plane of the sky is
measured, so one must relate the line of sight and plane of sky
characteristic scales. For detailed treatments of this calculation see
Birkinshaw
& Hughes (1994) and
Reese et al
(2000).
Combined with the
redshift of the cluster and the geometry of the universe, one may
determine the Hubble parameter, with the inverse dependencies on the
observables as that of
DA. With a sample of galaxy clusters, one
fits the cluster distances versus redshift to the theoretical angular
diameter distance relation, with the Hubble constant as the
normalization, e.g., see Figure 9.
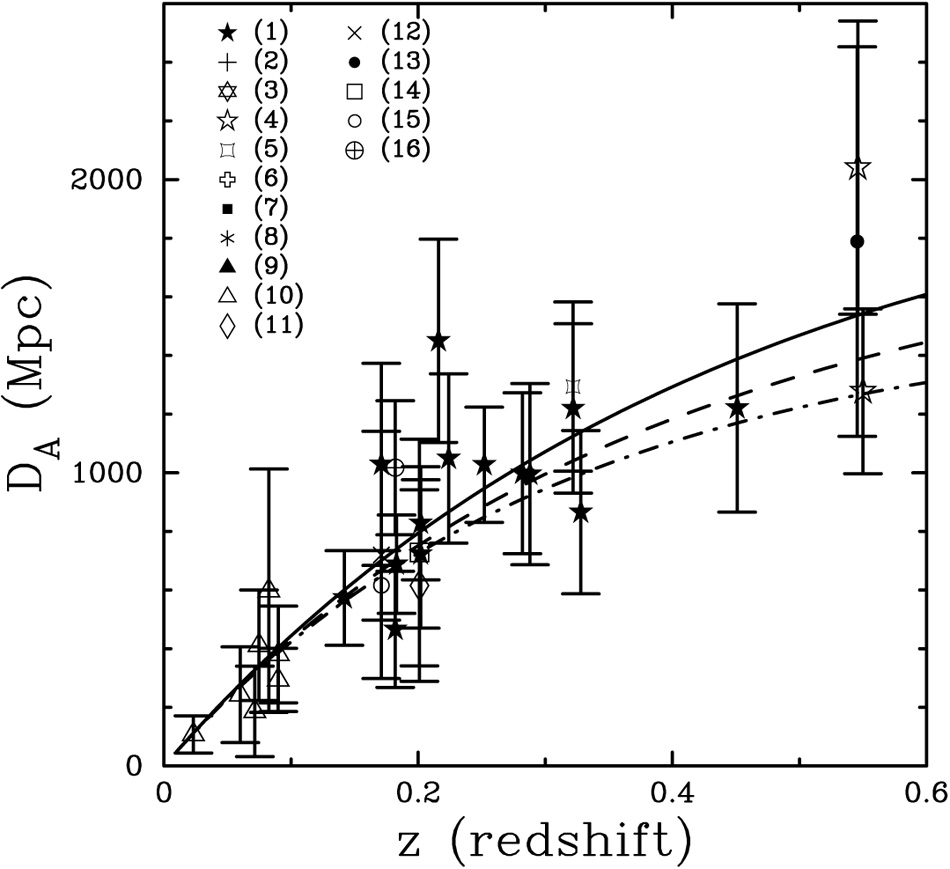 |
Figure 9. SZE determined distances versus
redshift. The theoretical angular diameter distance relation is
plotted for three different cosmologies, assuming
= 60 km s-1 Mpc-1:
|
There are two explicit assumptions made in SZE and X-ray distance
determinations. The first one, mentioned above, is that the
characteristic scale of the cluster along the line of sight must be
related (usually assumed equal) to the scale in the plane of the sky.
Typically, spherical symmetry is assumed for the cluster geometry
since for a large sample of clusters one would expect
<c
/ csky> = 1, at least in the absence of
selection effects. This assumption is supported by simulations as well
(Sulkanen,
1999).
The second assumption is that
<ne2> equals
<ne> along the line of sight,
i.e., that the clumping factor
 |
(10) |
equals unity. If significant substructure exists in galaxy clusters, the derived Hubble constant will be overestimated by a factor of C2.
To date, there are 38 distance determinations to 26 different galaxy
clusters from analyses of SZE and X-ray observations. In
Figure 9 we show all SZE determined distances
from high signal-to-noise SZE experiments. The uncertainties shown are
statistical at 68% confidence. There are currently three samples of
clusters with SZE distances: 1) a sample of 7 nearby (z < 0.1)
galaxy clusters observed with the OVRO 5m telescope
(Myers et al,
1997,
Mason et al,
2001);
2) a sample of 5 intermediate redshift (0.14 < z < 0.3)
clusters from the Ryle telescope interferometer
(Jones et al,
2001);
and 3) a sample of 18 clusters with
0.14 < z < 0.83 from interferometric observations
by the OVRO and BIMA SZE imaging project
(Reese et al,
2002).
A fit to the ensemble of 38 SZE determined distances yields
= 60 ± 3 km s-1 Mpc-1 for an
M = 0.3,
=
0.7 cosmology, where
only the statistical uncertainty is included (at 68% confidence).
The systematic uncertainty, discussed below, is of order 30% and
clearly dominates. Since many of the clusters are at high redshift,
the best fit Hubble constant will depend on the cosmology adopted; the
best fit Hubble constant shifts to 56 km s-1 Mpc-1
for an open
M = 0.3
universe and to 54 km s-1 Mpc-1 for a flat
M = 1
geometry.
The prospects for improving both the statistical and systematic uncertainties in the SZE distances in the near future are promising. Note, from Eq. 9, that the error budget in the distance determination is sensitive to the absolute calibration of the X-ray and SZE observations. Currently, the best absolute calibration of SZE observations is ~ 2.5% at 68% confidence based on observations of the brightness of the planets Mars and Jupiter. Efforts are now underway to reduce this uncertainty to the 1% level (2% in H0). Uncertainty in the X-ray intensity scale also adds another shared systematic. The accuracy of the ROSAT X-ray intensity scale is debated, but a reasonable estimate is believed to be ~ 10%. It is hoped that the calibration of the Chandra and XMM-Newton X-ray telescopes will greatly reduce this uncertainty.
The largest systematic uncertainties are due to departures from isothermality, the possibility of clumping, and possible point source contamination of the SZE observations (for detailed discussion of systematics see, e.g., Birkinshaw 1999, Reese et al. 2000, 2002). Chandra and XMM-Newton are already providing temperature profiles of galaxy clusters (e.g., Nevalainen et al. 2001, Markevitch et al. 2001, Tamura et al. 2001). The unprecedented angular resolution of Chandra will provide insight into possible small scale structures in clusters. In addition, multi-wavelength studies by existing radio observatories, e.g., the Very Large Array (VLA), can shed light on the residual point source contamination of the radio wavelength SZE measurements. Therefore, though currently at the 30% level, many of the systematics can and will be addressed through both existing X-ray and radio observatories and larger samples of galaxy clusters provided from SZE surveys.
The beauty of the SZE and X-ray technique for measuring distances is that it is completely independent of other techniques, and that it can be used to measure distances at high redshifts directly. Since the method relies on the well understood physics of fully ionized plasmas, it should be largely independent of cluster evolution. Inspection of Figure 9 already provides confidence that a large survey of SZE distances consisting of perhaps a few hundred clusters with redshifts extending to one and beyond would allow the technique to be used to trace the expansion history of the universe, providing a valuable independent check of the recent determinations of the geometry of the universe from type Ia supernova (Riess et al, 1998, Perlmutter et al, 1999) and CMB primary anisotropy experiments (Pryke et al, 2002, Netterfield et al, 2002, Stompor et al, 2001).
5.2. Cluster gas mass fractions,
M
The ICM contains most of the baryons confined to the cluster potential
with roughly an order of magnitude more baryonic mass than that
observed in the galaxies themselves
(White et al,
1993,
Forman &
Jones, 1982).
The gas mass fraction, fg, is therefore a reasonable
estimate of the
baryonic mass fraction of the cluster. It should also be reasonable
approximation to the universal baryon mass fraction,
fB  B /
M, since
it is not believed that mass segregation occurs on
the large scales from which massive clusters condense ~ 1000
Mpc3. The cluster gas fraction is actually a lower limit,
fg
B /
M, since
it is not believed that mass segregation occurs on
the large scales from which massive clusters condense ~ 1000
Mpc3. The cluster gas fraction is actually a lower limit,
fg  fB, since a small fraction of baryons (~ 10%) are
likely lost during the cluster formation process
(White et al,
1993,
Evrard, 1997),
and we can not rule out the possibility of additional reservoirs of baryons
in galaxy clusters which have yet to be detected.
fB, since a small fraction of baryons (~ 10%) are
likely lost during the cluster formation process
(White et al,
1993,
Evrard, 1997),
and we can not rule out the possibility of additional reservoirs of baryons
in galaxy clusters which have yet to be detected.
A measurement of
fB leads directly to an estimate of
M given a
determination of
B. Recent
reanalysis of big bang
nucleosynthesis predictions with careful uncertainty propagation
(Burles et al,
2001,
Nollett &
Burles, 2000,
Burles et al,
1999)
along with recent D/H measurements in
Lyman  clouds
(Burles &
Tytler, 1998,
Burles &
Tytler, 1998)
constrain the baryon density to be
B
h2 = 0.020 ± 0.002 at 95%
confidence. Recent CMB primary anisotropy experiments provide an
additional independent determination of
B
h2 consistent with
the Lyman cloud result
(Pryke et al,
2002,
Netterfield
et al, 2002,
Stompor et al,
2001).
clouds
(Burles &
Tytler, 1998,
Burles &
Tytler, 1998)
constrain the baryon density to be
B
h2 = 0.020 ± 0.002 at 95%
confidence. Recent CMB primary anisotropy experiments provide an
additional independent determination of
B
h2 consistent with
the Lyman cloud result
(Pryke et al,
2002,
Netterfield
et al, 2002,
Stompor et al,
2001).
The gas mass is measured directly by observations of the SZE provided
the electron temperature is known. The total gravitating mass can be
determined by assuming hydrostatic equilibrium and using the
distribution of the gas and, again, the electron temperature. The SZE
derived gas fraction will therefore be proportional to
TSZE
/ Te2. Alternatively, the total gravitating
mass can be determined
by strong lensing (on small scales) or weak lensing (on large scales).
Recently there has been considerable work on SZE gas fractions using
total mass determinations derived under the assumption of hydrostatic
equilibrium.
SZE derived cluster gas mass fractions have been determined for two
samples of clusters and the results were used to place constraints on
M: a
sample of four nearby clusters
(Myers et al,
1997)
and a sample of 18 distant clusters
(Grego et al,
2001).
Both analyses used a spherical isothermal
 -model for
the ICM. The nearby sample was
observed with the Owens Valley 5.5 m telescope at 32 GHz as part of a
SZE study of an X-ray flux limited sample
(Myers et al,
1997).
In this study, the integrated SZE was used to normalize a model for the gas
density from published X-ray analyses, and then compared to the
published total masses to determine the gas mass fraction. For three
nearby clusters, A2142, A2256 and the Coma cluster, a gas mass fraction of
fg h = 0.061 ± 0.011 at radii of 1-1.5
h-1 Mpc
is found; for the cluster Abell 478, a gas mass fraction of
fg h = 0.16 ± 0.014 is reported.
-model for
the ICM. The nearby sample was
observed with the Owens Valley 5.5 m telescope at 32 GHz as part of a
SZE study of an X-ray flux limited sample
(Myers et al,
1997).
In this study, the integrated SZE was used to normalize a model for the gas
density from published X-ray analyses, and then compared to the
published total masses to determine the gas mass fraction. For three
nearby clusters, A2142, A2256 and the Coma cluster, a gas mass fraction of
fg h = 0.061 ± 0.011 at radii of 1-1.5
h-1 Mpc
is found; for the cluster Abell 478, a gas mass fraction of
fg h = 0.16 ± 0.014 is reported.
The high redshift sample of 18 clusters (0.14 < z < 0.83) was
observed interferometrically at 30 GHz using the OVRO and BIMA SZE
imaging system
(Grego et al,
2001).
In this study, the model for the gas
density was determined directly by the SZE data. X-ray emission
weighted electron temperatures were used, but no X-ray imaging data
was used. The gas fractions were computed from the data at a
1' radius where they are best constrained by the observations.
Numerical simulations suggest, however, that the gas mass fraction at
r500 (the radius inside of which the mean density of
the cluster is 500 times the critical density) should reflect the
universal baryon fraction
(Evrard, 1997,
Evrard et al,
1996,
David et al,
1995).
The derived gas fractions were therefore extrapolated to
r500 using scaling relations from cluster simulations
(Evrard, 1997).
The resulting mean gas mass fractions are
fg h = 0.081+0.009-0.011 for
M = 0.3,
=
0.7, fg h = 0.074+0.008-0.009
for M = 0.3,
=
0.0 and
fg h = 0.068+0.009-0.008
for M = 1.0,
=
0.0. The uncertainties in the electron temperatures
contribute the largest component to the error budget.
The angular diameter distance relation,
DA(z), enters the gas
fraction calculation and introduces a cosmology dependence on the
results of the high z sample. In addition, the simulation scaling
relations used to extrapolate the gas fractions to
r500 have a
mild dependence on cosmology. Figure 10 shows the
constraints on
M implied
by the measured gas mass fractions assuming a flat universe
(
1 -
M) and
h = 0.7 to calculate DA and the
r500 scaling factor. The upper limit to
M and its
associated 68% confidence interval is shown as a function of
M. The
measured gas mass fractions
are consistent with a flat universe and h = 0.7 when
M is
less than 0.40, at 68% confidence. For the measurements to be
consistent with
M = 1.0
in a flat universe, the Hubble
constant must be very low, h less than ~ 0.30.
 |
Figure 10. Limits on
|
To estimate
M, we
need to account for the baryons contained in the
galaxies and those lost during cluster formation. The galaxy
contribution is assumed to be a fixed fraction of the cluster gas,
with the fraction fixed at the value observed in the Coma cluster,
Mgtrue =
Mgobs(1 + 0.20 h3/2)
(White et al,
1993).
Simulations suggest that the baryon fraction at
r500 will be a modest underestimate of the true baryon
fraction fg(r500) = 0.9 ×
fB(universal)
(Evrard, 1997).
These assumptions lead to
fB = [fg(1 + 0.2
h3/2)/0.9]. Using this to scale the gas fractions
derived from the high z SZE cluster sample and assuming h
= 0.7 and a flat cosmology, leads to the constraints illustrated in
Figure 10 with a best estimate
M ~ 0.25
(Grego et al,
2001).
Cluster gas mass fractions can also be determined from cluster X-ray emission in a similar manner as from SZE measurements. However, there are important differences between X-ray and SZE determined gas fractions. For example, the X-ray emission is more susceptible to clumping of the gas, C, since it is proportional to the ICM density squared. On the other hand, the X-ray derived gas mass is essentially independent of temperature for the ROSAT 0.1-2.4 keV band used in the analyses (Mohr et al, 1999), while the SZE derived gas mass is proportional to Te-2.
Currently X-ray data for low redshift clusters is of exceptional
quality, far surpassing SZE data. X-ray based gas mass fractions have
been measured to cluster radii of 1 Mpc or more (e.g.,
White & Fabian 1995,
David et al. 1995,
Neumann & Bohringer 1997,
Squires et al. 1997,
Mohr et al. 1999).
A mean gas mass fraction within r500 of
fg h3/2 = 0.0749 ± 0.0021 at
90% confidence was derived from X-ray data from a large,
homogeneous, nearby sample of clusters with Te > 5 keV
(Mohr et al, 1999).
The gas mass fractions derived from SZE measurements
depend differently on the cosmology assumed than those derived from
X-ray images, and this should be noted when comparing the results.
Qualitatively, the comparison does not suggest any large systematic
offsets. In fact, for a
CDM cosmology,
solving for h from the combination of the
Grego et al
(2001) and
Mohr et al (1999)
results gives
h = 0.85+0.30-0.20 at 68% confidence. This is
significant, because a large clumping factor, C 1 (see
Eq. 10), has been suggested as an explanation for the high
gas mass fractions in clusters
(White et al,
1993,
Evrard, 1997).
Cluster gas mass fractions can also be measured by comparing SZE derived gas masses and weak lensing derived total masses. The comparison is particularly interesting as both are measures of projected mass distributions. In addition, gas mass fractions can be derived without assuming a model for the cluster structure and without assuming hydrostatic equilibrium. Comparisons of SZE and lensing data has only been done for a few clusters to date (Holder et al, 2000a). However, as for the SZE, the quality and quantity of weak lensing observations toward galaxy clusters is rapidly increasing and several weak lensing surveys are underway. Holder et al (2000a) demonstrated that gas mass fractions can be determined from the analysis of SZE and weak lensing measurements without need to parameterize the ICM distribution. Furthermore, by comparing this mass fraction with one derived by assuming hydrostatic equilibrium, it is possible to solve for the ICM electron temperature and the angular diameter distance.
SZE surveys will provide a large catalog of galaxy clusters at redshifts z > 1. The increased sensitivity and larger angular dynamic range of the next generation of SZE instruments will allow measurements of cluster gas fractions to r500 directly, greatly increasing the precision of the gas mass fractions. Moreover, extending the gas fraction analyses to high redshift will enable studies of the evolution of cluster structure. It should, for example, be straight forward to test speculative theories of dark matter decay (Cen, 2001).
5.3. Cluster Peculiar Velocities
The kinetic SZE is a unique and potentially powerful cosmological tool as it provides the only known way to measure large scale velocity fields at high redshift (Section 2.2). To obtain an accurate measure of the peculiar velocity of a galaxy cluster, sensitive multifrequency SZE observations are required to separate the thermal and kinetic effects. From inspection of Figure 2, it is clear that measurements of the kinetic SZE are best done at frequencies near the null of the thermal effect at ~ 218 GHz. However, as discussed in Section 3.1, contamination by CMB temperature fluctuations as well as other sources make it difficult to determine accurately the peculiar velocity for a given cluster. There have been only a few recent attempts to measure the kinetic SZE.
The first interesting limits on the peculiar velocity of a galaxy
cluster were reported in
Holzapfel et
al (1997).
They used the Sunyaev-Zel'dovich Infrared Experiment (SuZIE) to observe
Abell 2163
(z = 0.202) and Abell 1689 (z = 0.183) at 140 GHz (2.1 mm),
218 GHz (1.4 mm) and 270 GHz (1.1 mm). These observations include and
bracket the null in the thermal SZE spectrum. Using a
model,
with the shape parameters
(c,
) from X-ray
data, they found
vpec = + 490+1370-880 km
s-1 for Abell 2163 and
vpec = + 170+815-630 km
s-1 for Abell 1689, where the
uncertainties are at 68% confidence and include both statistical and
systematic uncertainties. These results are limited by the
sensitivity of the SZE observations, which were limited by
differential atmospheric emission. The SuZIE data for Abell 2163 were
reanalyzed with the addition of higher frequency measurements which
are sensitive to emission from Galactic dust in the direction of the
cluster
(Lamarre et al,
1998.
More recently
LaRoque et al
(2002)
also reanalyzed all of the available data for Abell 2163, including a new
measurement obtained with the OVRO and BIMA SZE imaging system at 30
GHz (1 cm). As shown in Figure 4,
the data is well
fitted by parameters similar to the original values from
Holzapfel et
al (1997).
The agreement between the measurements using
different instruments and techniques is striking.
The intrinsic weakness of the kinetic SZE and the degeneracy of its spectrum with that of primary CMB fluctuations make it exceeding difficult to use it to measure the peculiar velocity of a single cluster. It may be possible, however, to determine mean peculiar velocities on extremely large scales by averaging over many clusters.
5.4. Energy Densities in the Universe and Growth of Structure
The evolution of the abundance of galaxy clusters is a sensitive probe
of cosmology (Section 4). Measurements of
the clusters
masses and number density as a function of redshift can be used to
constrain the matter density,
M, and,
for sufficiently large
samples, the equation of state of the dark energy. X-ray surveys have
already been used to constrain
M (e.g.,
Borgani et al,
2001,
Viana &
Liddle, 1999,
Bahcall &
Fan, 1998,
Oukbir et al,
1997),
but they have been
limited by sample size and their reduced sensitivity to high redshift
clusters. SZE surveys offer the attractive feature of probing the
cluster abundance at high redshift as easily as the local universe; as
discussed in Section 4.2, the
sensitivity of a SZE survey is essentially a mass limit
(Bartlett &
Silk, 1994,
Barbosa et al,
1996,
Holder et al,
2000b,
Bartlett, 2000,
Kneissl et al,
2001).
The simple mass selection function of SZE surveys could allow the
source count redshift distribution to be used as a powerful measure of
cosmological parameters
(Barbosa et al,
1996,
Haiman et al,
2001,
Holder et al,
2001,
Weller et al,
2001,
Benson et al,
2001)
and the structure formation paradigm in general. As an example, we show in
Figure 11 the expected constraints in
M
- -
 8 parameter
space from the analysis of a deep SZE survey
(Carlstrom et
al, 2000,
Holder et al,
2000b,
Holder et al,
2001)
covering 12 square degrees in which all clusters above
1014 h-1
M
8 parameter
space from the analysis of a deep SZE survey
(Carlstrom et
al, 2000,
Holder et al,
2000b,
Holder et al,
2001)
covering 12 square degrees in which all clusters above
1014 h-1
M are detected
and for which redshifts have been
obtained. The darkest region corresponds to the 68% confidence
region, red to 95%. The shaded regions show the result of a Monte
Carlo method for estimating confidence regions. Many realizations of a
fiducial model
(M = 0.3,
= 0.7,
8 = 1) were
generated and fit
in the three-dimensional parameter space, and the shaded regions
indicate regions which contain 68% and 95% of the resulting best
fits. The contours show confidence regions from a Fisher matrix
analysis, where the confidence regions are assumed to be Gaussian
ellipsoids in the parameter space. In each case, the
dimension not shown has been marginalized over, rather than kept
fixed.
are detected
and for which redshifts have been
obtained. The darkest region corresponds to the 68% confidence
region, red to 95%. The shaded regions show the result of a Monte
Carlo method for estimating confidence regions. Many realizations of a
fiducial model
(M = 0.3,
= 0.7,
8 = 1) were
generated and fit
in the three-dimensional parameter space, and the shaded regions
indicate regions which contain 68% and 95% of the resulting best
fits. The contours show confidence regions from a Fisher matrix
analysis, where the confidence regions are assumed to be Gaussian
ellipsoids in the parameter space. In each case, the
dimension not shown has been marginalized over, rather than kept
fixed.
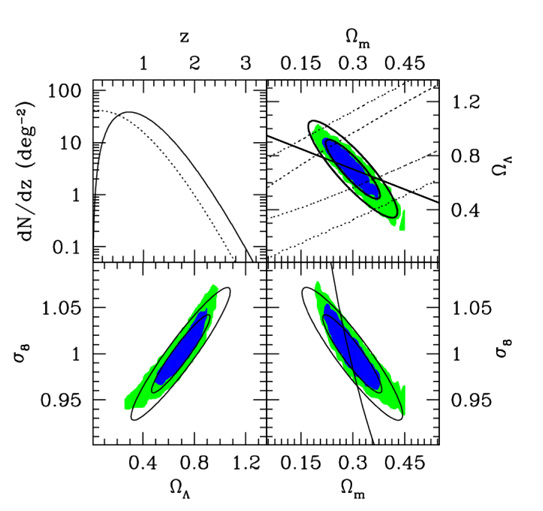 |
Figure 11. Expected constraints in the
|
The next generation of dedicated telescopes equipped with large format
bolometer detector arrays offers the possibility of conducting SZE
surveys over thousands of square degrees with
 10 µK
sensitivity. As shown in Figure 12, the yields from
such a survey should, in principle (see Section 5.5),
enable
highly accurate estimation of cosmological parameters, notably of the
matter density and the properties of the dark energy. Most
importantly, the degeneracies in the constraints of the cosmological
parameters derived from SZE survey yields are very different from
those expected from distance measures or CMB measurements. This simply
arises because clusters are probing a fundamentally different physical
effect, the growth rate of structure, rather than distance. Both
growth and distance are related to the expansion history of the
universe, but the two measures are effectively sensitive to different
moments of the expansion rate.
10 µK
sensitivity. As shown in Figure 12, the yields from
such a survey should, in principle (see Section 5.5),
enable
highly accurate estimation of cosmological parameters, notably of the
matter density and the properties of the dark energy. Most
importantly, the degeneracies in the constraints of the cosmological
parameters derived from SZE survey yields are very different from
those expected from distance measures or CMB measurements. This simply
arises because clusters are probing a fundamentally different physical
effect, the growth rate of structure, rather than distance. Both
growth and distance are related to the expansion history of the
universe, but the two measures are effectively sensitive to different
moments of the expansion rate.
 |
Figure 12. Expected constraints on the
matter density
|
A generic prediction of inflation is that the primordial fluctuations should be Gaussian. With cluster surveys probing the highest peaks of the density field, non-Gaussianity in the form of an excess of high peaks should be readily apparent, especially at high redshift (Benson et al, 2001). Cluster surveys are therefore probing both the structure formation history of the universe and the nature of the primordial fluctuations. In this way, cluster surveys are emerging as the next serious test of the cold dark matter paradigm.
5.5. Challenges for Interpreting SZE Surveys
In order to realize the full potential of the evolution of the cluster number density as a cosmological probe, a strong understanding of the physics of galaxy clusters will be required. As fully collapsed objects, the complete physics of galaxy clusters is highly non-linear and complex. The size of such massive objects, however, makes them insensitive to disruption from most physical mechanisms. Nevertheless, there are several important aspects of gas dynamics that could affect interpretation of SZE galaxy cluster surveys.
The SZE is only sensitive to free electrons; any process that removes
electrons from the optically thin ICM can affect the magnitude of the
SZE for a given total mass. For example, cooling of the ICM, star
formation or heating of the ICM from supernovae can affect the observed SZE
(Holder &
Carlstrom, 1999,
Springel et al,
2001,
Holder &
Carlstrom, 2001,
Benson et al,
2001).
If the cooling or star formation is not dependent on cluster mass or
redshift, this can be simply calibrated and accounted for in deriving
the survey selection function. The most promising theoretical path for
understanding such processes is through high resolution cosmological
simulations that include the relevant gas dynamics; such simulations
are only now becoming feasible. The possible effects of such gas
dynamics are shown in Figure 13
(Holder &
Carlstrom, 2001).
A simple model has been adopted for this figure, where some combination
of heating or cooling has reduced the number of hot electrons in the
central regions of galaxy clusters by an amount that is modeled
through the effects of an "entropy floor"
(Ponman et al,
1999).
The curves in this figure show the extreme cases of either no heating or
cooling (no entropy floor) or extreme gas evolution, with an assumed
value for the minimum entropy that is roughly a factor of two larger
than is required for consistency with the observations
(Ponman et al,
1999).
Changing the evolution of the ICM could mimic
changes in cosmological parameters at levels much larger than the
expected statistical errors. With detailed imaging of the ICM using
SZE and X-ray telescopes, the effects of heating or cooling should be
apparent, so the possible systematic errors due to heating or cooling
should in practice be much smaller than 10% in
M.
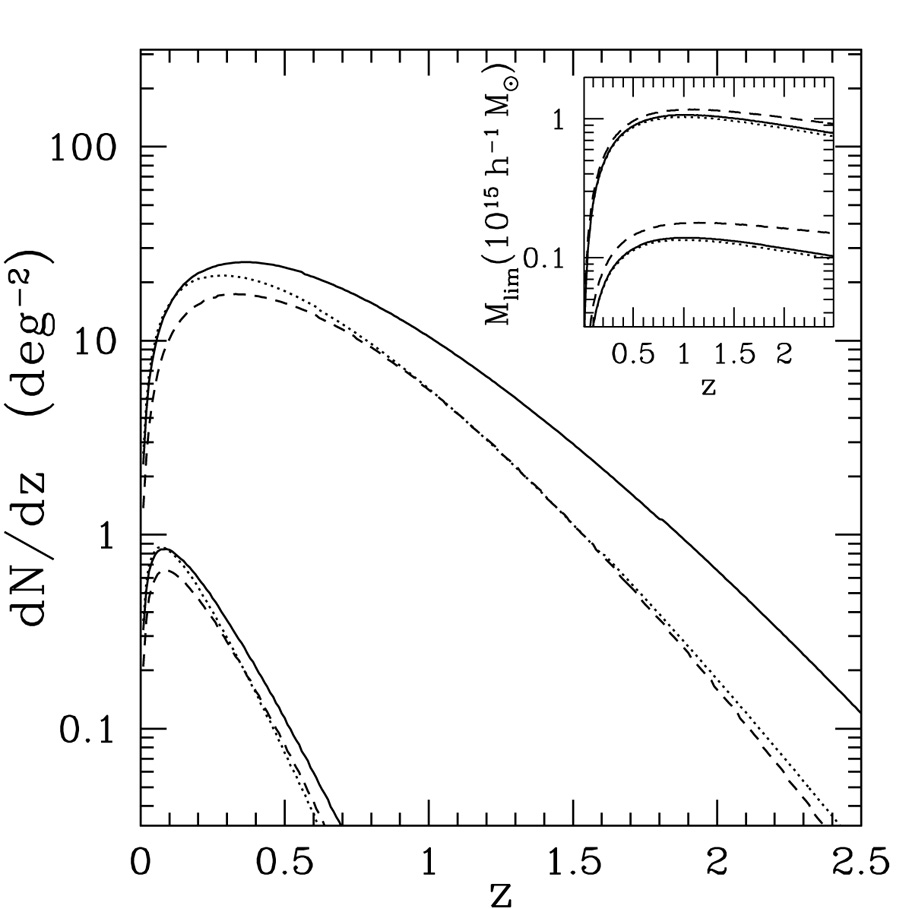 |
Figure 13. Effects of gas evolution on
cluster survey yields. In the
inset, the top group of lines correspond to mass limits for a SZE
survey similar to the Planck Surveyor satellite survey, with the
uppermost line indicating the expected mass limit for a model with
significant gas heating while the lower line in the top group shows
the expected mass limit of detection for the case of no cluster gas
heating. The cosmology chosen is
|
Although the SZE-mass relation is easy to understand theoretically in general terms, the details of the normalization and redshift evolution will require additional studies of at least a moderately sized SZE cluster catalog. For example, simple scaling arguments can be used to estimate the expected relation between cluster mass and temperature, but the exact cosmological dependence could be sensitive to merger rates as a function of cosmology or other non-linear effects.
Furthermore, the mapping between the initial density field and the number density of clusters of a given mass as a function of redshift, i.e., the mass function, is not known perfectly at this time. The current generation of large cosmological simulations offers hope for a much better understanding in coming years. An important use for a large scale SZE cluster survey will be to characterize this mass function and test the reliability of various analytical (Press & Schechter, 1974, Bond et al, 1991, Sheth et al, 2001) and numerical (Jenkins et al, 2001) estimates.
In order to exploit fully the potential of SZE surveys, the limiting mass as a function of redshift for galaxy clusters will have to be understood to an accuracy of better than 5% and uncertainties in the mass function must be reduced to better than 10% (Holder et al, 2001). The former will require a concerted observational effort and is likely to be the most difficult to achieve; the latter requirement is not far from current uncertainties (Jenkins et al, 2001). Note that it is not required that we know the mass of each cluster in the catalog to this accuracy, but only that we can characterize the cluster detection efficiency as a function of mass to this level.
While some of the theory of the physics of galaxy clusters is not known, there are plenty of observational diagnostics which can be used in the interpretation of SZE surveys. High resolution SZE imaging of high redshift clusters will provide information on the relative importance of gas dynamics (Holder & Carlstrom, 2001) to the observed properties of galaxy clusters. The main effect of most gas processes should be to cause the gas to be less centrally concentrated, either because the low-entropy gas has been removed (Bryan, 2000) or because the gas has gained entropy from non-gravitational heating.
It may also be possible with the next generation of large format multi-frequency bolometer arrays to exploit the small relativistic corrections to the SZE spectrum to determine the gas temperature. Such measurements will allow an understanding of temperature structure in the gas, even without follow-up X-ray observations. A direct SZE-weighted temperature would be more directly relevant to the SZE observations in determining the gas mass, and comparisons with X-ray spectral temperatures, when possible, could provide valuable information on the temperature structure along the line of sight. Temperature information, combined with high-resolution imaging, allows a reconstruction of the cluster potential and therefore can provide important constraints on the gas mass fraction as a function of radius as well as a diagnostic for the effects of gas cooling.
In terms of the properties of the cluster catalog produced by a SZE survey, it is difficult to avoid the conclusion that the survey limit will be mainly dependent only on cluster mass and that this mass limit will be relatively flat with redshift beyond z ~ 0.1. This will make the resulting catalog especially useful for studies of the physics of galaxy clusters. The requirements on understanding the cluster mass selection function for such studies are much less strict than those required for cosmological studies. The results from detailed studies of individual clusters in the catalog will naturally feed back and improve our understanding of the survey selection function.
3 Similarly, one could eliminate DA in favor of the central density, ne0 Back.