Copyright © 2001 by Annual Reviews. All rights reserved
| Annu. Rev. Astron. Astrophys. 2001. 39:
137-174 Copyright © 2001 by Annual Reviews. All rights reserved |


Centers of galaxies are still mysterious places. For galaxies as close as the Virgo cluster, 0.1" subtends about 8pc. Only in a few special cases can the stellar or gas kinematics be inferred on such scales: for very few galaxies can we sample velocity fields on scales of tens of parsecs. Generally, when astronomers discuss circumnuclear rotation curves, they refer to velocities measured from spectra where a single resolution element encompasses a large fraction of the radius on which the velocities vary. "High accuracy" and "high resolution" mean high with respect the present state-of-the-art.
4.1. High Resolution and Dynamic Range
A simulation reveals the effects of the finite resolution on the observed PV diagram, for a galaxy with assumed gas and mass distributions (Sofue 1999a). Fig. 2 shows an assumed rotation curve for a galaxy containing a central compact core, bulge, disk and massive halo, each expressed by a Plummer potential. In the observed PV diagram, however, the central steep rise and the peaks due to the core and bulge are hardly recognized. Central rotation curves derived from observed PV diagrams generally give lower limits to the rotation velocities. In fact, this conclusion holds for virtually all procedures which do not adequately account for the finite observed resolution.
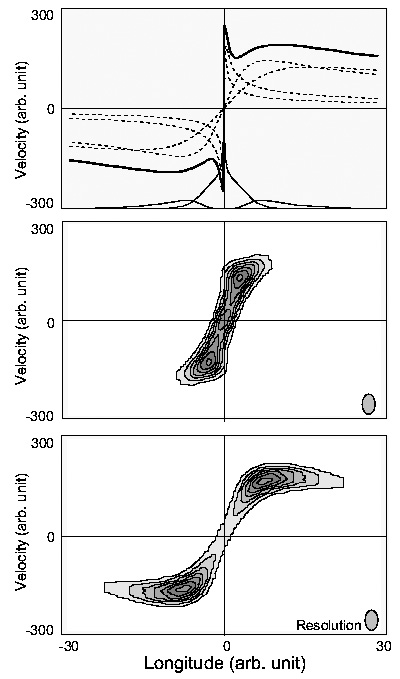 |
Figure 2. Simulation of the effect of beam-smearing on a position-velocity diagram. The top panel shows an assumed 'true' rotation curve comprising a central core, bulge, disk and a halo. Assumed molecular and HI gas distributions are indicated by the thin lines. The middle panel is an 'observed' PV diagram in CO, and the bottom in HI. Both the resolution and sensitivity are crucial to detect central high velocities and steep rise. |
CCD spectroscopy has made it possible to derive optical rotation curves of centers of galaxies, due to high dynamic range and precise subtraction of bulge continuum light (Rubin & Graham 1987; Woods et al. 1990; Rubin et al. 1997; Sofue et al. 1998, 1999a; Bertola et al. 1998). However, optical spectroscopy often encounters additional difficulty arising from extinction due to dusty nuclear disks as well as confusion with absorption features from Balmar wings of A-type stars. These problems are lessened at the wavelength of CO lines because of the negligible extinction, the high molecular gas content, and the high spatial and velocity resolution. At present, the combination of optical and CO-line spectroscopy produces rotation curves of high accuracy, reliable for the entire regions of galaxies including the central regions (Sofue 1996, 1997, Sofue et al. 1997, 1998, 1999).
In a few special cases, nuclear disks have been studied with other techniques. For several bright radio cores, HI absorption features have revealed high-velocity central disks (Ables et al. 1987; Irwin & Seaquist 1991). Rapidly rotating nuclear disks studied from their water maser emission and very high resolution observations are discussed in Section 4.4.
By its proximity, our Galaxy provides a unique opportunity
to derive a high resolution central rotation curve
(Gilmore et al. 1990).
Proper-motion studies in the near infrared show
that the velocity dispersion of stars within the central 1 pc
increases toward the center, indicating the existence of a massive
black hole of mass 3 × 10⁶
M (Genzel et al. 1997,
2000;
Ghez et al. 1998).
(Genzel et al. 1997,
2000;
Ghez et al. 1998).
The rotation curve varies slightly depending upon the tracer. A rotation curve formed from high resolution CO and HI-line spectroscopy (Burton & Gordon 1978; Clemens 1985; Combes 1992), shows a very steep rise in the central hundred pc region, attaining a peak velocity of 250 km s-1 at R ~ 300 pc. It then decreases to a minimum at R ~ 3 kpc of about 200 km s-1, followed by a gentle maximum at 6 kpc and a flat part beyond the solar circle. Rotation velocities due to the black hole are combined with the outer velocities in Fig. 3: the curve is presented both in linear and logarithmic plots. Of course, the rotation velocity does not decline to zero at the nucleus, but increases inward, following a Keplerian law.
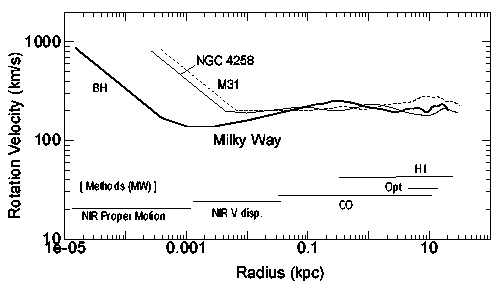 |
Figure 3. Logarithmic rotation curves of the Milky Way (thick line), NGC 4258 (thin line) and M31 (dashed line). Innermost rotation velocities are Keplerian velocities calculated for massive black holes. Observational methods for the Milky Way are shown by horizontal lines. |
Radial velocities of OH and SiO maser lines from IR stars in the Galactic Center region are used to derive the velocity dispersion and the mass within the observed radius, as well as the mean rotation, which seems to take part in the Galactic rotation (Lindqvist et al. 1992a, b; Sjouwerman et al. 1998). SiO masers from IRAS sources in the central bulge have been used to study the kinematics, and the mean rotation of the bulge was found to be in solid body rotation of the order of 100 km s-1 (Izumiura et al. 1995; Deguchi et al. 2000). SiO masers in the disk region have been also used to study the structure and kinematics of a possible bar structure and non-circular streaming motion superposed on the disk and bulge components (Izumiura et al. 1999).
4.3. Rapidly Rotating Central Components and Massive Cores
Central rotation curves have been produced for a number of galaxies
by a systematic compilation of PV diagrams in the CO and
H lines
(Sofue 1996;
Sofue et al. 1997,
1998,
1999).
Fig. 4 shows rotation curves obtained for nearby
galaxies at high spatial and velocity resolution.
For massive spiral galaxies, high nuclear velocities may be a universal
property, but detected only with highest resolution observations.
Even a decade ago, it was observed
(Rubin & Graham 1987)
that innermost velocities for some galaxies start from an already
high velocity at the nucleus. But high central density may not be a
characteristic only of massive galaxies. The nearby M33 (1" = 3pc),
a galaxy with a minimal "bulge", exhibits velocities over the inner
± 200pc which are flat at about V = 100 km s-1
(Rubin 1987),
and do not decrease to zero at the origin.
Here too, the contribution from the falling density of a peaked central mass
exceeds the density contribution from the disk.
lines
(Sofue 1996;
Sofue et al. 1997,
1998,
1999).
Fig. 4 shows rotation curves obtained for nearby
galaxies at high spatial and velocity resolution.
For massive spiral galaxies, high nuclear velocities may be a universal
property, but detected only with highest resolution observations.
Even a decade ago, it was observed
(Rubin & Graham 1987)
that innermost velocities for some galaxies start from an already
high velocity at the nucleus. But high central density may not be a
characteristic only of massive galaxies. The nearby M33 (1" = 3pc),
a galaxy with a minimal "bulge", exhibits velocities over the inner
± 200pc which are flat at about V = 100 km s-1
(Rubin 1987),
and do not decrease to zero at the origin.
Here too, the contribution from the falling density of a peaked central mass
exceeds the density contribution from the disk.
 |
Figure 4. Rotation curves of spiral galaxies obtained by combining CO data for the central regions, optical for disks, and HI for outer disk and halo (Sofue et al. 1999). |
Bertola et al. (1998)
have emphasized that the
high-velocity nuclear peaks observed in some spiral
galaxies match the simulated PV diagrams for
Keplerian rotation due to a massive (~ 109
M) black
hole, at equivalent resolution. Even more dramatic, the analysis of
Maciejewski & Binney
(2000)
show that when a galaxy with an arbitrarily
large central velocity gradient is observed with a slit wider than the
instrumental point spread function, artifacts are generated in the spectra.
Such artifacts can erroneously be interpreted as discrete kinematic
components, and may account for some of the features observed in the
spectra of Virgo galaxies
(Rubin et al. 1999).
Evidence confirms that the steep nuclear rise observed in massive galaxies is real, and not due to a particular view of non-circular motions. The probability of looking at a bar side-on is larger than that of viewing one end-on. Hence there is a larger probability for apparently slower rotation than circular velocity. For these massive galaxies, the mass density increases toward the nucleus more rapidly than expected from an exponential or de Vaucouleurs law. The widely adopted custom of drawing a rotation curve by linking positive and negative velocities from the opposite sides across the nucleus along the major axis is incorrect, at least for these massive galaxies.
4.4. Massive Black Holes and Circum-nuclear Rotation
For many spirals, the innermost region exhibits rapid rotation velocities (Carter & Jenkins 1993; van der Marel et al. 1994; Miyoshi et al. 1995; Kormendy & Richstone 1995; Richstone, et al. 1998, Bertola et al. 1998; Ferrarese 1999; Kormendy & Westpfahl 1989; Kormendy 2001). These high velocities offer evidence for massive nuclear black holes. Consequently, orbital velocities in the center decrease rapidly from a velocity close to the speed of light. Detecting these high central velocities will require both enormously high spatial and velocity resolution and is a program for the future.
At present, spectroscopic sub arcsecond seeing is limited to the Space
Telescope Imaging Spectrographs(STIS) and
a few ground based telescopes, except in special cases.
STIS is now engaged in a major study of a sample of 54 Sb-Sc spirals,
V  2000 km s-1 to
obtain spectra at H,
within a few arcsec of the nucleus (Axon, unpublished).
The aim is to measure black hole masses, or significant upper limits.
2000 km s-1 to
obtain spectra at H,
within a few arcsec of the nucleus (Axon, unpublished).
The aim is to measure black hole masses, or significant upper limits.
In one very special nearby galaxy, NGC 4258, water masers at 22 GHz
are observed from a disk of radius 0.1 pc in
Keplerian rotation about a mass of 3.9 × 10⁷
M
(Nakai et al. 1993;
Watson & Wallim 1994;
Miyoshi et al. 1995;
Herrnstein et al. 1999).
The maximum rotation velocity is 900 km s-1; the rotation
period is 800 years. VLBI observations of the water maser line
have revealed a rapidly rotating nuclear torus of sub parsec scales
in several nearby active galactic nuclei
(NGC 3079:
Haschick et al. 1990;
Trotter et al. 1998;
Sawada-Satoh et al. 2000;
NGC 1068:
Greenhill et al. 1996;
NGC 4945:
Greenhill et al. 1997).
4.5. Activity and Rotation Curves
One might ask whether the existence of massive objects in the nuclei, as suggested from the high central velocities, is correlated with nuclear activity. High-accuracy central rotation curves for starburst galaxies (NGC 253, NGC 1808, NGC 3034), Seyferts (NGC 1068, NGC 1097), LINERs (NGC 3521, NGC 4569, NGC 7331), and galaxies with nuclear jets (NGC 3079) (Sofue et al. 1999a; Brinks et al. 1997) show, however, no particular peculiarity. Even such a very active galaxy like NGC 5128 (Cen A) shows a rotation curve much like a normal galaxy (van Gorkom et al. 1990). The radio lobe galaxy NGC 3079 has both strong nuclear activity and usual rotation properties, but with very high central velocities (Sofue & Irwin 1992; Irwin & Sofue 1992; Sofue et al. 1999a). While these galaxies all show a very steep central velocity rise, such steep rise is generally observed for massive galaxies without pronounced central activity. Because the global rotation and mass distribution in active spirals are generally normal, it is likely that nuclear activity is triggered by local and temporal causes around central massive cores and/or black holes.
The ring resonance in rotating disks will affect the kinematics and rotation of gas and stars in a galaxy disk. Rotation curves for several ring galaxies (Buta et al. 1995, 1999) exhibit normal rotation properties, showing a steep nuclear rise, high-velocity peak near the resonance ring, and flat velocities in the disk and halo. Simulations of rotation properties for a bar resonance mimic well the observed variations of rotation velocities, which is of the order of ± 20 - 30 km s-1 (Salo et al. 1999).
A major interest in current interferometer observations of the CO line emissions from nuclear regions is the detailed orientation of the nuclear molecular disk (NMD) and circum-nuclear torus. A NMD is produced by accretion of disk gas due to an angular momentum transfer to the massive disk by galactic shock waves, either in spiral arms or bars, whereas off-axis angular momentum such as associated with warping is invariant. If the accreting disk has a warp, as is often the case and is particularly prominent in mergers and interacting galaxies, the displacement of angular momentum of accreting disk from the original rotation axis is amplified. Hence, NMDs often exhibit significant warp from the main disk. Interferomeric CO observations exhibit that NGC 3079's NMD is warped from the main disk by 20 degrees which contains a higher-density molecular core inclined from both the NMD and main disk (Sofue et al. 2000); NGC 1068 shows an warped nuclear disk surrounding a nuclear torus whose axis is quite different from that of the main disk and nuclear disk (Kaneko et al. 1997; Schinnerer et al. 2000). A nuclear warp produces uncertain inclination corrections in the rotation velocities. These can be minimized by observing edge-on galaxies.
An extreme case of a nuclear warp is counterrotation. Rotating nuclear disks of cold gas have been discovered in more than 100 galaxies, types E through Sc (Bertola & Galletta 1978; Galletta 1987, 1996; Bertola et al. 1990; Bertola et al. 1992; Rubin 1994b; Garcia-Burillo et al. 1998); counterrotation is not especially rare. Simulations of disk interactions and mergers which include gas and stellar particles (Hernquist & Barnes 1991; Barnes & Hernquist 1992) reveal that a kinematically distinct nuclear gas disk can form; it may be counterrotating. Simulation of galactic-shock accretion of nuclear gas disk in an oval potential, such as a nuclear bar, produces highly eccentric streaming motion toward the nucleus, some portion being counterrotating (Wada et al. 1998). Kinematically decoupled stellar nuclear disks are also observed in early type galaxies (Jedrzejewski & Schechter 1989; Franx et al. 1991). Counter rotating nuclear disks can result from merger, mass exchange and/or inflow of intergalactic clouds. In addition to forming the central disk, an inflow of counterrotating gas would also be likely to promote nuclear activity.
4.9. Non-circular Motion in Nuclear Molecular Bar
Oval potential such as due to a bar produces galactic shocks of interstellar gas, and the shocked gas streams along the bar in non-circular orbits (Sorensen et al. 1976; Noguchi 1988; Wada & Habe 1992, 1995; Shlosman 1990). The velocity of streaming motion during its out-of-shock passage is higher than the circular velocity, while the velocity during its shock passage is much slower than circular velocity, close to the pattern speed of the bar in rigid-body rotation. The molecular gas is strongly condensed in the galactic shock, and stays there for a large fraction of its orbiting period. Hence, CO line velocities manifest the velocity of shocked gas, and therefore, observed CO velocities are close to those of gas in rigid-body motion with a bar, slower than the circular velocity. This results in underestimated rotation velocities. Geometrical effect that the probability of side-on view of a bar is greater than that of end-on view also causes underestimated rotation velocities.
Bar-driven non-circular motion of the order of 20 to 50 km s-1 are observed in central molecular disks (Ishizuki et al. 1990; Handa et al. 1990; Sakamoto et al. 1999; Kenney et al. 1992; Kohno 1998; Kohno et al. 1999). The CO-line PV diagram in the Milky Way Center (Bally et al. 1987; Oka et al. 1998; Sofue 1995) shows that the majority (~ 95%) of gas is rotating in steep rigid-body features. A few percent exhibits non-circular 'forbidden' velocities, which could be due to non-circular motion in an oval potential (Binney et al. 1991), whereas a question remains why the majority of the gas is regularly rotating. Because the gas is shocked and intensity-weighted velocities are smaller than the circular velocity as discussed above, determination of mass distribution in barred galaxies from observed CO velocities is not straightforward, and will be a challenge for numerical simulations in the future.