


The two most basic questions about the BLR are "what does it look like?" and "how is it moving?" The traditional picture of the BLR of an AGN for over 40 years (and one which is widely depicted in cartoons of AGNs) has been that there is a central source emitting ionizing radiation roughly spherically, and that it is surrounded by a roughly spherical mist of cloudlets. This is depicted in the left-hand-panel of Fig. 1. Each individual cloud, if it is big enough, will have a structure as shown in the right-hand-panel of Fig. 1. It will be highly ionized on the front, and if it has a high-enough column density, it will be mostly neutral on the back. The front emits high-ionization lines such as He II, He I, O VI, N V, and C IV, while the back emits low-ionization lines such as Mg II, Ca II, O I, and Fe II. All these lines are well-known in AGNs.
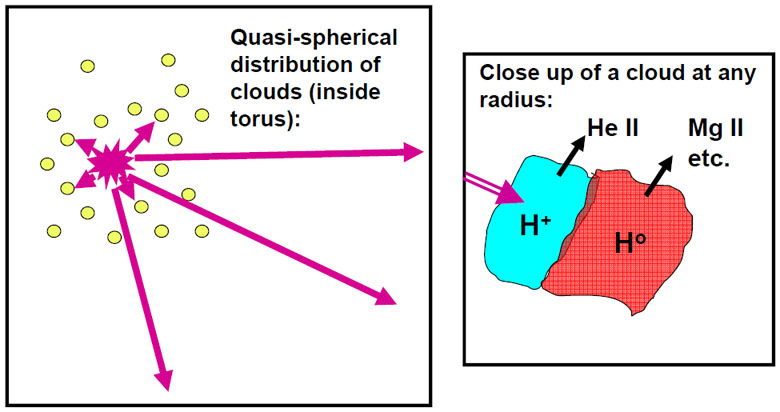 |
Figure 1. The left frame shows a cartoon of a common traditional view of the BLR. The right frame shows a schematic close-up of an individual cloudlet. |
The emissivity of each line as a function of distance from the front of the cloud can be calculated with the photoionization code CLOUDY (Ferland et al. 1998). Fig. 2 shows emissivities for some well-known lines.
 |
Figure 2. Relative emissivity of four lines in a typical BLR cloudlet (normalized to a maximum emissivity of one for each line) versus distance (in arbitrary units) from the ionized face of the cloud. |
Baldwin et al. (1995) showed that the sum of contributions from clouds with a distribution of cloud properties (densities and distances from the center) will automatically produce a total spectrum similar to what is observed from AGNs. This is the so-called LOC model. 1 This was important because it showed that no "fine-tuning" of cloud conditions was needed to explain AGN spectra.
Despite the success of the traditional picture in general, and the LOC model in particular, in explaining the overall spectrum of an AGN, the problem with this picture (see Gaskell, Klimek, & Nazarova 2007) is that to explain the strengths of the BLR lines the covering factor has to be large (50% or so), yet if this is so, and if the cloudlets are covering the central source uniformly, we ought to see Lyman continuum absorption by the BLR clouds. In fact Lyman continuum absorption due to the BLR is never convincingly seen (Antonucci et al. 1989 - see discussion in MacAlpine 2003 and Gaskell, Klimek, & Nazarova 2007). We believe, as proposed by S. Phinney (see Antonucci et al. 1989), that the need for a high covering factor plus the lack of Lyman continuum absorption requires the BLR to have a flattened distribution and requires us to be viewing it through a hole. This conclusion is supported by recovery of what is called the "transfer function" of some lines (the transfer function is the temporal response of a line to a delta-function event in continuum light curve). Transfer functions for low-ionization lines have always implied that there is little or no gas along the line of sight (Krolik et al. 11991, Horne, Welsh, & Peterson 1991, Mannucci, Salvati, & Stranga 1992, Pijpers & Wanders 1994), and thus that at least the low-ionization gas in the BLR has a flattened distribution.
Having a high overall covering factor but a flattened distribution means that near the equatorial plane there will be a close to a 100% chance that any path will intersect a BLR cloud. The clouds will thus be self-shielding. Radiation from the central source can freely escape near the axis of symmetry, but is strongly diluted in the equatorial plane. This is schematically illustrated in Fig. 3.
 |
Figure 3. Schematic cross section of the BLR and torus in a plane through the axis of symmetry. The torus is on the right. Ionizing radiation is attenuated in the equatorial plane, but can freely escape near the poles. Figure from Gaskell, Klimek, & Nazarova (2007) |
It is easy to calculate the average radial dependence of the ionization and the emissivities of all the lines coming from cloudlets with a distribution such as in Fig. 3. The ionization structure of a single cloud in CLOUDY is now spread out in radius as illustrated schematically in Fig. 4. The horizontal axis in Fig. 2 can now be read as distance into the BLR rather than distance into an individual cloud. Our model is in fact very similar to the old "filling factor" model of MacAlpine (1972).
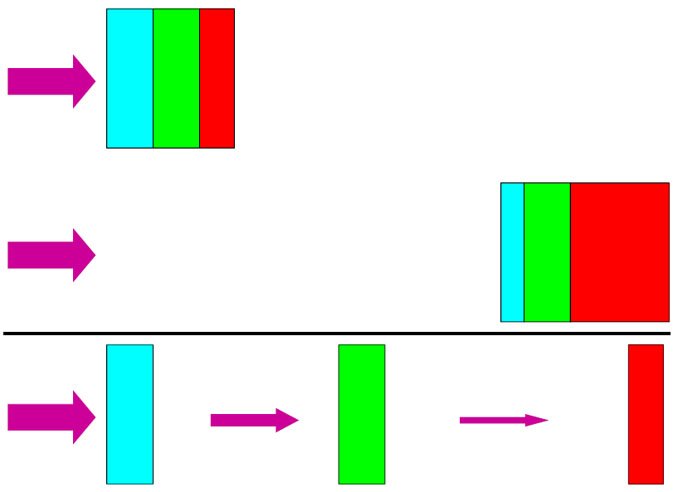 |
Figure 4. Cartoon of the relationship between a traditional cloudlet model (top two thirds of the diagram) and the self-shielding model (bottom third). The different shadings symbolize three regions producing lines of differing degrees of ionization (cf. Fig. 3). |
The earliest reverberation mapping of multiple lines (Gaskell & Sparke 1986) showed that the high-ionization lines were coming from smaller radii than the low-ionization lines. High-ionization lines were also wider (e.g., Shuder 1982, Mathews & Wampler 1985). The radial ionization stratification of the BLR has been well confirmed by later reverberation mapping. The best reverberation-mapped AGN is NGC 5548. The horizontal axis of Fig. 5 (taken from Gaskell, Goosmann, & Klimek 2008) shows the reverberation-mapping time lags (i.e., the effective radii) for lines of a variety of ions from Clavel et al. (1991), Peterson et al. (1991), and Bottorff et al. (2002). (See table in Gaskell, Klimek, & Nazarova 2007 for details). The observed lags cover an order of magnitude in radius. NGC 5548 is not unique in this regard: an identical range of radii has also been found for Mrk 110 by Kollatschny (2003). The vertical axis shows the lags predicted for the same lines by the LOC model (Korista & Goad 2000, Bottorff et al. 2002). It can be seen that while there is a correlation, these predicted lags cover a much smaller range of radii. The reason for this can be appreciated in Fig. 4. In the LOC model (top part of the figure) every cloud has a highly-ionized front part; the clouds just differ in the degree of ionization.
 |
Figure 5. Observed lags
( |
The self-shielding model (Gaskell, Klimek, & Nazarova 2007) solves the problem of why the ionization stratification is so strong. In the self-shielded model (bottom of Fig. 4) there is a clear spatial separation of the differing ionizations. It can be seen in Fig. 5 that the self-shielding model gives good agreement with the observed lags.
Netzer & Laor (1993) made the important suggestion that the outer edge of the BLR coincided with the dust sublimation radius of the torus. Reverberation mapping observations show that the low-ionization gas in the BLR indeed extends out to the dusty torus (Suganuma et al. 2006, Gaskell, Klimek, & Nazarova 2007). The covering factor of the torus can be calculated statistically from the ratio of type-1 (face-on) to type-2 (edge-on) AGNs, and directly for individual objects from the strength of the thermal emission (e.g., Maiolino et al. 2007). We argue (Gaskell, Klimek, & Nazarova 2007) that the covering factors of the BLR and torus have to be the same. This is because if the torus has a lower covering factor than the BLR we would see the BLR in absorption against the central continuum source in some objects near the type-2 viewing position. This is never seen. On the other hand, if the BLR has a lower covering factor, some of the dusty torus will see direct radiation from the central source. This cannot be the case for much of the torus because it would then be unable to exist as close in as is seen.
The overall picture we get of the torus and BLR is indicated schematically in the cartoon in Fig. 6 and in the computer generated renditions shown in Fig. 7. The best description of the appearance is to say that the BLR and torus look like a bird's nest. This picture is identical to that favored for totally independent reasons in an unfortunately almost totally overlooked paper by Mannucci, Salvati, & Stranga (1992). They inferred a "bird's nest" geometry from a combined analysis of line profiles and transfer functions in NGC 5548. The positions of masers in NGC 1068 also provides support for a thick BLR-torus (Greenhill et al. 1996).
 |
Figure 6. A schematic view of the BLR and torus of an AGN in a plane through the axis. The figure is approximately to scale (except that the black hole is shown too large.) Figure from Gaskell, Klimek, & Nazarova (2007). |
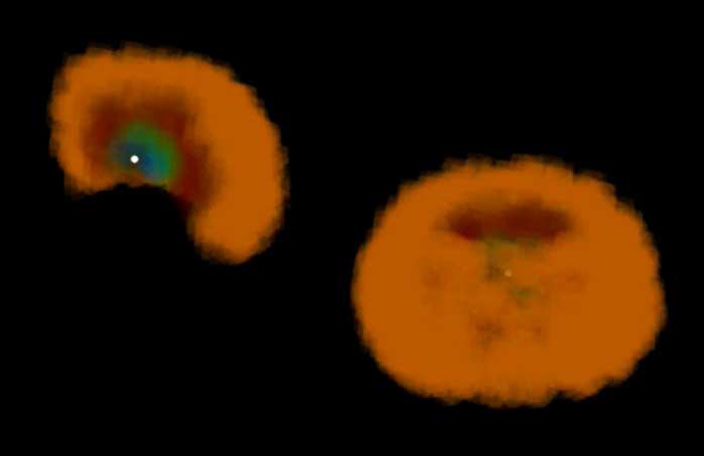 |
Figure 7. Computer-generated renditions of the appearance of the BLR and clumpy torus of an AGN seen from a "Seyfert 1.9" viewing position (lower right), and a cutaway view from the same position (upper left). The cut makes a 45 degree angle to the projection of the line of sight onto the equatorial plane. Computer renditions by Daniel Gaskell. |
1 Ostensibly from "locally optimally emitting clouds." Back

 obs) versus predicted lags
(
obs) versus predicted lags
(