


Observations of edge-on and face-on galaxies clearly provide
complementary perspectives of the distribution of the DIG. Specifically,
face-on galaxies show the surface brightness of emission lines from the
DIG across the face of the galaxy, which makes it possible to explore
relationships (if any) between the properties of this plasma and the
locations and ionizing fluxes of the hot, massive O stars, which are the
most powerful ionizing agents in disk galaxies and are the presumed
ionizing source for the DIG. In general, the observations reveal a
strong relationship, with the
H flux from the DIG
comparable to that from the classical O star H II regions in the galaxy.
flux from the DIG
comparable to that from the classical O star H II regions in the galaxy.
The presence of diffuse interstellar
H emission in face-on
spirals was first noted by
Monnet (1971),
who derived a temperature of 7000 K, an emission measure of about
35 cm-6 pc, and a density near 0.5 cm-3 for the
emitting gas. Modern detector technology (i.e., CCDs) has pushed the
detection of diffuse H+ to fainter regions and has
allowed the study of other emission lines, which has provided insight
into the relationship between the diffuse ionization and the O stars.
4.1. Radiation from O stars and the surface brightness of the DIG
Although it was not understood how Lyman continuum photons could have
free paths of hundreds of parsecs and more in galaxies with typical
interstellar H I densities of
~1 cm-3, ever since the discovery of diffuse
H+, O stars have been considered the prime
candidate for the ionization. Other known energy sources simply fall
short in total power (e.g.,
Reynolds 1984).
A key observational step that connected the diffuse ionized gas to radiation
from O stars was carried out by
Ferguson et
al. (1996),
who showed a quantitative relationship between the DIG and the surface
brightness distribution of the bright, O star H II regions
across a galactic disk. An example of their work is given in
Fig. 8 (their Fig. 4a), where it
is clear that the mean radial surface brightness profile of the DIG in
H emission tracks that
of the H II regions. Their study
included a careful, quantitative comparison of the energetic
requirements for the H
emission in the DIG with the ionizing
radiation and the mechanical energy inferred to be emitted by the
O stars in the H II regions of the two galaxies measured.
They found that the mechanical energy clearly fell short, by more than a
factor of three. They also found that the maximum contribution of local
sources of ionizing radiation in the DIG from stars cooler than spectral
type O8 also fell short of the luminosity required, but by a smaller
factor. They concluded that the O star populations of the clusters
producing the H II regions are the likeliest main source of the
radiation that ionizes the DIG.
 |
Figure 8. Deprojected profiles of the
(solid) total
H |
In two papers dedicated to testing the hypothesis that escaping Lyman
continuum photons from the classical H II regions surrounding
O stars can be sufficient to ionize the DIG, Zurita et al.
(2000,
2002)
took another important step forward by identifying and classifying the
H II regions in a set of photometric maps of disk galaxies in
H. This process is
illustrated in Fig. 9, taken from
Zurita et al.
(2000),
which shows in the upper left, the original continuum-subtracted
H image
of the nearly face-on spiral galaxy NGC 157, followed clockwise by
a schematic representation of the positions and luminosities of the
classified H II regions, a surface brightness map of the DIG in
H, with the H II regions
subtracted off, and finally a map used for quantifying the DIG. In the
case of this last frame, the DIG is measured by integrating the
H surface brightness
over the full
disk, using the values outside the H II region boundaries and local
mean values inside each H II region. Some key points in the method
for deriving these maps and quantifying the DIG emission include the
following. First a catalog of H II regions was prepared, using a
semiautomatic, but interactive method to measure their
H
luminosities, effective radii and central positions
(Rozas et al.
1999),
down to a lower limiting luminosity. These
H II regions were delimited and their emission subtracted from the
total image by masking those pixels occupied by the H II regions,
but with a final refinement that contiguous pixels with surface
brightness higher than a set limit are also subtracted off.
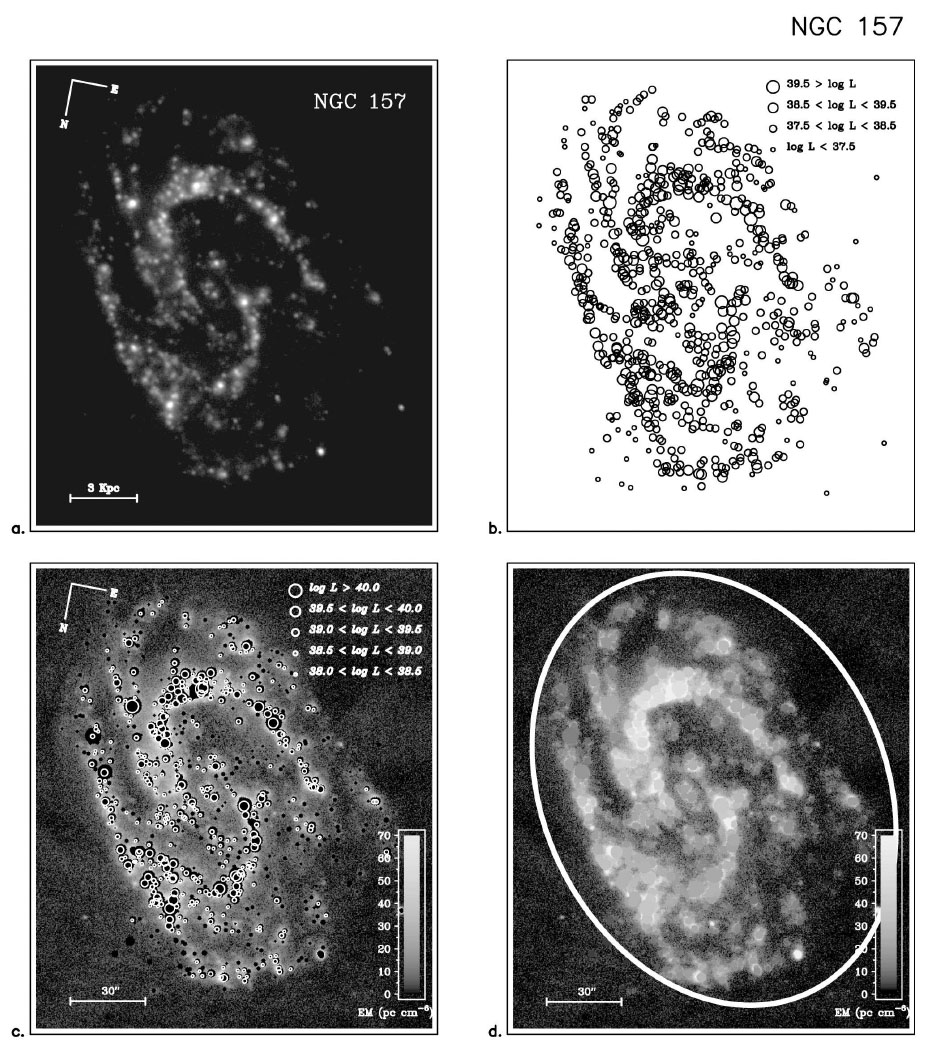 |
Figure 9. Steps in the quantification of
the total H |
This procedure is illustrated in Fig. 10
(Zurita et
al. 2000),
which shows how this criterion for separating
H II region from DIG emission coincides very well with an
alternative criterion in which the boundaries of an H II region are
defined by a limiting value of surface brightness gradient. Having
separated the H II regions, one can then define the total DIG
luminosity in one of three ways: (a) integrating the remaining surface
luminosity after applying the H II region mask; (b), as in (a) but
then adding a contribution from the areas of the H II regions,
assuming this is proportional to their projected areas times their local
DIG surface brightness, or (c), as in (a) but making the contribution
proportional to the area of the H II regions times the mean DIG
surface brightness outside the regions across the disk of the galaxy.
Modes (a), (b), and (c) give respectively lower limits, upper limits,
and approximate estimates for the total DIG emission from the observed
galaxies. In Fig. 11, we show the
results of this method of estimating the DIG, for six galaxies, shown as
the ratio of the DIG H
luminosity to the total luminosity for the
galaxy plotted in terms of galactocentric radius.
 |
Figure 10. Technique used for separating H II
region emission from DIG emission. (a) Portion of
H |
We can see that the DIG emits around a half of the total
H output, that
there are systematic modulations of this tendency with radius, and that
there is slight tendency for the fraction to increase with radius. We
also note that the projected area of the disk occupied by the DIG is of
order 80(± 10)% for all the objects shown in
Fig. 11. In a separate study of over 100 galaxies,
Oey et
al. (2007)
found that the amount of DIG
H to total
H from a galaxy ranged
from 20% to nearly 100% with a mean near 60%.
Voges (2006)
has presented results suggesting an inverse correlation between the DIG
H fraction and
the star formation rate per unit area.
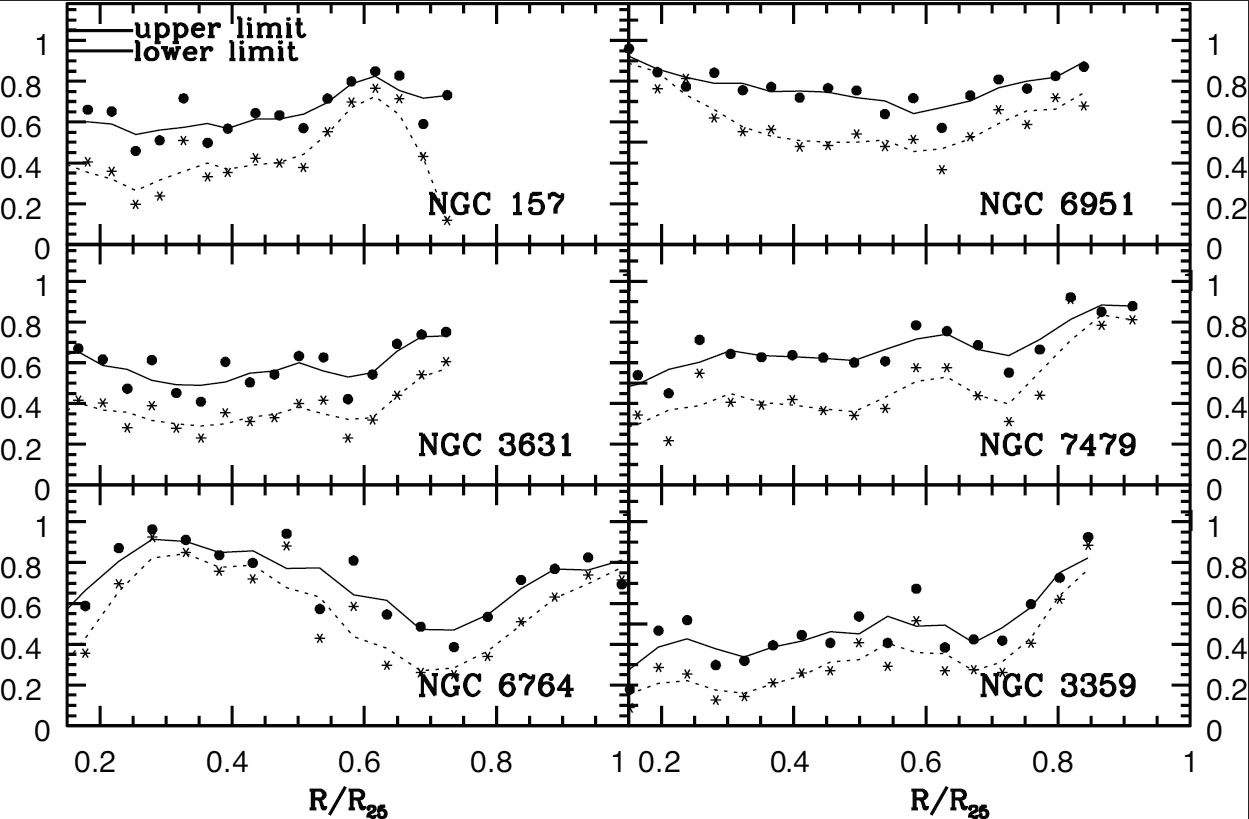 |
Figure 11. Radial variation of the ratio of
integrated DIG luminosity in
H |
4.2. An escape model for Lyman continuum propagation
Given a full catalog of H II region positions and luminosities for a galaxy, one can test the hypothesis that escaping photons from the H II regions cause the ionization of the DIG by modeling the transfer of these photons from their points of origin. This was done in considerable detail by Zurita et al. (2002) for NGC 157. This galaxy was selected because of the availability of a VLA H I map of reasonable resolution, as we will explain shortly. In Fig. 12, we show a comparison between the observed surface brightness distribution in the DIG and one of the simplest models used. In this model 30% of emitted Lyman continuum photons escape from each H II region, and propagate through the DIG isotropically.
 |
Figure 12. Comparison of a DIG model with
observations. (left) Modeled surface brightness in
H |
The predicted H surface
brightness is derived by summing the
contributions to the ionizing radiation field from each of the H II
regions. We can see that the result is remarkably similar globally to
the observed distribution, and is itself a fair verification of the
initial hypothesis. However a more quantitative look at the comparison
shows that the ratio between the predicted and observed DIG surface
brightness is not uniform on large scales, as would be expected since
the initial model assumes a uniform slab structure for the H I involved
in converting the Lyman continuum photons to
H. The missing
structural parameter can
be supplied by using the observed H I column density, as shown in
Fig. 13, where we can see that in
zones of low H I column density the ratio of observed to predicted DIG
surface brightness is reduced. Maps of these two quantities give
excellent coincidence of features, and go a step further in showing that
the principal DIG ionization sources must be the O stars in luminous H II
regions. Modeling the effect of clustered supernovae on the distribution
of the H I,
Clarke and Oey (2002)
also found that the resulting clumpiness of the medium had a significant
effect on the escape fraction of the ionizing radiation.
Zurita et al.
(2002)
carried out a number of different modeling tests
of the basic hypothesis, varying the law relating the escape fraction of
ionizing photons with the luminosity of an H II region, and varying
the mean absorption coefficient of the inhomogeneous neutral fraction of
the DIG. However, they concluded that it was not possible without
H I data of improved
angular resolution to go further in testing different photon escape
laws, or to estimate what fraction of the DIG ionization could be due to
mechanisms other than that tested.
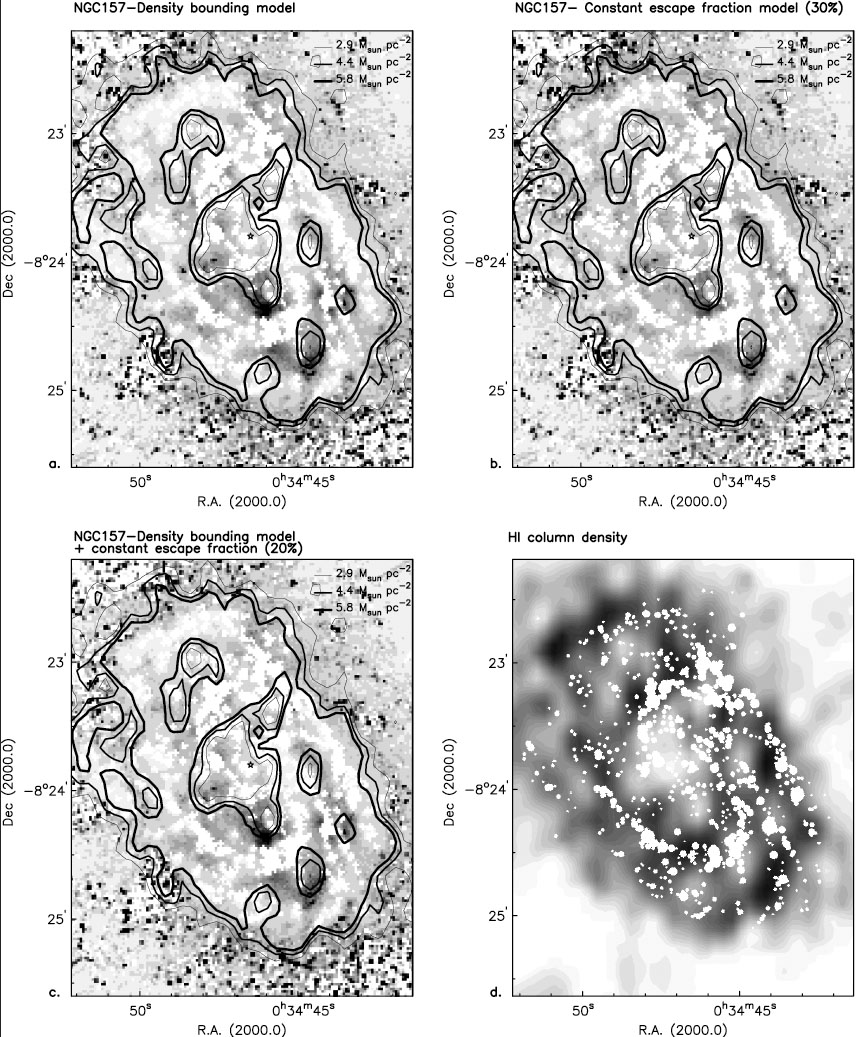 |
Figure 13. Ratios of observed to modeled DIG of
NGC 157, for three variant models of photon escape
from H II regions, assuming a slab structure to the H I in the
disk. (a) Constant fraction of photons emitted by the O stars
escape from each H II region. (b) Only H II regions with
luminosities higher than a critical value show significant Lyc photon
escape. (c) A constant underlying escape fraction for all
H II regions plus an increasing increment for H II regions
above a set H |
There have been relatively few quantitative spectroscopic studies of the
DIG in face-on galaxies. A pioneering study of [N II] and
H across the face of
NGC 1068 was carried out by
Bland-Hawthorn et
al. (1991),
who found very high
[N II] / H ratios and
discussed possible causes for this high excitation.
Hoopes and Walterbos
(2003)
and
Voges and Walterbos
(2006)
have made the most careful and detailed
examinations to date. In Fig. 14, we
show the observations of the DIG close to the luminous H II region
NGC 604 in the nearby spiral M33
(Hoopes and Walterbos
2003),
obtained by placing a slit across the
H II region so that it sampled the DIG on either side. This example
is representative of their study of the three local face-on
galaxies, M33, M51, and M81. We can see that the line ratios,
[N II] / H, He I /
H, and [O III] /
H , all tend
to show higher values in the DIG. The full study includes measurements
of these ratios as well as [S II] /
H and [S II] / [N II] in
H II regions and in the DIG, both in the spiral arms and in the
interarm zones in each galaxy. The results were compared with
predictions made with "standard" H II region ionizing fields, with
varying ionization parameters and stellar photospheric temperatures
between 20000 K and 50000 K. There is good
agreement for the H II regions but poor agreement for the DIG. They
then considered more realistic radiation fields, which take into account
the fact that the spectrum of the radiation escaping from H II
regions may be different from that from a pure O star (see next
section). They modified their spectra accordingly, varying the modeled
escape fraction between 30% and 60%, where a lower escape fraction
implies a harder spectrum. These results showed better agreement with
the DIG observations than the previous set, but the agreement was only
fair.
, all tend
to show higher values in the DIG. The full study includes measurements
of these ratios as well as [S II] /
H and [S II] / [N II] in
H II regions and in the DIG, both in the spiral arms and in the
interarm zones in each galaxy. The results were compared with
predictions made with "standard" H II region ionizing fields, with
varying ionization parameters and stellar photospheric temperatures
between 20000 K and 50000 K. There is good
agreement for the H II regions but poor agreement for the DIG. They
then considered more realistic radiation fields, which take into account
the fact that the spectrum of the radiation escaping from H II
regions may be different from that from a pure O star (see next
section). They modified their spectra accordingly, varying the modeled
escape fraction between 30% and 60%, where a lower escape fraction
implies a harder spectrum. These results showed better agreement with
the DIG observations than the previous set, but the agreement was only
fair.
 |
Figure 14. Selected emission line ratios
from long slit spectra across the luminous H II region NGC 604 in M33. The solid line is the
H |
The authors reached the tentative conclusion that O star photoionization is not the sole mechanism for ionizing and/or heating the DIG, the same conclusion reached by others who have studied these line ratios both in our Galaxy and others (e.g., Wood and Mathis 2004, Reynolds et al. 1999, Rand 1998). This may indeed well be the case; however, before reaching a definitive conclusion, it would be useful to test a modification of the types of models proposed in Hoopes and Walterbos (2003) based on the assumption that not only is the DIG itself inhomogeneous, but so also are the H II regions. The effects of clumping of the interstellar gas on the escape fraction and the spectrum of the ionizing radiation is discussed in more detail below.

 50% is found, with a total
fractional area subtended by the DIG of ~ 80%. From
50% is found, with a total
fractional area subtended by the DIG of ~ 80%. From