


Models of a more realistic (i.e., 3-D clumpy) medium may provide a clearer view of the ionization and heating processes in the gas as well as insight into such questions as:
 comes from the ionized
surfaces of dense clouds and how much from a smoother low density medium
occupying the space between the clouds? Is a cloud-intercloud model
sufficiently realistic?
comes from the ionized
surfaces of dense clouds and how much from a smoother low density medium
occupying the space between the clouds? Is a cloud-intercloud model
sufficiently realistic?
5.1. What exactly is an H II region?
Before describing various modeling efforts for the DIG, we will try to envision the structure of an H II region. In the classical picture of a Strömgren sphere, a spherical volume of interstellar gas of uniform density is ionized by a central source. For plausible values of the ionization parameter there is a sharp transition from H II to H I at the Strömgren radius Strömgren 1939, Osterbrock 1989). However, in order to better explain line ratios in real H II regions, the "filling factor" approach was devised in which the ionized gas is confined to small, fully ionized clouds surrounded by vacuum, and with the ionized gas occuping only some fraction of the H II region volume (Strömgren 1948, Osterbrock and Flather 1959, Osterbrock 1989). Both of these pictures deviate from real H II regions, where neutral condensations can exist within the H II region. In addition there may be a convoluted interface between ionized and neutral gas on the faces of clouds exposed to ionizing radiation. These interfaces and the shadowed regions behind the clumps will have a very different ionization and temperature structure and hence also a different emission line spectrum compared to fully ionized clouds or the gas inside a uniform Strömgren sphere (e.g., Williams 1992). Therefore, a more realistic picture of an H II region comprises high density clumps embedded in a lower density interclump gas.
Depending on the density of the clumps they may be fully ionized or be dense enough so that they have an ionized skin and a shielded, neutral interior (e.g., Giammanco et al. 2004). This more complex picture can qualitatively explain the observed features of H II regions including "blister" regions such as the Orion Nebula (e.g., Ferland 2001). Consequences of this clumpy structure for emission line ratios from H II regions were quantified in Giammanco et al. (2004) and in Giammanco et al. (2005). Based on the models explained in these two articles, Fig. 15 shows an example of two spectra of ionizing photons emerging from an H II region, one hardened by partial ionization of H I while propagating through the denser clumps within the region, and the other essentially unaffected as it has passed through the interclump gas. Applications to the DIG will entail the combination of these two types of spectra with suitable weightings. When this has been done, we will be in a position to make clearer statements about what fraction of the ionization and heating of the DIG can be due to photons escaping from H II regions, the presumed primary source of the ionization.
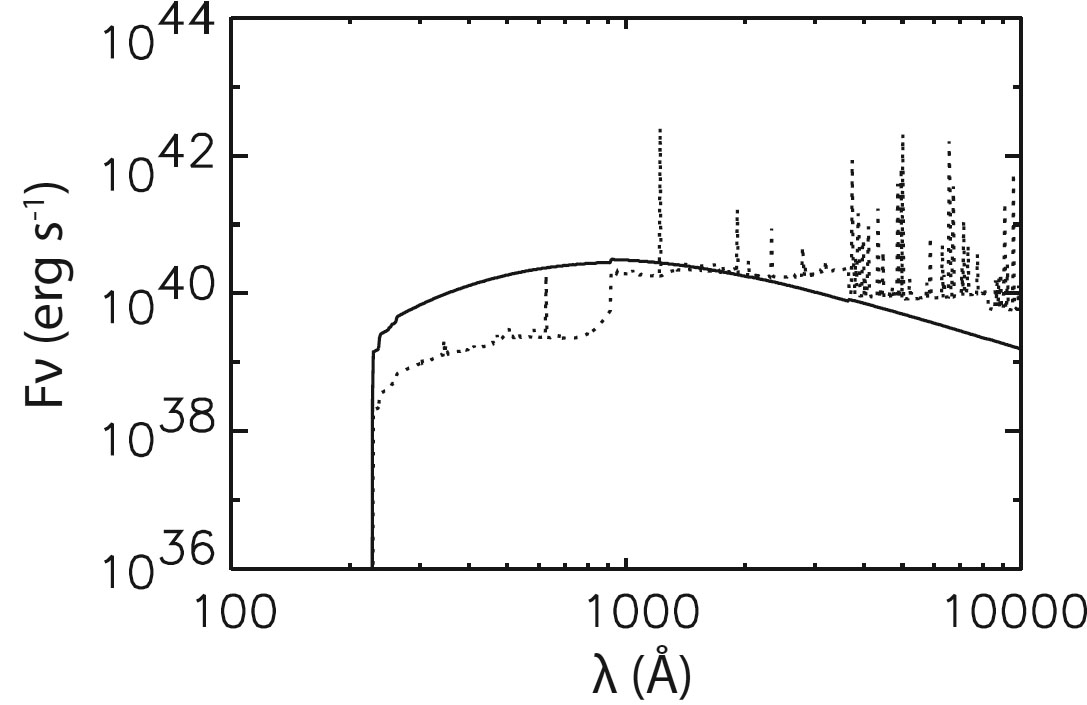 |
Figure 15. Components of unattenuated and hardened ionizing spectra emerging from a clumpy model H II region, with geometrical filling factor of denser clumps 10-2, clump density 100 cm-3, and mean clump radius 1 pc. Solid line: input spectrum emerging diluted but unchanged in relative intensities through interclump medium. Dashed line: hardened spectrum after transiting internal clumps. In this model the DIG would be ionized by a combination of both spectra, weighted according to the details of the clump model. For details of these models see Giammanco et al. (2004). |
5.2. Modeling the ionization structure of the DIG
A complex 3D picture is almost certainly needed to explain the DIG. As
we will see below, for example, a 3D medium can help to answer questions
regarding the penetration of ionizing photons to large
distances. However, among the most crucial parts of any 3D
photoionization model are the density distributions of its gaseous
components. If, for example, we adopt a model consisting of dense
H I clouds within a uniform lower density intercloud H I medium, then we
will need to know what is the density of the intercloud medium, how much
does it contribute to the observed
H, and what is the
covering factor of
the clouds? In models with more complex density distributions, we would
need more accurate knowledge about the actual spatial and density
distributions of the ionized as well as the neutral gas, which are only
beginning to be explored (e.g.,
Hill et al.
2008,
Kim et al.
2008).
Questions pertaining to the density structure of the interstellar medium
are the major unknowns in photoionization models.
Until recently, multi-dimensional photoionization models of the DIG did
not consider the faint forbidden line emission, and focussed mostly on
H and the 3D ionization
structure of hydrogen via "Strömgren volume" techniques
(Franco et
al. 1990,
Miller and Cox 1993,
Dove and Shull 1994,
Dove et al.
2000)
or Monte Carlo simulations
(Wood and Loeb 2000,
Ciardi et al.
2002).
These models demonstrated that extended DIG layers
could be produced by the ionizing radiation of O stars in a clumpy
medium, where the 3D density structure of the medium was simulated using
a variety of models including "standard clouds"
(Miller and Cox 1993),
superbubbles formed by the action of supernovae and stellar winds
(Dove et al.
2000),
and two-phase and fractal densities
(Wood and Loeb 2000,
Ciardi et al.
2002).
A 3D density structure was found to be necessary to
allow ionizing photons to penetrate to large distances from the O stars,
which are confined to discrete locations near the galactic midplane. In
a smooth medium with a typical interstellar density of
1 cm-3, an O star will form a Strömgren Sphere of
radius about 60 pc, and within the neutral medium an ionizing photon
will penetrate only 0.1 pc; so, 3D structures must provide the low
density paths that allow the photons to traverse kiloparsec size-scales
and ionize the gas far from the O stars and at large heights above
the midplane.
5.2.1. Escape of ionizing radiation through superbubbles
The work of Dove et al. (2000) investigated whether superbubbles created by the dynamical action of supernovae and stellar winds could provide the low density paths. They found that the dense swept up shell of material would trap ionizing photons within the bubble and thus inhibit the escape of ionizing radiation to the halo, unless, of course, the size of the bubble were so large that it reached into the halo. Their models employed a smooth, continuous structure for the swept up shell. The fragmentation of shells and the punching of holes by supernovae and stellar winds as they expand into a clumpy medium may offset the trapping of radiation in smooth models and allow a larger fraction of ionizing photons to escape. Recent analysis by Terebey et al. (2003) of the W4 chimney suggests that a significant fraction of ionizing radiation is able to escape from a fragmented shell-like structure near the midplane, perhaps to be absorbed on the distant wall of a much larger cavity that reaches into the lower halo (Reynolds et al. 2001a). Photoionization models of bubbles created by stellar winds in a turbulent star forming cloud also suggest that large escape fractions (in excess of 20%) are possible (Dale et al. 2005). Future work should study in more detail the ionization structure of 3D hydrodynamic simulations of supernova created bubbles and superbubbles to determine escape fractions and the spectrum of the escaping ionizing radiation. A comparison of such models with observations of H II regions and the surrounding DIG would allow a critical test of the predicted interstellar structure.
5.2.2. Two- and three-dimensional ionization structure of the DIG
The Miller and Cox (1993) model of the DIG adopted a two component, vertically stratified density structure n(H) = 0.1exp(-|z|/0.3) + 0.025exp(-|z|/0.9), where the number density is per cm3 and the z-distance is in kiloparsecs. This represents the concentrated neutral layer and the extended ionized layer. They also included an approximation for absorption by dense opaque clouds using a model that reproduces the statistics of clouds in the interstellar medium. Although their smooth density is lower than the average density inferred for H0 and H+, when implemented in their "standard cloud" model including the known ionizing sources in the solar neighbourhood, it reproduced the average observed emission measures (EM) and dispersion measures (DM).
An obvious criticism of the Miller & Cox model is that the mean density they used is smaller than that inferred for the H I in the Galaxy (e.g., Dickey and Lockman 1990). However, they did use the known distribution and ionizing luminosity of O stars in the Solar neighborhood and showed that the above density distribution would allow for the gas to be ionized to large |z|. In reality the gas is clumped on a wide range of size scales, so the Miller & Cox density provides an estimate of the maximum amount of smooth component allowed, if ionizing photons are to penetrate to large |z|. Therefore, the Miller & Cox density profile may be a good starting point for the smooth intercloud medium in 3D models that incorporate both smooth and clumpy components.
To illustrate the effect of a clumpy, 3D density distribution, Fig. 16 shows slices through the ionized volumes created in a completely smooth medium and in a medium with both clumpy and smooth components. In each case to simulate an O star, the ionizing source is a 40000 K blackbody point source at the center of a grid which is 2000 pc on a side. The hydrogen ionizing luminosity Q is varied in the range 1049 s-1 < Q < 1050 s-1, thus giving a range of sizes for the ionized volumes, corresponding to that for a single O star up to that for a large O star association. For the smooth medium the density structure is that of a Dickey-Lockman disk (Dickey and Lockman 1990). For the clumpy medium the average |z|-height dependent density is also that of a Dickey-Lockman disk, except that the gas has been turned into 3D clumps using the hierarchical clumping algorithm of Elmegreen (1997). For this simulation one third of the mass remains in a smooth component and the remainder is converted into hierarchical clumps. The photoionization simulation is performed using the 3D Monte Carlo code of Wood et al. (2004).
The contours in Fig. 16 show slices through the ionized regions for different source luminosities. It is immediately seen that for a given source strength, the 3D density structure with clumps allows ionizing photons to reach much larger |z| distances than the completely smooth distribution. In the smooth model the source with Q = 1049 s-1 (typical of a single O star) creates a very small ionized volume, while the same source ionizes a much larger volume in the 3D simulation. Recall that both the smooth and clumpy density grids have the same mean n(z) given by the Dickey-Lockman density distribution. Therefore, it appears that 3D density structure readily allows for ionizing photons to penetrate to large |z|, thus solving a problem common to models that adopt a smooth density structure of the medium.
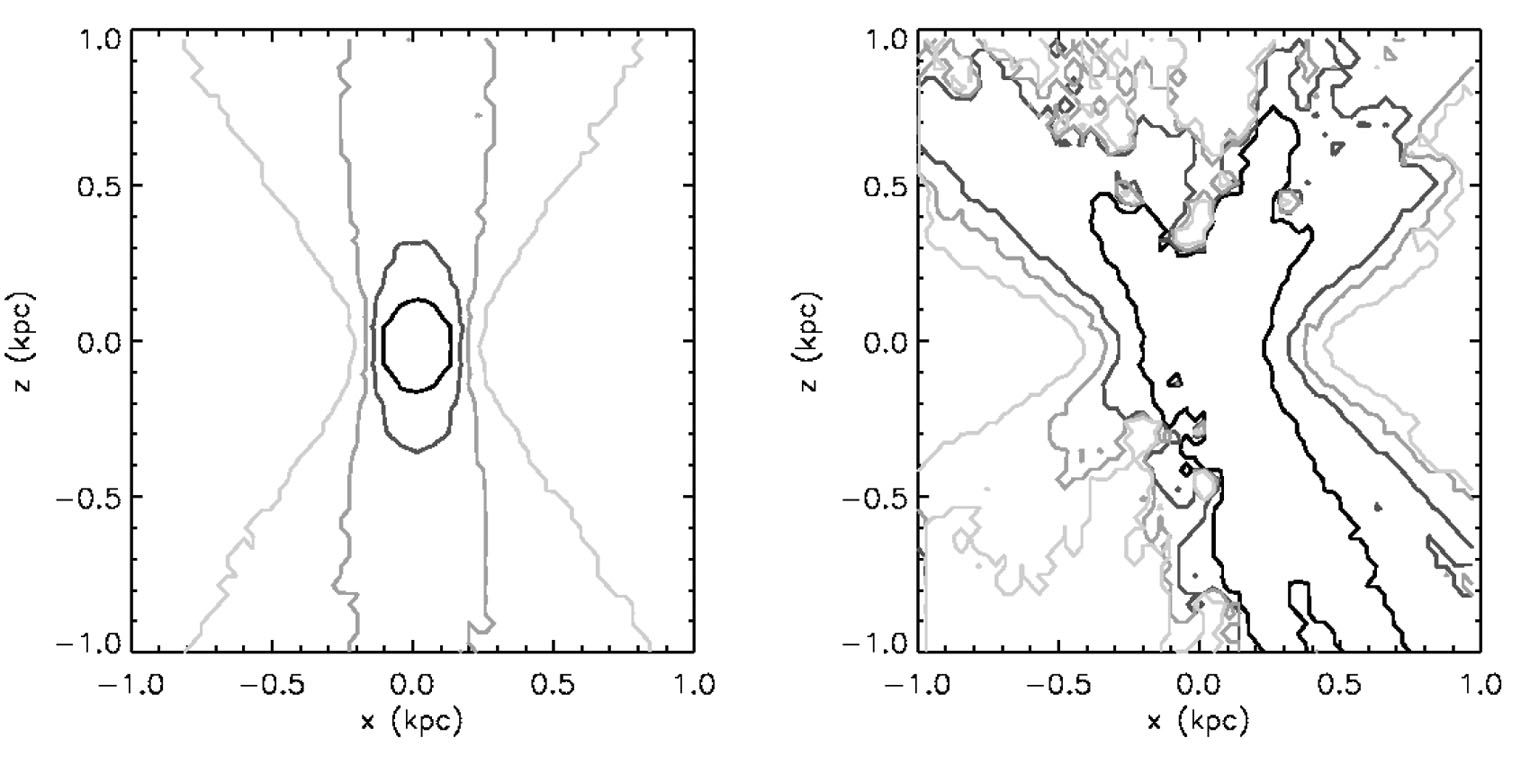 |
Figure 16. Slices through the ionization structure for point sources in (left) smooth and (right) hierarchically clumped density distributions. The mean vertical density structure for each simulation is that of a Dickey-Lockman disk. From the inner to outer contours the source luminosities (photons per second) are 1049, 3× 1049, 5× 1049 and 1050. Comparing the contours in the smooth and clumpy models, it is clear that the 3D density structure provides low density paths allowing photons to reach much larger distances from the ionizing source. |
5.3. Modeling the emission line spectrum of diffuse ionized gas
The physical conditions in the DIG are revealed through its emission line spectrum, which probes its ionization state and temperature structure (Section 2). The main observational characteristics that successful models of the DIG spectrum must address are:
and [O II] /
H,
appears to rise with increasing |z|-height above the plane. Most
of the nitrogen and oxygen are N+ and O+, and
[N II] and [O II], excited by electron collisions, are very sensitive to
temperature.
recombination line
intensity ratios.
is weak, at least near
the Galactic midplane, while in NGC 891 [O I] /
H is observed to
increase with increasing distance above the plane. Models predict that
interfaces between the ionized and neutral regions should be revealed by
increased [O I] / H and
a rapid rise of [N II] /
H and [S II] /
H near the transition
region, where the gas temperature is rising rapidly.
is seen to remain
high or even increase at large |z|-heights, whereas
photoionization models predict [O III] /
H to decrease with
height above the plane.
While the 2D and 3D techniques described above were used to explain the
formation and structure of the DIG via O-star photoionization,
detailed 1D photoionization codes were used to explain the DIG's
emission line spectrum (e.g.,
Mathis 1986,
Domgorgen and Mathis
1994,
Mathis 2000,
Sembach et
al. 2000,
Collins and Rand 2001,
Hoopes and Walterbos
2003).
In general, the 1D simulations
parameterized the problem with an ionization parameter, calculated the
ionization structure of a constant density spherically symmetric volume,
and formed line ratios by taking ratios of the total emission line
intensities from the entire volume. By combining simulations with
different ionization parameters and different supplemental heating
rates, these volume averaged models could explain many of the observed
line ratios in the DIG. However, 1D models do not allow for a
self-consistent explanation of the observed trends of line
ratios. In particular, [N II] /
H and [S II] /
H are
observed to be anticorrelated with the
H intensity and increase
with increasing distance from the midplane (e.g.,
Haffner et
al. 1999,
Rand 1998).
Explaining these observational trends requires models that do not use
volume averages, but form line ratios for lines of sight that pierce
through the ionized volume at increasing impact parameters away from the
ionizing source. The plane parallel slab models presented by
Bland-Hawthorn et
al. (1997)
showed how the depth dependence of the ionization and temperature
structure (see their Fig. 9) could explain the trends for [N II] /
H line ratios with
distance from the source. More recently,
Elwert and Dettmar
(2005)
presented a grid of plane parallel models that
could explain the observed increase of [N II] /
H and [S II] /
H above the midplane.
A persistent problem with all these photoionization models is that they
cannot explain the rise of [O III] /
H with height above
the plane unless some other ionization and/or heating source is invoked,
such as shocks, photoelectric heating, or turbulent mixing layers
(Collins and Rand 2001,
Reynolds et
al. 1999,
Slavin et al.
1993).
Also, unless the medium is fully ionized beyond the edge of the simulation
(i.e., density bounded) the models predict uncomfortably large
[O I] / H ratios
at the edge of the ionized volume. Clumping in H II regions may
explain the apparent absence of these edge effects as discussed below.
5.3.2. Two- and three-dimensional models
Recent advances in the development of Monte Carlo photoionization codes
(Och et al.
1998,
Ercolano et al.
2003,
Wood et al.
2004)
now enable calculations of the ionization and
temperature structure and emission line strengths for multiple ionizing
sources within 3D geometries.
Wood and Mathis (2004)
presented simulations for photoionization and
line intensity maps of a stratified interstellar medium. Their models
showed that due to hardening of the radiation field in the spectral
region between the H I and He I ionization
edges, the temperature naturally increases away from the ionizing
source. They also found that [N II] /
H and [S II] /
H
rise with |z| in their vertically stratified density structure
and that [S II] / [N II] remains fairly constant with |z| as
observed. While their models could explain most of the line ratios,
additional non-ionizing heating was still required to produce the
largest line ratios observed.
5.3.3 Interfaces and three-dimentional H II regions
In standard photoionization models of the
interface between ionized and neutral gas, the medium is turning neutral
and the temperature is rising rapidly due to the hardening of the
radiation field (e.g.,
Wood and Mathis 2004).
For optical observers, such an interface
should be characterized by enhanced emission of [O I], [N II], and [S II]
relative to H. As
mentioned above these effects have in general
not been observed in the DIG. However, recent results from the WHAM
survey of low emission measure H II regions do appear to show an
increase of [N II] / H
and [S II] / H away from
the ionizing sources
(Wood et al.
2005).
Fig. 17 shows that models of hierarchically
clumped H II regions give a shallower rise of [N II] /
H away from
the ionizing source than that predicted by uniform density models. This
is because the edge of the H II region is very irregular and
sightlines probe different columns of ionized gas and different
temperatures compared to the regular, rapid rise in temperature and
neutral fraction seen at the edge of a uniform density H II
region. This shallower rise is in better agreement with the
observations. Further work extending 3D models from individual H II
regions to study photoionization in global models of the interstellar
medium is required. This will test whether interfaces can indeed be
masked by 3D effects and the edges of H II regions may be lost in
diffuse foreground and background (non-interface) emission, although the
observed weakness of the [O I] emission still presents a
problem. Most photoionization codes neglect the effects of shocks and
the expansion of ionization fronts at the edges of H II regions.
Perhaps there is some crucial missing physics from current
photoionization codes that is important for modeling interface
emission. There are efforts underway to include such effects in the
CLOUDY photoionization code (Elwert 2005, private communication).
 |
Figure 17.
H |
5.3.4 Leaky H II regions and the He+ / H+ problem
Leaky H II regions appear to be an important source of ionizing photons for the DIG (see the discussion in Section 4). The ionizing photons escape from them either directly through empty holes or via escape through density bounded ionized gas. In the first case the escaping spectrum will be that of the ionizing star, while in the second case the spectrum will be modified due to partial absorption of the radiation by neutral H and He. Compared to the intrinsic stellar spectrum the escaping spectrum is generally harder in the H-ionizing continuum and has its He-ionizing photons supressed (e.g., Hoopes and Walterbos 2003, Wood and Mathis 2004).
A combination of direct escape and transmission through density bounded ionized gas is likely to occur in a 3D H II region. In fact, line ratios in the DIG surrounding leaky H II regions may allow us to determine whether the escaping photons are dominated by those escaping through true holes in the H II region or by those penetrating density-bounded H II gas. Specifically, the supression of He-ionizing photons penetrating density bounded H II regions may explain the underionization of He in the DIG. However, more observations of He I and other lines as a function of distance from H II regions in our Galaxy and others are required to test this. It cannot yet be ruled out that most of the DIG ionization is produced by later O stars (which have a soft spectrum consistent with the He I observations), because the earliest (hard-spectrum) O stars may preferentially have their ionizing radiation absorbed within their parent molecular clouds. However, a study of face-on galaxies suggests that these cooler O stars do not provide sufficient ionizing power (Ferguson et al. 1996). Clearly more observational and theoretical investigations are required into the role of leaky H II regions and the spectrum of their escaping ionizing radiation.
