


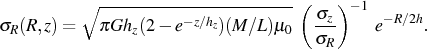
For a disk that is exponential in both the radial and vertical direction (cf. van der Kruit 1988):
 |
(10) |
Assuming a constant axis ratio of the velocity ellipsoid
 z /
R, we find
z /
R, we find
 |
(11) |
The distribution of the products
(M / L)1/2
(z /
R)-1
in the
Kregel et
al. (2005)
sample is shown in fig. 2. Thirteen of the
fifteen disks have 1.8
 (M / L)1/2
(z /
R)-1
3.3. The values
of the outliers may have been overestimated (see
Kregel et
al. 2005).
Excluding these, the
average is < (M / L)1/2
(z /
R)-1
> = 2.5 ± 0.2 with a
1 scatter of 0.6.
The near constancy of the product can be used with M / L
based on stellar population synthesis models to estimate the axis
ratio of the velocity ellipsoid. Conversely, the upper scale of
Fig. 2 indicates that a typical (I-band)
M / L of a galactic stellar disk is of order unity and
varies for the majority systems between 0.5 and 2.
(M / L)1/2
(z /
R)-1
3.3. The values
of the outliers may have been overestimated (see
Kregel et
al. 2005).
Excluding these, the
average is < (M / L)1/2
(z /
R)-1
> = 2.5 ± 0.2 with a
1 scatter of 0.6.
The near constancy of the product can be used with M / L
based on stellar population synthesis models to estimate the axis
ratio of the velocity ellipsoid. Conversely, the upper scale of
Fig. 2 indicates that a typical (I-band)
M / L of a galactic stellar disk is of order unity and
varies for the majority systems between 0.5 and 2.
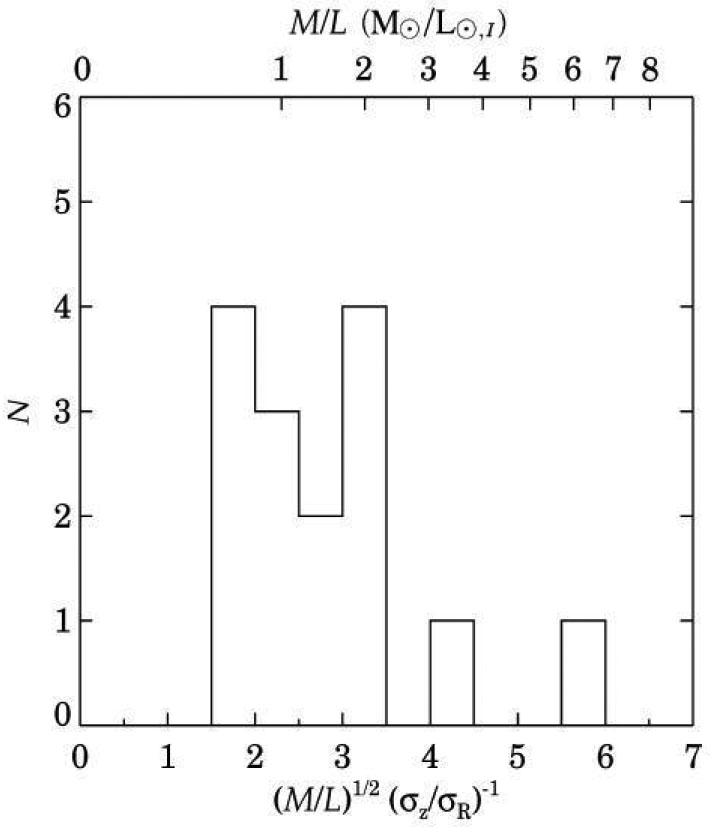 |
Figure 2. Histogram of the product
(M / L)1/2
( |
It is possible to relate the axis ratio of the velocity ellipsoid to the flattening of the stellar disk h / hz (van der Kruit & de Grijs 1999). In the radial direction the velocity dispersion is related to the epicyclic frequency through the Toomre parameter Q for local stability. The Tully-Fisher relation then relates this to the integrated magnitude and hence to the disk scalelength. In the vertical direction the scaleheight and the velocity dispersion relate through hydrostatic equilibrium.
Eqn. (9) shows that when Q and M / L are constant among galaxies, disks with lower (face-on) central surface brightness µo have lower stellar velocity dispersions. Combining eqn. (9) with eqn. (5) for hydrodynamic equilibrium and using eqn. (8) gives (Kregel et al. 2005, van der Kruit & de Grijs 1999)
 |
(12) |
The observed constancy of (M / L)1/2
(z /
R)-1
implies that the flattening of the disk h / hz
is proportional
to Q(M / L)1/2.
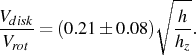
The mass-to-light ratio is a crucial measure of the contribution of the disk to the rotation curve and the relative importance of disk and dark halo mass in a galaxy. In the `maximum disk hypothesis' the disk contribution is optimized such that the amplitude of the disk-alone rotation curve is as large as the observations allow. In a maximal disk, the ratio between the disk-alone rotation curve and the observed one will be a bit lower than unity to allow a bulge contribution and let dark halos have a low density core. A working definition is Vdisk / Vrot = 0.85 ± 0.10 (Sackett 1997).
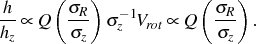
For an exponential disk, the ratio of the peak rotation velocity of the disk to the maximum rotation velocity of the galaxy (Vdisk / Vrot) is
 |
(13) |
Using eqn. (5) and eqn. (8) this can be rewritten as
 |
(14) |
So we can estimate the disk contribution to the rotation curve from
a statistical value for the flattening (see also
Bottema 1993,
1997,
van der Kruit
2002).
For the sample of
Kregel et
al. (2002)
this then results in Vdisk / Vrot =
0.57 ± 0.22 (rms scatter). In the dynamical analysis of
Kregel et
al. (2005),
the ratio Vdisk / Vrot
is known up to a factor
z /
R and
distance-independent. For
z /
R = 0.6,
vdisk / vrot = 0.53 ± 0.04,
with a 1 scatter of
0.15. Both estimates agree well. Thus, at
least for this sample, the average spiral has a submaximal disk.
The values obtained for individual galaxies are illustrated in figs. 3 and 4. Most galaxies are not `maximum-disk'. The ones that may be maximum disk have a high surface density according to fig. 2. From the panels we also note that disk that are maximal appear to have more anisotropic velocity distributions or are less stable according to Toomre Q,
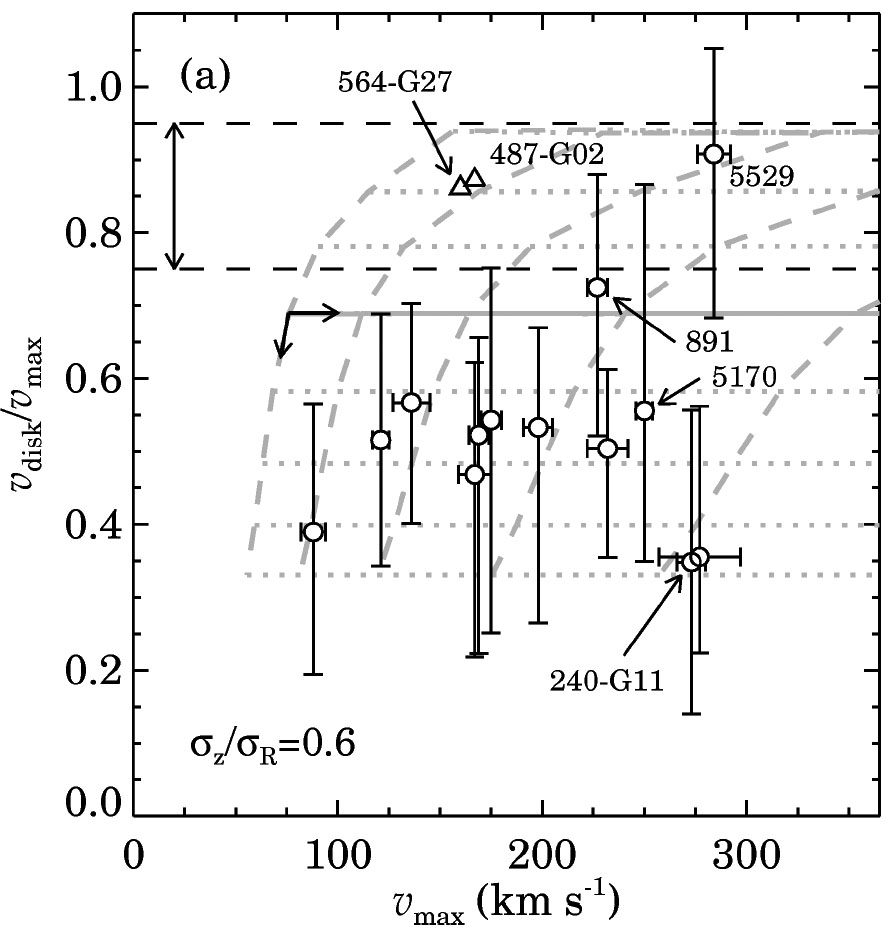 |
Figure 3. The contribution of the disk to the amplitude of the rotation curve Vdisk / Vrot. for a sample of 15 edge-on galaxies as a function of the rotation velocity itself. The horizontal dashed lines are the limits of 0.85 ± 0.10 from Sackett (1997), which would indicate maximal disks. The axis ratio of the velocity ellipsoid is assumed to be 0.6. The grey lines correspond to collapse models of Dalcanton et al. (1997). The two without error bars are the same galaxies as the outliers in fig. 2. (From Kregel et al. 2005) |
 |
Figure 4. Stellar dynamics parameters for edge-on galaxies. (a) The axis ratio of the velocity ellipsoid as a function of Vdisk / Vrot for Q = 2.0. (b) Vdisk / Vrot as a function of Q for an assumed axis ratio of the velocity ellipsoid of 0.6. (From Kregel et al. 2005) |
Originaly,
van der Kruit
& Freeman (1986)
used the property Y defined as a criterion for global stability
(Efstathiou et
al. 1982):
Y = Vrot
(h / G Mdisk)1/2
 1.1 for stability.
This is -up to a factor 0.62 for an infinitessimally thin exponential disk-
the reciprocal of the ratio Vdisk /
Vrot. Then they found Y = 1.0 ± 0.3
(van der Kruit
& Freeman 1986),
which corresponds to Vdisk / Vrot =
0.6 ± 0.2. It is remarkable -and probably significant- that all
values obtained for Vdisk / Vrot are
close to 0.6.
1.1 for stability.
This is -up to a factor 0.62 for an infinitessimally thin exponential disk-
the reciprocal of the ratio Vdisk /
Vrot. Then they found Y = 1.0 ± 0.3
(van der Kruit
& Freeman 1986),
which corresponds to Vdisk / Vrot =
0.6 ± 0.2. It is remarkable -and probably significant- that all
values obtained for Vdisk / Vrot are
close to 0.6.