


In this section, we examine the distribution of CO emission in the surveyed galaxies and we compare the CO to emission in other wavebands.
Fig. 1 shows the molecular clouds detected with the NANTEN Survey (Fukui et al., 2001; Fukui et al., 2006) on an optical image of the LMC. Except for a region near the eastern edge of the galaxy (left side of Fig. 1) below 30 Doradus, the clouds appear to be spatially well-separated and it is possible to pick them out individually by eye. The long string of bright CO emission along the eastern edge of the galaxy is likely composed of several clouds that cannot be separated at this resolution. Some have speculated that this feature is due to hydrodynamical collision between the LMC and SMC (Fujimoto and Noguchi, 1990) or ram pressure pileup of gas due to the motion of the LMC through a halo of hot, diffuse gas (de Boer et al., 1998; Kim et al., 1998). Supershells may also be playing a role in the formation of GMCs as in the case LMC4 (Yamaguchi et al., 2001a). A comprehensive comparison between supergiant shells and GMCs shows that only about 1/3 of the GMCs are located towards supershells, suggesting the effects of supershells are not predominant (Yamaguchi et al., 2001b). There is neither an excess nor a deficit of CO associated with the stellar bar, but the bright H2 regions are all clearly associated with molecular clouds. Individual clouds are frequently associated with young clusters of stars. Not every cluster of young stars is associated with a cloud nor does every cloud show evidence of massive star formation. Using this association and the ages of the stellar clusters, we can establish the evolutionary time scale for GMCs (Section 6).
 |
Figure 1. Optical image of the LMC with GMCs mapped with the NANTEN telescope indicated within the boundary of the survey area. The CO is well correlated with H2 regions. The GMCs are easily identified by eye except for the region south of 30 Doradus where they appear as a vertical line of clouds and the individual GMCs may be overlapping in this region. |
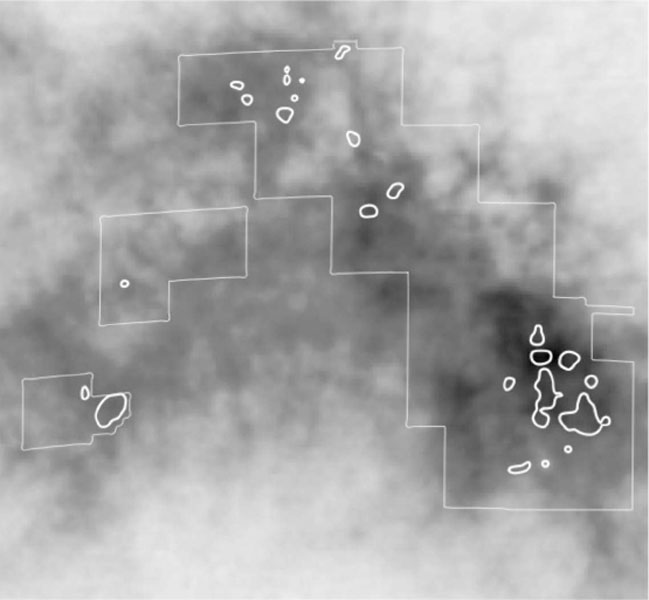
Fig. 2 shows the GMCs superimposed on a grayscale image made using the 3.6, 4.5, and 8.0 µm bands from the IRAC instrument on the Spitzer Space Telescope (Bolatto et al., 2006). The CO map is from the NANTEN telescope (Mizuno et al., 2006). As in the LMC, the GMCs in the SMC are easily identified by eye. Unlike the LMC, they are not spread throughout the galaxy but appear preferentially on the northern and southern ends of the galaxy. Another grouping is located to the east (left) of the SMC along the H I bridge that connects the LMC and SMC, apparently outside the stellar confines of the galaxy. The Spitzer image traces the stellar continuum as well as warm dust and PAH emission. The 8.0 µm emission is associated with the molecular gas traced by CO, but appears to be more extended than the CO emission. The SMC has the lowest metallicity in our sample and provides an opportunity to explore the behavior of molecular gas in chemically primitive environments.
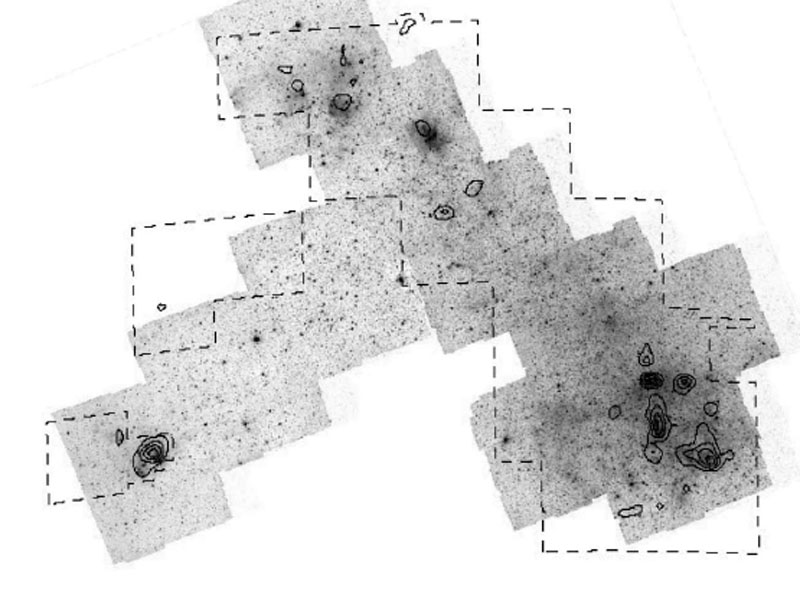 |
Figure 2. GMCs in the SMC observed with the NANTEN telescope overlayed on an a near-infrared image of the galaxy from the Spitzer Space Telescope (Bolatto et al., 2006). The lines indicate the survey boundary. The CO clouds are clearly associated with regions of transiently heated small grains or PAHs that appear as dark, nebulous regions in the image. |
Fig. 3 shows the locations of GMCs in M33 from the BIMA telescope
(Engargiola et al.,
2003)
superimposed on an H image of the galaxy
(Massey et al.,
2001).
The two low-contrast spiral arms
(Regan and Vogel,
1994)
are well-traced by GMCs, but the GMCs are not
confined to these arms as is evident in the center of the galaxy.
There is good spatial correlation between the GMCs and the H2
regions. Once again, the correlation is not perfect and there are
GMCs without H2 regions and vice versa. Unlike the other
images, we show the locations of the GMCs as circles with areas
proportional to the CO luminosity of each GMC; the CO luminosity is
expected to be proportional to the H2 mass of each GMC. Note
that the most massive GMCs (~ 106
M
image of the galaxy
(Massey et al.,
2001).
The two low-contrast spiral arms
(Regan and Vogel,
1994)
are well-traced by GMCs, but the GMCs are not
confined to these arms as is evident in the center of the galaxy.
There is good spatial correlation between the GMCs and the H2
regions. Once again, the correlation is not perfect and there are
GMCs without H2 regions and vice versa. Unlike the other
images, we show the locations of the GMCs as circles with areas
proportional to the CO luminosity of each GMC; the CO luminosity is
expected to be proportional to the H2 mass of each GMC. Note
that the most massive GMCs (~ 106
M ) are
not found toward the
center of the galaxy but along spiral arms north of the galactic
nucleus. These massive clouds are relatively devoid of
H
emission. The completeness limit of this survey is about 1.5 ×
105
M; thus
there are presumably many lower mass clouds below
the limit of sensitivity. Many of these low mass clouds are likely
associated with the unaccompanied H2 regions in the figure.
) are
not found toward the
center of the galaxy but along spiral arms north of the galactic
nucleus. These massive clouds are relatively devoid of
H
emission. The completeness limit of this survey is about 1.5 ×
105
M; thus
there are presumably many lower mass clouds below
the limit of sensitivity. Many of these low mass clouds are likely
associated with the unaccompanied H2 regions in the figure.
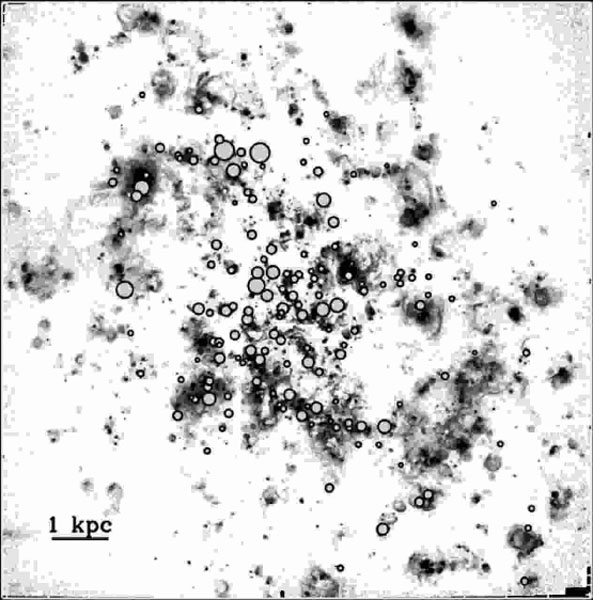 |
Figure 3. The locations of GMCs in M33
as derived from the 759 field BIMA mosaic of
Engargiola et al.
(2003).
Since sources of CO emission in a map would be too
small to identify in the figure, the locations of GMCs are instead
indicated by light gray circles. The area of the circles is scaled to the
CO luminosity which should be proportional to the H2 mass. The
GMC locations are overlayed on a continuum subtracted
H |
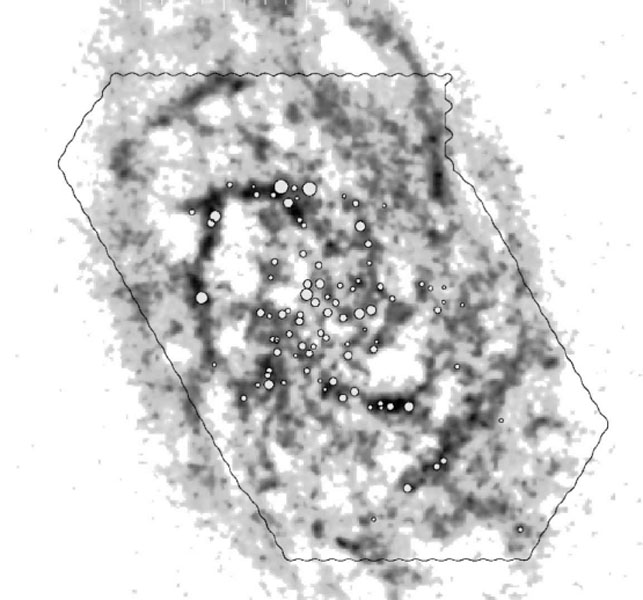
Fig. 4 is an image of the GMCs in IC 10 from a 50 field CO mosaic with the BIMA telescope (Leroy et al., 2006) superimposed on a 2 µm image of the galaxy made from 2MASS data (Jarrett et al., 2003). As with the Magellanic Clouds and M33, the GMCs show no obvious spatial correlation with old stellar population - some massive clouds are found where there are relatively few stars.
 |
Figure 4. The GMCs in IC 10 made from a 50 field mosaic of the galaxy with the BIMA telescope overlayed on a 2 µm image of the galaxy from the 2MASS survey. The dark gray area corresponds to CO brightness above 1 K km s-1; the light gray area corresponds to CO brightness above 10 K km s-1. The black region in the center has the highest stellar surface density. The rms noise of the CO data is ~ 0.3 K km s-1in each channel map; the peak value in the integrated intensity map is 48 K km s-1 (Leroy et al., 2006). |
The distribution of GMCs in these four galaxies shows little
correlation with old stars (see Figs. 1 and
4). The obvious correlations with
H
(Figs. 1 and
3) and young stellar clusters
(Fig. 1) are
expected since these trace the star formation that occurs within GMCs.
That the correlation is not perfect can be used to deduce information
about the evolution of the clouds (Section 6).
To examine
the relationship of GMCs to the remainder of the neutral ISM, we plot
the locations of CO emission on top of H I maps of these four
galaxies in Fig. 5. A strong correlation between the
atomic and molecular gas is immediately apparent. Every GMC in each
of the galaxies is found on a bright filament or clump of H I,
but the reverse is not true: there are many bright filaments of
H I without molecular gas. In M33, the largest of the fully
mapped galaxies, the ratio of H I to CO in the filaments in the
center of the galaxy is smaller than in the outer parts. In the LMC,
the CO is generally found at peaks of the
H I, but most of the short filaments have no associated CO. In
the SMC, the H I is so widespread that the CO clouds
appear as small, isolated clouds in a vast sea of H I. Apparently,
H I is a necessary but not a sufficient condition for the
formation of GMCs in these galaxies.
 |
 |
 |
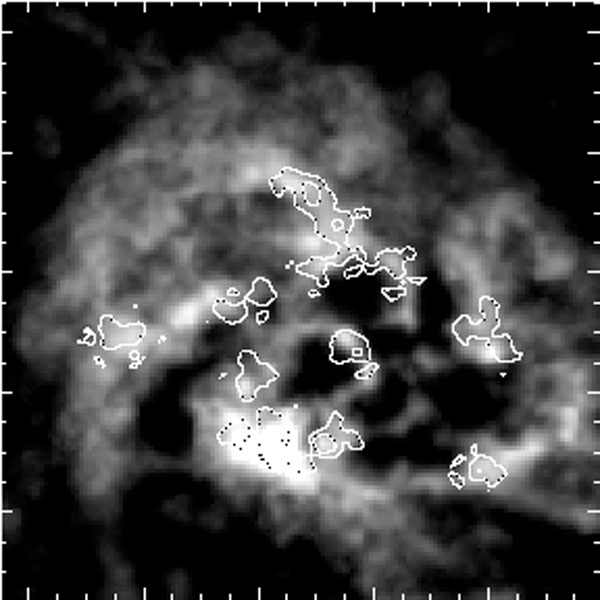 |
Figure 5. CO emission overlayed on maps of H I emission for the LMC (top left), the SMC (top right), M33 (bottom left) and IC 10 (bottom right). The H I maps are the work of Kim et al. (2003, LMC), Stanimirovic et al. (1999, SMC), Deul and van der Hulst (1987, M33), and Wilcots and Miller (1998, IC 10). Contours of the CO emission are shown in each case except for M33 where the emission is indicated as circles with area proportional to the flux. Where appropriate, the boundaries of the surveys are indicated. CO emission is found exclusively on bright filaments of atomic gas though not every bright H I filament has CO emission. |
|
Figs. 1 - 4 show that the molecular gas forms from the H I, rather than the H I being a dissociation product of the molecular clouds as some have advocated (e.g., Allen, 2001). First, in all four galaxies the H I is much more widespread than the detected CO emission. Thus, most of the H I cannot be dissociated H2 without violating mass conservation if the GMC lifetimes are as short as we derive in Section 6. Second, there is no CO associated with most of the filaments in the LMC, M33, and IC 10 and the column density of these CO-free filaments is about the same as the column density of filaments which have CO emission. Because there is no transition in H I properties at radii where one observes CO, and the radii where it is absent, it is difficult to imagine that two separate origins for the H I would produce a seamless transition. Finally, the H I in the filaments between GMCs has the wrong geometry to be a dissociation product; there is too much gas strung out along the filaments to have come from dissociation of the molecular gas.
2.6. Implications for GMC Formation
What can the morphology of the atomic gas tell us about GMCs and their formation? All the H I images are characterized by filamentary structures that demarcate holes in the atomic distribution. In IC 10, there is good evidence that some of the holes are evacuated by the action of supernovae or stellar winds which sweep up the atomic gas into the observed filamentary structure (Wilcots and Miller, 1998). In contrast, most of the large holes observed in the M33 H I distribution are not likely to be caused by supernovae. The large holes require about 1053 ergs to evacuate, but there are no obvious stellar clusters remaining at the center of the holes. Furthermore, x-ray emission is not concentrated in the holes. The large holes in M33 are thus likely to have a gravitational or density-wave origin. Small holes with D < 200 pc, on the other hand, are found to be well correlated with OB associations (Deul and van der Hulst, 1987); these tend to be concentrated toward the center of the galaxy.
This leads to some qualitative conclusions about the formation of GMCs and ultimately the star formation that occurs within them. Because the CO forms from H I filaments and not the other way around, it is the filaments in a galaxy that must form first as precursors to the GMCs. In some of the galaxies, such as M33 and apparently in the LMC and the SMC, most of the filaments are not associated with energetic phenomena. This clearly rules out the self-propagating star formation picture that was promoted some years back by Gerola and Seiden (1978) for most of our galaxies. In their picture, GMC formation and thus star formation propagates by means of supernovae that explode in regions of a galaxy adjacent to a previous episode of star formation. However, in IC 10, because there is evidence that some of the H I morphology may be the result of energetic events from previous generations of stars, self-propagating star formation may be a viable mechanism. The critical element of GMC formation across all these systems appears to be the assembly of H I filaments, though the mechanism that collects the atomic gas appears to vary across the systems.
But why, then, do some filaments form GMCs and not others? We argue in Section 5, that it is the result of the pressure to which filaments are subjected.