


The evolution of GMCs substantially influences the evolution of galaxies. In particular, star formation in GMCs is a central event that affects galactic structure, energetics, and chemistry. A detailed understanding of star formation is therefore an important step for a better understanding of galaxy evolution.
6.1. Identification of Star Formation
In Galactic molecular clouds, we are able to study the formation of stars from high mass to low mass including even brown dwarfs. In all external galaxies, even those in the Local Group, such studies are limited to only the highest mass stars as a result of limited sensitivity. It is nonetheless worthwhile to learn how high-mass stars form in GMCs because high-mass stars impart the highest energies to the ISM via UV photons, stellar winds, and supernova explosions.
Young, high-mass stars are apparent at optical/radio
wavelengths as the brightest members of stellar clusters or associations
or by the H and radio
continuum emission from H2
regions. The positional coincidence between these signposts of star
formation and GMCs is the most common method of identifying the star
formation associated with individual clouds. Such associations can be
made with reasonable confidence when the source density is small enough
that confusion is not important. When confusion becomes significant,
however, conclusions can only be drawn by either making more careful
comparisons at higher angular resolution should or by adopting a
statistical approach.
and radio
continuum emission from H2
regions. The positional coincidence between these signposts of star
formation and GMCs is the most common method of identifying the star
formation associated with individual clouds. Such associations can be
made with reasonable confidence when the source density is small enough
that confusion is not important. When confusion becomes significant,
however, conclusions can only be drawn by either making more careful
comparisons at higher angular resolution should or by adopting a
statistical approach.
6.2. The Large Magellanic Cloud
The most complete datasets for young stars are available for the LMC,
which has a distance of 50 kpc. They include catalogs of clusters and
associations (e.g.,
Bica et al., 1996)
and of optical and radio H2 regions
(Henize, 1956,
Davies et al., 1976,
Kennicutt and Hodge, 1986,
Filipovic et al.,
1998).
The colors of the stellar clusters are studied in detail at four optical
wavelengths and are classified into an age sequence from SWB0 to SWB
VII, where SWB0 is the youngest with an age of less than 10 Myr, SWB I
in a range 10-30 Myr, and so on
(Bica et al., 1996).
The sensitivity limit of the published catalogs of star clusters is 14.5
mag (V); it is not straightforward to convert this into the number
of stars since a stellar mass function must be assumed. The datasets
of H2 regions have a detection limit in
H flux of
10-12 ergs cm-2 s-1, and the radio
sensitivity limit at
5 GHz thermal emission corresponds to 20 mJy. The faintest detectable
H2 regions correspond to the ionization by an O5 star if a
single ionizing source is assumed. We note that the detection limit of
H2 regions is quite good,
L(H) = 2
× 1036 ergs s-1, corresponding to one-fourth
the luminosity of the Orion Nebula.
Using the first NANTEN CO survey (Fukui et al., 1999; Mizuno et al., 2001b), the GMCs in the LMC were classified into the three categories according to their associated young objects (Fukui et al., 1999; Yamaguchi et al., 2001c):
luminosity is less than 1037 erg s-1
luminosity
greater than 1037 erg s-1.The new NANTEN GMC catalog (Fukui et al., 2006) is used to improve and confirm the statistics of these three classes (Kawamura et al., 2006). For the updated sample of 181 GMCs in Fig. 1, Fig. 11 shows the frequency distribution of the apparent separation of young objects, i.e., optical H2 regions and stellar clusters, measured from the lowest contour of the nearest GMC. Obviously, the youngest stellar clusters, SWB0 and H2 regions, exhibit marked peaks within 50-100 pc, indicating their strong concentrations towards GMCs. Comparisons of these distributions with a purely random distribution is shown by lines. The differences between these peaks are significant. The correlation with young clusters establishes the physical association of the young objects with the GMCs. On the other hand, clusters older than SWB I show almost no correlation with GMCs.
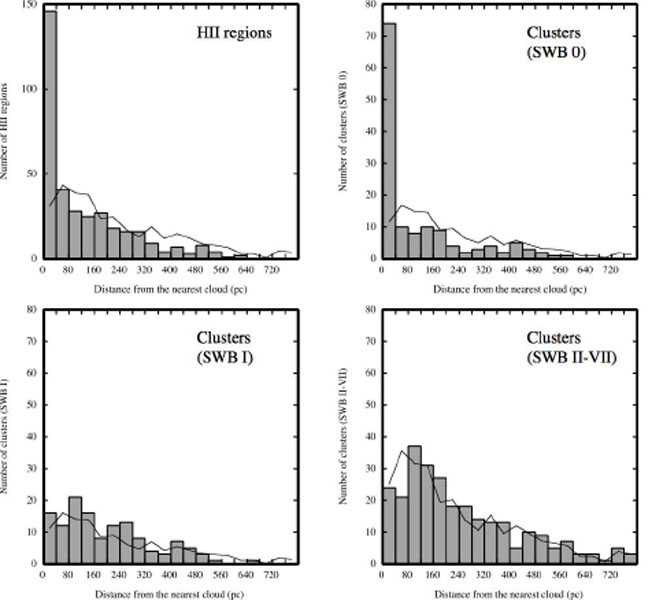 |
Figure 11. Histograms of the projected
separation from the H II regions (Top left
Davies et al. 1976)
and clusters cataloged by
Bica et al. (1996)
to the neareset CO emission; (Top right) clusters with
|
In order to look for any optically obscured H2 regions we have
also used the Parkes/ATNF radio continuum survey carried out at five
frequencies 1.4, 2.45, 4.75, 4.8, and 8.55 GHz
(Filipovic et al.,
1995,
1998).
The typical sensitivity limits of these new
datasets are quite good, allowing us to reach flux limits equivalent
to those in H. The radio
continuum results are summarized in a catalog of 483 sources, and the
spectral information makes it possible to select
H2 regions and eliminate background sources not related the
LMC. By comparing these data with the GMCs, we found
that all of the starless GMCs have no embedded H2 regions that are
detectable at radio wavelengths
(Kawamura et al.,
2006).
Table 4 summarizes the results of the present
comparison between GMCs and young objects, SWB0 clusters and the
H2 regions including radio sources. It shows that ~ 25%
of the GMCs are starless in the sense that they are not associated
with H2 regions or young clusters. Fig. 12
shows mass histograms of the three classes, I, II and III. These
indicate that the mass range of the three is from 104.5
M to a
few times 106
M. It is
also noteworthy that class I GMCs tend to be less massive than the other
two in the sense that the number of GMCs more massive than
105
M is
about half of those of class II and class III GMCs, respectively.
to a
few times 106
M. It is
also noteworthy that class I GMCs tend to be less massive than the other
two in the sense that the number of GMCs more massive than
105
M is
about half of those of class II and class III GMCs, respectively.
| Class of GMC | Number of GMCs a | Time scale b | Association |
| (Myr) | |||
| Class I | 44 (25.7 %) | 7 | Starless |
| Class II | 88 (51.5 %) | 14 | H2 regions |
| Class III | 39 (22.8 %) | 6 | H2 regions and clusters c |
|
a GMCs with M > 104.5
M; mass
is derived by using
XCO = 5.4 × 1020 cm-2 (K km
s-1)-1 (Table 2).
b A steady state evolution is assumed. The absolute time scale is based on the age of stellar clusters; the age of SWB0 clusters, a half of which are associated with the GMCs, is taken to be 10 Myr. c Young clusters or associations, SWB 0, by Bica et al. (1996). |
|||
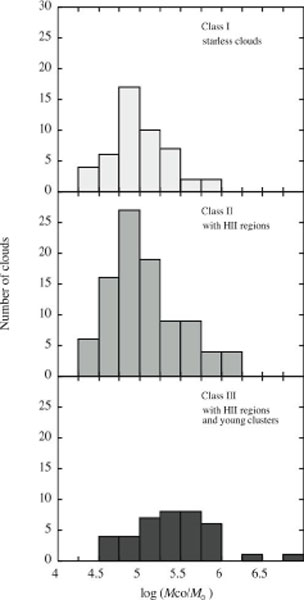 |
Figure 12. Histograms of the mass of class I (Top), class II (Middle), and class III (Bottom), respectively. Mass is derived by using XCO = 5.4 × 1020 cm-2 (K km s-1)-1 (Table 2). |
6.3. The Evolution of GMCs in the LMC
The completeness of the present GMC sample covering the whole LMC enables us to infer the evolutionary timescales of the GMCs. We assume a steady state evolution and therefore time spent in each phase is proportional to the number of objects in Table 4. Fig. 13 is a scheme representing the evolution suggested from Table 4. The absolute time scale is based on the age of stellar clusters: the age of SWB 0 clusters is taken to be 10 Myr. The first stage corresponds to starless GMCs, having a long time scale of 7 Myr. This is followed by a phase with small H2 regions, implying the formation of a few to several O stars. The subsequent phase indicates the most active formation of rich clusters including many early O stars (one of such an example is N 159N). In the final phase, the GMC has been more or less dissipated under the strong ionization and stellar winds from O stars. The lifetime of a typical GMC in the LMC is then estimated as the total of the timescales in Table 4: ~ 27 Myr, assuming that the GMC is completely disrupted by the star formation. As noted earlier (Section 6), the mass of class I GMCs tends to be smaller than the rest. We may speculate that class I GMCs, and possibly part of class II GMCs, are still growing in mass via mass accretion from their surrounding lower density atomic gas. In addition, the lifetime of GMCs likely varies with cloud mass, so 27 Myr is only a characteristic value and is probably uncertain by about 50%.
 |
Figure 13. Evolutionary sequence of the
GMCs in the LMC. An
example of the GMCs and illustration at each class are shown in the
left panels and the middle column, respectively. The images and
contours in the left panels are
H |
None of the other galaxies in our sample has as complete a record of
interstellar gas and star formation as does the LMC, which is due, in
part, to its proximity. Nevertheless, it is possible to draw some
conclusions about the star formation in M33.
Engargiola et al.
(2003)
correlated the H2 regions cataloged by
Hodge et al. (1999)
with the 149 GMCs in the M33 catalog. For reference, the completeness limit
of the
Hodge et al. (1999)
cataloge is L(H)
= 3 × 1035 erg s-1; a similar
range of H2 regions is cataloged in the LMC and M33.
Engargiola et al.
(2003)
assumed that an H2 region is
associated with a GMC if its boundary lies either within or tangent to
a GMC; 36% of the flux from
H2 regions can be associated with the cataloged GMCs.
Correcting for the incompleteness of the GMCs cataloged below their
sensitivity limit suggests that > 90% of the total flux of ionized
gas from M33 originates from GMCs. Within the uncertainties,
essentially all of the flux from H2 regions is consistent with
an origin in GMCs. Apparently, about half of the star formation in
M33 originates in GMCs below the the sensitivity
limit of our survey.
A related question is to ask, what fraction of GMCs in M33 is actively forming stars?
Engargiola et al.
(2003)
counted the fraction of
GMCs with at least one H2 region having a separation
 r. They defined
the correlation length, such that half the GMCs have
at least one H2 region within this distance. The correlation
length for the GMCs and H2 regions is 35 pc; a random
distribution of GMCs and H2 regions would return a correlation
length of 80 pc. They assumed that a GMC is actively forming stars if
there is an H2 region within 50 pc of the centroid of a GMC.
With this assumption, as many as 100 GMCs (67 %) are forming massive
stars. Of the 75 GMCs with masses above the median cataloged mass,
the fraction of clouds actively forming stars rises to 85%. They
estimate that the number of totally obscured H2 regions affect
these results by at most 5%.
r. They defined
the correlation length, such that half the GMCs have
at least one H2 region within this distance. The correlation
length for the GMCs and H2 regions is 35 pc; a random
distribution of GMCs and H2 regions would return a correlation
length of 80 pc. They assumed that a GMC is actively forming stars if
there is an H2 region within 50 pc of the centroid of a GMC.
With this assumption, as many as 100 GMCs (67 %) are forming massive
stars. Of the 75 GMCs with masses above the median cataloged mass,
the fraction of clouds actively forming stars rises to 85%. They
estimate that the number of totally obscured H2 regions affect
these results by at most 5%.
Thus the fraction of GMCs without star formation is estimated to be about 1/3, a fraction similar to that in the LMC. The M33 study estimated the lifetime of GMCs to be ~ 20 Myr, also similar to that found for the LMC. The fraction of clouds without active star formation is much higher than that found in the vicinity of the Sun where only one of all of the GMCs within 2 kpc is found to be devoid of star formation. It is unclear whether this difference is significant. Neither the LMC analysis, nor the M33 analysis would detect the low-mass star formation which it is proceeding in the Taurus molecular clouds. In any event, both the LMC and M33 studies suggest that the fraction of clouds without star formation is small. Thus the onset of star formation in GMCs is rather rapid not only in the Milky Way, but in at least some lower mass spiral and irregular galaxies.
 < 10 Myr (SWB 0),
(Bottom left) clusters with 10 Myr <
< 10 Myr (SWB 0),
(Bottom left) clusters with 10 Myr <