


While it is common practice, and somewhat helpful, to call elliptical galaxies fainter than about MB = -18 mag by the term "dwarf elliptical" (Sandage & Binggeli 1984), it should be noted, and this section will reveal, that on all measures they appear to be the low-mass end of a continuous sequence which unifies dwarf and normal/luminous elliptical galaxies. Not only is this true in terms of their structural properties (e.g. Binggeli et al. 1984; Graham & Guzmán 2003; Gavazzi et al. 2005; Ferrarese et al. 2006a; Côté et al. 2006, 2007, 2008; Misgeld et al. 2008, 2009; Janz & Lisker 2009; Graham 2010; Chen et al. 2010; Glass et al. 2011) but even the degree of kinematically distinct components is similar (Chilingarian 2009).
There are many important relations between stellar luminosity, colour, metallicity, age, and dynamics that reveal a continuous and linear behaviour uniting dwarf and giant elliptical galaxies (e.g. Caldwell 1983; Davies et al. 1983; Binggeli et al. 1984; Bothun et al. 1986; Geha et al. 2003; Lisker & Han 2008). However, Kormendy et al. (2009, their section 8) dismiss all of these apparently unifying relations by claiming that they must not be sensitive to different physical processes which they believe have produced a dichotomy between dwarf and ordinary elliptical galaxies. They claim that it is only relations which show an apparent different behavior at the faint and bright end that are sensitive to the formation physics and the remainder are not relevant. This section explains why such non-linear relations are actually a consequence of the (dismissed) linear relations, and as such these non-linear relations actually support a continuum between dwarf and ordinary elliptical galaxies.
To begin, it should be reiterated that (dwarf and ordinary) elliptical galaxies - and the bulges of disc galaxies (section 4.1) - do not have structural homology. Instead, they have a continuous range of stellar concentrations - quantified by the Sérsic index n (Davies et al. 1988; Caon et al. 1993; D'Onofrio et al. 1994; Young & Currie 1994, 1995; Andredakis et al. 1995) - that varies linearly with both stellar mass and central surface brightness (after correcting for central deficits or excess light). A frequently unappreciated consequence of these two linear relations is that relations involving either the effective half-light radius (Re) or the effective surface brightness (µe), or the mean surface brightness within Re (< µ >e), will be non-linear. Such curved relations have often been heralded as evidence that two different physical processes must be operating because the relation is not linear and has a different slope at either end. To further complicate matters, sample selection which includes faint and bright elliptical galaxies, but excludes the intermediate-luminosity population, can effectively break such continuously curved relations into two apparently disconnected relations, as can selective colour-coding.
There are three distinct types of (two-parameter) relations involving
the properties of elliptical galaxies: (i) linear relations which are
taken to reveal the unified nature
of dEs and Es; (ii) curved relations revealing a continuity that had in the
past been mis-interpreted to indicate that distinct formation
process must be operating; and (iii) broken relations which imply that
two physical mechanisms are operating.
In the following sections we shall learn how the linear relations
result in the existence of curved relations when using effective radii and
surface brightnesses. We shall also see that the transition in the broken
relations occurs at MB
 -20.5 mag and thus
has nothing to do with the previously held belief that dEs and Es are
two distinct species separated at MB = -18 mag
(Wirth & Gallager
1984;
Kormendy 1985b,
2009).
-20.5 mag and thus
has nothing to do with the previously held belief that dEs and Es are
two distinct species separated at MB = -18 mag
(Wirth & Gallager
1984;
Kormendy 1985b,
2009).
This section introduces two key relations, from which a third can be derived, involving structural parameters. They are the luminosity-concentration (L - n) relation and the luminosity-(central density) 16 (L - µ0) relation. We shall use the Sérsic shape parameter n to quantify the central concentration of the radial light profile, and use the projected central surface brightness µ0 as a measure of the central density. 17
It is noted that one can expect a certain level of scatter in the L - n and L - µ0 diagrams because both the central density and the radial concentration of stars that one observes depends upon the chance orientation of one's triaxial galaxy (Binney 1978). This is of course also true for measurements of effective surface brightness, half-light radii, velocity dispersions, etc. To have the best relations, it is important that we use Sérsic parameters from elliptical galaxies rather than parameters from single-Sérsic fits to samples of elliptical and lenticular galaxies given the two-component (2D-disc plus 3D-bulge) nature of the lenticular galaxies. Given the offset nature of bulges and elliptical galaxies in the L - n diagram (e.g. Graham 2001; see also Möllenhoff & Heidt 2001) it is also important that bulges not be combined in this section's analysis of elliptical galaxy scaling relations.
3.1.1. Luminosity-(central surface brightness) relation
Caldwell (1983;
his Figure 6) and
Bothun et al. (1986,
their figure 7) revealed that, fainter than MB
-20.5 mag, there is a
continuous linear relation between luminosity and central surface
brightness. Furthermore,
Binggeli et al. (1984,
their figure 11) and Binggeli & Cameron
(1991,
their figure 9 and 18)
revealed that, when using the inward extrapolation of King models,
the L - µ0 relation is continuous and
roughly linear from -12 > MB > -23 mag. This
same general result was also highlighted by
Jerjen & Binggeli
(1997)
and
Graham & Guzmán
(2003)
when using the inward extrapolation of the Sérsic model.
The benefit of this approach is that one's central surface brightness
is not biased by the presence of a depleted
core or any additional nuclear components within the host galaxy.
Figure 7a displays the elliptical galaxy
(MB, µ0) data set from
Graham & Guzmán
(2003)
fit by the expression
 |
(6) |
The actual central surface brightness of the luminous "core galaxies" is shown in Figure 7a, rather than the value obtained from the inward extrapolation of their outer Sérsic profile. As such these "core galaxies" were excluded from the fit, but see the discussion in section 3.3. As an aside, if the central supermassive black hole mass Mbh in elliptical galaxies is directly related to the central stellar density (see Graham & Driver 2007), then the connections between Mbh and the global galaxy properties, such as total mass and velocity dispersion, may be secondary.
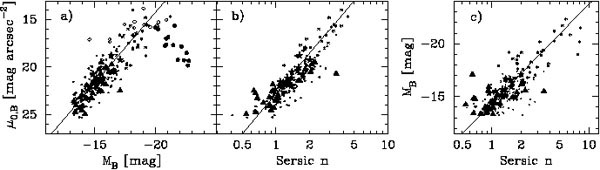 |
Figure 7. Linear relations between the observed B-band central surface brightness (µ0,B) with a) the absolute B-band magnitude MB and b) the Sérsic index n for a sample of elliptical galaxies. Panel c) shows the galaxy magnitudes versus the Sérsic indices, with the line given by equation 7. The "core galaxies" (large filled circles) with partially depleted cores can be seen to have lower central surface brightnesses than the relation in panel a). Inward extrapolation of their outer Sérsic profile yields µ0 values which follow the linear relation, as previously noted by Jerjen & Binggeli (1997. The data have come from the compilation by Graham & Guzmán (2003, their figure 9). Dots represent dE galaxies from Binggeli & Jerjen (1998), triangles represent dE galaxies from Stiavelli et al. (2001), large stars represent Graham & Guzmán's (2003) Coma dE galaxies, asterix represent intermediate to bright E galaxies from Caon et al. (1993) and D'Onofrio et al. (1994), open circles represent the so-called "power-law" E galaxies from Faber et al. (1997) and the filled circles represent the "core" E galaxies from these same Authors. |
3.1.2. Luminosity-concentration relation
The linear relation between luminosity and Sérsic index, or strictly speaking the logarithm of these quantities, has been shown many times (e.g. Young & Currie 1994; Jerjen & Binggeli 1997; Graham & Guzmán 2003; Ferrarese et al. 2006a). This continuous relation between magnitude and concentration 18 for elliptical galaxies had of course been recognised before (e.g. Ichikawa et al. 1986, their figure 11). The following MB - n expression is shown in Figure 7c, again matched to the sample of elliptical galaxies compiled by Graham & Guzmán (2003).
 |
(7) |
Graham & Guzmán (2003) excluded two-component lenticular galaxies fit by others with a single-component Sérsic model. It may be prudent to continue to exclude these galaxies even after a Sérsic-bulge plus exponential disc fit because the MB - n relation defined by bulges, at least in spiral galaxies, is different to that defined by elliptical galaxies (Graham 2001, his figure 14).
3.1.3. Concentration-(central surface brightness) relation
Combining the above two equations provides an expression between central surface brightness and Sérsic index such that
 |
(8) |
which is shown in Figure 7b, where it can be
seen to be roughly applicable for values of n
 1.
1.
This section explains why, as a direct result of the above linear relations - which unite dwarf and giant elliptical galaxies - expressions involving either the effective half-light radius Re, the associated effective surface brightness µe at this radius, or the mean surface brightness < µ > e enclosed within this radius, are curved.
3.2.1. Luminosity-(effective surface brightness) relation
The following analysis is from Graham & Guzmán (2003).
Given the empirical MB - n relation (equation 7), one knows what the expected value of n is for some value of MB. One can then convert the empirical MB - µ0 relation (equation 6) into an MB - µe relation using the exact relation between µ0 and µe which depends only on the value of n (equation 2). Doing so, one obtains the expression
 |
(9) |
where b
1.9992n - 0.3271 and
equation 7 is used to replace n in terms of MB,
such that n = 10-(14.3+MB) / 9.4.
One can similarly convert the empirical MB-µ0 relation (equation 6) into an MB - < µ > e relation using the exact relation between µ0 and < µ > e which also depends only on the value of n (equation 3). Doing this, one obtains the expression
 |
(10) |
where again b
1.9992n - 0.3271 and equation 7 is used to
replace n in terms of MB.
These curves can be seen in Figure 8 (adapted
from
Graham & Guzmán
2004).
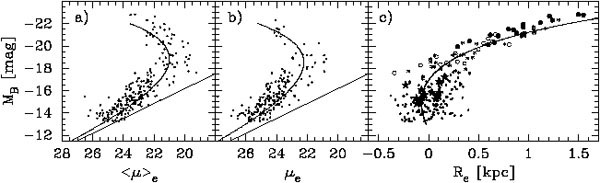 |
Figure 8. Elliptical galaxy B-band magnitude versus a) mean effective surface brightness (equation 10), b) effective surface brightness (equation 9), and c) effective radius (equation 11). The continuous, curved relations are predictions from the observed linear relations in Figure 7. The slight mismatch seen here arises from the rough fitting-by-eye of the linear relations. The data points have come from the compilation by Graham & Guzmán (2003, their figure 9). |
Binggeli et al. (1984, their figure 8) and Capaccioli & Caon (1991) previously showed with empirical data that the MB - < µ > e relation is curved. What was new in Graham & Guzmán (2003) was the explanation. In the past, evidence of non-linear relations involving parameters from dwarf and giant elliptical galaxies were heralded as evidence of a dichotomy. Coupled with galaxy sample selection that excluded the intermediate population, and therefore resulted in two apparently disconnected relations, acted to further convince some that they were dealing with two classes of object. 19
3.2.2. Size-Luminosity relation
Now that we know how to play this game, one can additionally make
predictions for relations involving the effective radius
Re because we know that
the luminosity L = 2 < I >e
Re2, with <
µ >e = -2.5log < I
>e. As explained in Graham & Worley
(2008,
their section 5.3.1), one can derive the
size-luminosity relation such that
< I >e
Re2, with <
µ >e = -2.5log < I
>e. As explained in Graham & Worley
(2008,
their section 5.3.1), one can derive the
size-luminosity relation such that
 |
(11) |
for 0.5 < n < 10, with b
1.9992n - 0.3271
and where equation 7 is used to replace n in terms of
MB.
This size-luminosity relation for elliptical galaxies is shown in
Figure 8c along with real galaxy data.
Binggeli et al. (1984, their figure 7; cf. Misgeld & Hilker 2011, their figure 1) also demonstrated, with empirical data, that the L - Re relation for dwarf and giant elliptical galaxies is curved. Their diagram, in addition to Figure 8c seen here, reveals why studies which only sample bright elliptical galaxies are often contempt to simply fit a straight line (e.g. Kormendy 1977b). The explanation for why this happens is of course akin to approximating the Earth as flat when one (forgivably) does not sample enough of what is actually a curved profile. As Graham et al. (2006, their figure 1b) re-revealed recently, and as reiterated by Bernardi et al. (2007), a sample of massive elliptical galaxies will have a steeper size-luminosity relation than a sample of ordinary elliptical galaxies, which will in turn have a steeper size-luminosity relation than a sample of dwarf elliptical galaxies because the size-luminosity relation is curved. Graham & Worley (2008) explains why the L - Re relation given by equation 11, based on two linear relations and the functional form of Sérsic's model, is curved.
Interestingly, due to the linear relations between magnitude, central surface brightness and the logarithm of the Sérsic exponent n, the use of faint isophotal radii results in what is roughly a linear size-luminosity relation (e.g. Oemler 1976; Strom & Strom 1978; Forbes et al. 2008; van den Bergh 2008; Nair et al. 2011), with the bright-end slope dependent on the adopted isophotal limit or Petrosian radius used. The implications of this important observation shall be detailed elsewhere.
Helping to propagate the belief that dwarf and ordinary elliptical galaxies are distinct species, Dabringhausen et al. (2008) and Lisker (2009) fit a double power-law to their curved size-luminosity relation for dwarf and ordinary elliptical galaxies, thus yielding distinct slopes at the faint and bright end. In addition, the interesting study by Janz & Lisker (2008) reported small deviations from the predicted curved relation. However, galaxies that are well described by Sérsic's function and which follow linear M - n and M - µ0 relations must follow a single curved M - Re relation. The deviations that they found are therefore mirroring a) the inadequacy of the fitted linear relations to the M - n and M - µ0 distribution (a point noted in the caption of Figure 8) and/or b) poor fitting Sérsic models to their sample of elliptical and disc galaxies. Adding uncertainties to the linear relations in section 3.1, and propagating those through to the predicted M - Re relation is required before we can claim evidence of significant deviations. However, searching for such second order effects may indeed be interesting given the different types of dwarf galaxies that are emerging (Lisker et al. 2007).
3.2.3. Size-concentration relation
One can additionally derive an expression relating Re and n by substituting the magnitude from the empirical MB - n relation, expressed in terms of n (equation 7), into the size-luminosity relation (equation 11) to give
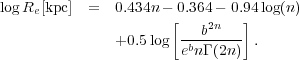 |
(12) |
While the MB - n relation is linear, the Re - n relation is curved, as can be seen in Figure 9.
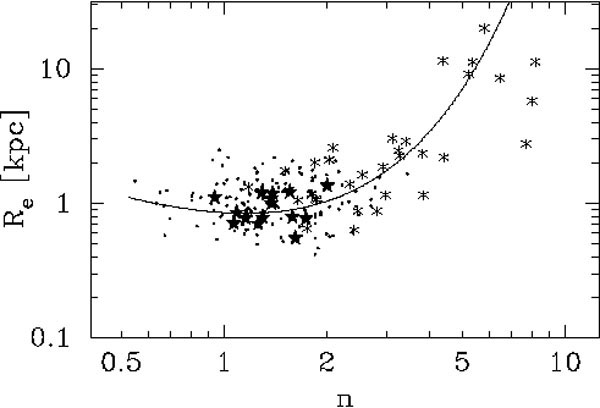 |
Figure 9. Equation 12 is over-plotted empirical data. Symbols have the same meaning as in Figure 7. |
In passing it is noted that the form of this relation (equation 12) matches the bulge data from Fisher & Drory (2010, their Figure 13). They interpret the departure of the low-n bulges (n < 2) from the approximately linear relation defined by the high-n bulges (n > 2) to indicate that a different formation process is operating to produce the less concentrated "pseudobulges". However, based upon linear unifying relations that span the artificial n = 2 divide, we know that this Re - n relation must be curved. Without an understanding of this relation, and other curved relations (e.g. Greene, Ho & Barth 2008), they have at times been misinterpretted and used to claim the existence of different physical processes (see section 4.3 for a discussion of pseudobulges: Hohl 1975 and references therein).
It may be worth better defining the behavior of the Re
- n relation at small sizes in
Figure 9. The data from
Davies et al. (1988)
suggests than when n = 0.5, values of Re may
range from 1 kpc down to 0.2 kpc
(Caon et al. 1993,
their figure 5). Such a reduction to the
flattening of the Re - n distribution, below
n 1, may in
part arise from the inclusion of dwarf spheroidal galaxies (see
Misgeld & Hilker
2011,
their figure 1).
3.2.4. Size-(effective surface brightness) relation
As discussed in Graham (2010), the first two linear relations in Figure 7 naturally explain the curved < µ >e - Re relation in Figure 10. From the empirical µ0 - n relation (equation 8, Figure 7b), one can convert µ0 into < µ >e using equations 2 and 3. The effective radius Re is acquired by matching the empirical MB - µ0 relation (equation 6, Figure 7a) with the absolute magnitude formula
 |
(13) |
(see Graham & Driver 2005, their equation 12). Eliminating the absolute magnitude gives the expression
 |
(14) |
in which we already know the value of n associated with each value of < µ >e. This is achieved by (again) using the empirical µ0 - n relation (equation 8) with equations 2 and 3, such that
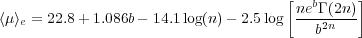 |
(15) |
and b
1.9992n - 0.3271.
Equation 14, obtained from two linear relations involving Sérsic
parameters, is a curved relation that is shown in
Figure 10.
Overplotted this predicted relation are data points from real galaxies.
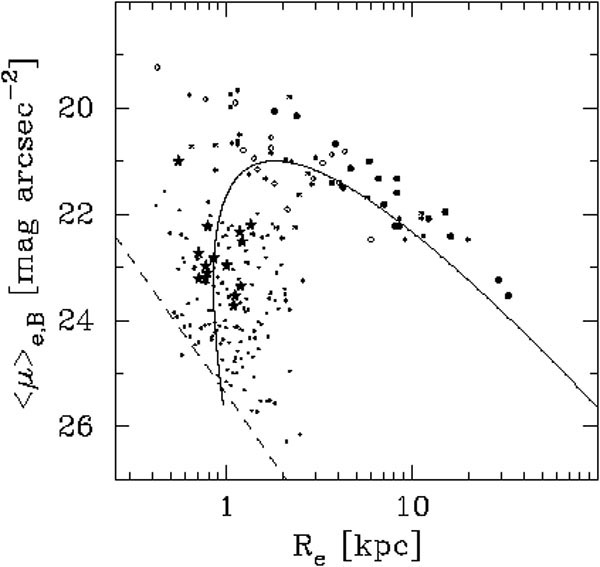 |
Figure 10. Due to the observed linear relations in Figure 7, the relation between the effective radius (Re) and the mean surface brightness within this radius (< µ >e) is highly curved for elliptical galaxies. The dashed line shows the MB = -13 mag limit for the Virgo cluster. |
For those who may have the Sérsic parameter set (Re, µe, n), one can use equation 3 to convert µe into < µ >e if one wishes to compare with the relation given by equation 14. For those who may have the parameter set (Re, µe), perhaps obtained with no recourse to the Sérsic model, equation 14 can easily be adjusted using equation 3 to give a relation between Re and µe such that
 |
(16) |
where the value of n associated with the value of µe is given by
 |
(17) |
To summarise, due to the linear relations in Figure 7 which connect dwarf and ordinary elliptical galaxies across the alleged divide at MB = -18 mag (Kormendy 1985), or at n = 2 (Kormendy & Kennicutt 2004), coupled with the smoothly varying change in light profile shape as a function of absolute magnitude, the < µ >e - Re and µe - Re relations are expected to be curved (Figure 10), as previously shown with empirical data by, for example, Capaccioli & Caon (1991. This also explains why the fitting of a linear relation to (Re, µe) data by Hoessel et al. (1987) resulted in slopes that depended on their galaxy sample magnitude.
The Kormendy relation is a tangent to the bright arm of what is actually a curved distribution defined by the relation given by equation 14 that is taken from Graham (2010). The apparent deviant nature of the dwarf elliptical galaxies from the approximately linear section of the bright-end of the < µ >e - Re distribution does not necessitate that a different physical process be operating. Moreover, as noted by Graham & Guzmán (2004) and Graham (2005), galaxies which appear to branch off at the faint end of the Fundamental Plane (Djorgovski & Davis 1987) - the flat portion at the bright end of a curved hypersurface - also need not have formed from different physical mechanisms. Simulations that assume or reproduce a linear < µ >e - Re or µe - Re relation, across too great a magnitude range, have failed to mimic the continuous curved distribution defined by real elliptical galaxies. The same remark is true for simulations of the `Fundamental Plane'.
3.3.1. Luminosity-(central surface brightness) relation
While the relation between a galaxy's absolute magnitude and
extrapolated central surface brightness is remarkably linear
(section 3.1.1), there is a clear break in this
relation when using the actual central surface brightness at the
luminous end of the distribution
(Figure 7a). This departure from the
MB - µ0
relation by elliptical galaxies brighter than MB
-20.5 mag (M >
0.5-1 × 10¹¹
M ) was
addressed by
Graham & Guzmán
(2003)
in terms of partially depleted cores relative to the outer Sérsic
profile (see also
Graham 2004;
Trujillo et al. 2004;
Merritt &
Milosavljevic 2005;
Ferrarese et al. 2006a;
Côté et
al. 2007).
This transition has nothing to do with the alleged divide between dwarf
and giant elliptical galaxies at around MB
= -18 mag, but is instead directly related with the Sérsic versus
core-Sérsic transition at around MB = -20.5 mag.
) was
addressed by
Graham & Guzmán
(2003)
in terms of partially depleted cores relative to the outer Sérsic
profile (see also
Graham 2004;
Trujillo et al. 2004;
Merritt &
Milosavljevic 2005;
Ferrarese et al. 2006a;
Côté et
al. 2007).
This transition has nothing to do with the alleged divide between dwarf
and giant elliptical galaxies at around MB
= -18 mag, but is instead directly related with the Sérsic versus
core-Sérsic transition at around MB = -20.5 mag.
As noted in section 2.2.1, such partially depleted cores in luminous core-Sérsic galaxies are thought to have formed from dry, dissipationless galaxy merger events involving the central coalescence of supermassive black holes (Begelman, Blandford, & Rees 1980; Ebisuzaki, Makino, & Okumura 1991; but see footnote 13) and resulted in Trujillo et al. (2004) advocating a "new elliptical galaxy paradigm" based on the presence of a central stellar deficit versus either none or an excess of light, an approach embraced by Ferrarese et al. (2006a), Côté et al. (2007) and others.
Further evidence for a division at MB = -20.5 mag comes from the tendency for the brighter galaxies to be anisotropic, pressure supported elliptical galaxies having boxy isophotes, while the less luminous early-type galaxies may have discy isophotes and often contain a rotating disc (e.g. Carter 1978, 1987; Davies et al. 1983; Bender et al. 1988; Peletier et al. 1990; Jaffe et al. 1994). Core galaxies also tend to be more radio loud and have a greater soft X-ray flux (e.g. Ellis & O'Sullivan 2006; Pellegrini 2010; Richings, Uttley & Körding 2011, and references therein).
It was, in part, from a diagram of central surface brightness versus magnitude that led Kormendy (1985b, his figure 3) to advocate a separation of dwarf and normal elliptical galaxies at MB = -18 mag. However, as noted by Graham & Guzmán (2003), his sample was missing the bridging population near MB = -18 ± 1 mag. Excluding galaxies of this magnitude from Figure 7a would also result in two apparently disjoint relations nearly at right angles to each other. It is therefore easy to understand how one may quickly reach the wrong conclusion from an incomplete diagram. Although, Strom & Strom (1978, their figure 8; see also Binggeli et al. 1984) had already revealed that a linear relation exists between magnitude and central surface brightness from -18.4 < MV < -21.6 mag, spanning the magnitude gap in Kormendy (1985b). Nonetheless, Faber & Lin (1983) had just observed that three of their six dwarf elliptical galaxies had near-exponential light profiles, leading them to speculate that dEs are more closely related to "exponential systems" than (tidally truncated) elliptical galaxies, and Wirth & Gallagher (1984, see also Michard 1979) had also just advocated a division between exponential-dwarf and R1/4-giant elliptical galaxies.
To further confound matters, Kormendy (1985b) had the slope wrong for the distribution of dwarf elliptical galaxies in his M - µ0 diagram, which had two consequences. First, the bright end of his dwarf elliptical galaxy distribution did not point towards the faint-end of his luminous elliptical galaxy distribution, and thus there was no suggestion of a connection. This misrepresentation is unfortunately still propagated today (e.g. Tolstoy et al. 2009, their figure 1), although Kormendy et al. (2009) have now corrected this. Second, two points representing flattened disc galaxies were added at the bright end of the mis-aligned dwarf elliptical galaxy sequence by Kormendy (1985b), implying a connection between dwarf elliptical galaxies and disc galaxies rather than ordinary elliptical galaxies.
A decade later, the Astronomy and Astrophysics Review paper by
Ferguson & Binggeli
(1994;
their Figure 3) had a big question mark as to "how" and
indeed "if" dwarf and ordinary elliptical galaxies might connect in this
diagram. When galaxies spanning the gap in
Kormendy's (1985b)
analysis were included by
Faber et al. (1997,
their figure 4c), and shown to follow a trend consistent with the
relation from
Strom & Strom (1978)
and
Binggeli et al. (1984),
in which the central surface brightness became fainter with decreasing
galaxy luminosity
Faber et al. (1997)
suggested that this behavior in their data
was spurious and due to limited resolution -
such was the belief in a discontinuity separating dwarf and ordinary
elliptical galaxies. At the same time,
Jerjen & Binggeli
(1997)
argued exactly the opposite, suggesting that it was instead the "core"
galaxies which had been displaced in the
M - µ0 diagram from a linear M -
µ0 relation. rather than wrong
central surface brightness measurements for the faint (non-dwarf)
elliptical galaxies. As
Graham & Guzmán
(2003)
and
Graham (2004)
later explained,
in terms of a ~ 0.1 percent central mass deficit relative to the outer
Sérsic profile in galaxies brighter than MB
-20.5 mag,
Jerjen & Binggeli
(1997)
were right, supporting the views expressed by
Binggeli et al. (1984)
on a continuity between dwarf elliptical
and ordinary elliptical galaxies across the alleged divide at
MB
-18 mag.
3.3.2. Luminosity-colour relation
Additional support for the dry merging scenario at the high-mass end is
the flattening of the colour-magnitude relation above 0.5-1 ×
1011
M.
While low luminosity, low Sérsic index, elliptical galaxies are
bluer than bright elliptical galaxies (e.g.
de Vaucouleurs 1961;
Webb 1964;
Sandage 1972;
Caldwell & Bothun
1987),
the brightest galaxies have the same colour as each other.
This flattening in the colour-magnitude relation was noted by
Tremonti et al. (2004)
and is evident in
Baldry et al. (2004,
their Figure 9),
Ferrarese et al. (2006a,
their Figure 123),
Boselli et al. (2008,
their Figure 7) and even
Metcalfe, Godwin &
Peach (1994).
These observations help alleviate past tension with semi-analytic models
that had predicted a relatively flat colour-magnitude relation for bright
elliptical galaxies (e.g.
Cole et al. 2000).
Previously, based on what was thought to be a linear colour-magnitude
relation,
Bernardi et al. (2007)
had written
that "if BCGs formed from dry mergers, then BCG progenitors must have been
red for their magnitudes, suggesting that they hosted older stellar
populations than is typical for their luminosities". However, the
flattening in the colour-magnitude relation
has since been recognised in yet more data sets (e.g.
Skelton, Bell & Somerville 2009;
Jiménez et
al. 2011)
although it should perhaps be noted
that Skelton et al. reported the transition at MR =
-21 mag, i.e. ~ 1 mag fainter.
In passing it is noted that the relation between luminosity and supermassive
black hole mass
(Marconi & Hunt 2003;
McLure & Dunlop 2004)
was found to be, after several refinements by
Graham (2007),
a linear one-to-one relation for black hole masses predominantly greater
than 108
M -
consistent with the concept of dry galaxy merging at this high-mass end.
From a sample of 13 early-type galaxies, plus one spiral galaxy,
Minkowski (1962)
noted that a "correlation between velocity dispersion and [luminosity]
exists, but it is poor". He wrote that "it seems important to extend the
observations to more objects, especially at low and medium absolute
magnitudes". This was done by
Morton & Chevalier
(1973)
who noted the same
"continuous distribution of dispersions from 60 km/s for M32 to 490 km/s
for M87" but also did not attempt to quantify this
trend. It was
Faber & Jackson
(1976)
who, with improved data and a larger sample of 25 galaxies, were
the first to quantify Minkowski's relation and discovered that
L 
 4 for their
data set. This result has proved extremely
popular and is known as the Faber-Jackson relation. Not long after this,
Schechter (1980)
and
Malumuth & Kirshner
(1981)
revealed that the luminous elliptical galaxies followed a relation with an
exponent of ~ 5 rather than 4. At the same time,
Tonry (1981)
revealed that expanding the sample to include more faint elliptical
galaxies results in an exponent of ~ 3. This led
Binney (1982)
to write that "probably the correlation cannot be adequately fitted by a
single power law over the full range of absolute magnitudes" and
Farouki et al. (1983)
wrote that "the data suggests the presence of curvature in the
L - relation".
Davies et al. (1983),
and later
Held et al. (1992),
revealed that the dwarf
elliptical galaxies followed a relation with an exponent of ~ 2, which
explains why
Tonry (1981)
had found a slope of ~ 3 when including dwarf and
ordinary elliptical galaxies. The relation found by Davies et al., with
a slope of ~ 2, has recently been observed by
de Rijcke et al. (2005)
and the curved or possibly
broken L -
distribution has been interpreted by
Matkovic &
Guzmán (2005)
as a change in slope at -20.5 B-mag (see also
Evstigneeva et al. 2007)
in agreement with
Davies et al. (1983.
4 for their
data set. This result has proved extremely
popular and is known as the Faber-Jackson relation. Not long after this,
Schechter (1980)
and
Malumuth & Kirshner
(1981)
revealed that the luminous elliptical galaxies followed a relation with an
exponent of ~ 5 rather than 4. At the same time,
Tonry (1981)
revealed that expanding the sample to include more faint elliptical
galaxies results in an exponent of ~ 3. This led
Binney (1982)
to write that "probably the correlation cannot be adequately fitted by a
single power law over the full range of absolute magnitudes" and
Farouki et al. (1983)
wrote that "the data suggests the presence of curvature in the
L - relation".
Davies et al. (1983),
and later
Held et al. (1992),
revealed that the dwarf
elliptical galaxies followed a relation with an exponent of ~ 2, which
explains why
Tonry (1981)
had found a slope of ~ 3 when including dwarf and
ordinary elliptical galaxies. The relation found by Davies et al., with
a slope of ~ 2, has recently been observed by
de Rijcke et al. (2005)
and the curved or possibly
broken L -
distribution has been interpreted by
Matkovic &
Guzmán (2005)
as a change in slope at -20.5 B-mag (see also
Evstigneeva et al. 2007)
in agreement with
Davies et al. (1983.
In spite of all the above work, there is a huge body of literature today
which appears unaware that the
L - relation is
curved or broken.
Simulations of galaxies which succeed in producing the linear Faber-Jackson
relation, L
4, have
actually failed to produce the full
distribution of dynamics seen in real elliptical galaxies as a function
of magnitude.
16 Here the "central density" refers to the density prior to core depletion in giant elliptical galaxies or the growth of additional nuclear components in smaller elliptical galaxies. Back.
17 To convert from the surface density to the internal density, one can use equation 4 from Terzic & Graham (2005). Back.
18 Graham et al. (2001) contains a review of various concentration indices used over the decades, while Trujillo et al. (2001) was the first to quantify the monotonic relation between Sérsic index and concentration. Back.
19 A simple one-dimensional example of sample bias would be a survey of the average physical properties, such as size or mass, of people at a primary school. One would measure the properties of children and adults, but miss the bridging population which reveals a continuity and thus unification of the species. Back.