Copyright © 2013 by Annual Reviews. All rights reserved
| Annu. Rev. Astron. Astrophys. 2013. 51:393-455
Copyright © 2013 by Annual Reviews. All rights reserved |


5.1. The Age-Metallicity Degeneracy
The metallicity, Z, affects the SED in two distinct ways: (1) an increase in metallicity results in lower effective temperatures, including a cooler main sequence and giant branch; (2) at fixed Teff, an increase in metallicity results in stronger spectroscopic absorption features and generally redder colors. Both of these effects contribute to the overall reddening of an SED with increasing metallicity. In addition to the overall metal content, the detailed elemental abundance pattern is imprinted on the SED, especially in the strength of spectral absorption features.
Age will also tend to redden the SED through the effect of age on the isochrones. Worthey (1994) studied the degeneracy between age and metallicity in detail using his SPS models and concluded that at ages > 5 Gyr neither broadband colors nor most spectral indices were able to reliably separate age from metallicity. Worthey introduced his "3/2 rule", whereby an increase/decrease in the population age by a factor of three is almost perfectly degenerate with an increase/decrease in metallicity by a factor of two. He identified a small number of spectral indices that were unusually sensitive to age, including the hydrogen Balmer lines, and several indices that were unusually sensitive to metallicity, including the Fe4668 and Fe5270 indices (see also O'Connell 1980, Rabin 1982, Rose 1985 for early attempts at separating age and metallicity). Worthey therefore demonstrated conclusively that the age-metallicity degeneracy could be broken by jointly considering a handful of carefully chosen indices. He also pointed out that the age-metallicity degeneracy is less severe at low metallicity, where the turnoff point and giant branch have very different age sensitivity at fixed metallicity.
It has long been appreciated that a clean separation of age and metallicity can be achieved with Lick indices only for data of very high S/N (≳ 100/Å; Trager et al. 2000b, Kuntschner 2000). Figure 11 demonstrates that an age-metallicity degeneracy persists when exploiting Lick indices at lower S/N. In contrast, full spectral fitting offers a much more robust separation of age and metallicity at moderate to low S/N (at least within the context of an underlying set of model SSPs; see MacArthur, González & Courteau 2009, Sánchez-Blázquez et al. 2011). This is simply a consequence of the fact that much more information is available in the full optical spectrum than can be captured by a limited number of spectral indices.
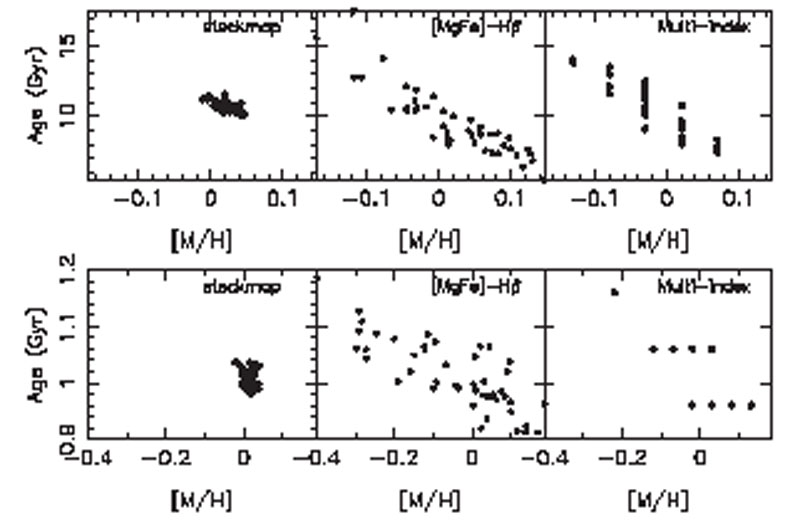 |
Figure 11. Illustration of the age-metallicity degeneracy in spectra of modest S/N. Three techniques are compared, the full spectrum fitting technique of (left panel) Ocvirk et al. (2006), classic two-index fitting (middle panel), and multi-index fitting (right panel). Results are shown for a mock galaxy with S/N = 50/Å, [M/H] = 0.0, and an age of 10 Gyr (top panels) and 1 Gyr (bottom panels). Each point represents the best-fit for a single realization of the mock galaxy spectrum. From Sánchez-Blázquez et al. (2011). |
5.2. Photometric Metallicities
The age-metallicity degeneracy discussed in Worthey (1994) strictly applies to systems that are coeval with ages > 5 Gyr; models at younger ages were not considered by Worthey. In subsequent work it became clear that the broadband optical-NIR colors of composite stellar populations could separate age and metallicity effects. The physics underlying the idea is that blue colors probe the age-sensitive main sequence turnoff point while red/NIR colors probe the metallicity-sensitive giant branches. Bell & de Jong (2000) and MacArthur et al. (2004), amongst others, showed that age and metallicity vectors were nearly orthogonal in optical-NIR colors (e.g., B - R vs. R - H). These authors therefore concluded that estimates of stellar metallicities were possible from photometric data alone, for systems whose light-weighted ages were not too old. Eminian et al. (2008) showed that galaxies grouped by spectroscopically-derived ages and metallicities separate relatively well in g - r vs. Y - K color-color space. Notice that this statement does not depend on the predicted model colors, thereby providing strong evidence that separation of age and metallicity is at least in principle possible based on broadband optical-NIR data alone.
Lee et al. (2007) investigated the model uncertainties associated with separating age and metallicity based on broadband colors. They echoed previous work in that the young populations in composite stellar models dominate the light and therefore allow a separation of age and metallicity effects when optical-NIR colors are employed. However, they also emphasized that different SPS models produce very different age-metallicity vectors in color-color space, a point also emphasized by Eminian et al. (2008). The result is that age and metallicity can be separately constrained within the context of a particular SPS model, but the derived ages and metallicities will vary from model to model. The underlying cause of this problem is that the NIR light is heavily influenced by AGB stars for populations of moderage age, and so different treatments of this uncertain evolutionary phase cause substantial differences in the age-metallicity grids. Because of the difficulty in measuring metallicities from photometric data, many SPS studies simply treat metallicity as a nuisance parameter to be marginalized over. Other studies take the even simpler approach of fixing the metallicity to the solar value. The danger in making the latter simplification is that assumptions in the assumed metallicity will generally affect other parameters of interest, such as the stellar mass, dust opacity, and star formation rate (see e.g., Wuyts et al. 2009, Marchesini et al. 2009, Muzzin et al. 2009, Pforr, Maraston & Tonini 2012).
5.3. Spectroscopic Metallicities
The more robust approach to estimating stellar metallicities is to employ spectroscopic features. Optical spectra of galaxies are rich in atomic and molecular absorption features that are readily apparent even at low spectral resolution (R ~ 1000). For a fixed population age, the strengths of the absorption features will depend not only on the overall metallicity, Z, but also on the detailed elemental abundance pattern. In general, this greatly complicates interpretation of absorption features and spectral indices. However, with the aide of models that allow for variation in both metallicity and abundance pattern, one can search for combinations of features that are relatively robust against abundance pattern variations. Thomas, Maraston & Bender (2003b) refined a proposal by González (1993) of an index comprised of magnesium and iron lines that is almost entirely insensitive to the level of α enhancement, [α/Fe], and is therefore a relatively robust tracer of Z. The index is defined as [MgFe]' ≡ √Mgb (0.72 Fe5270+0.28 Fe5335), where Mgb, Fe5270, and Fe5335 are Lick indices defined in Worthey et al. (1994). The power of this index, and others like it (see e.g., Bruzual & Charlot 2003), is that variable abundance pattern models are then not required to measure total metallicities from galaxy spectra. However, a significant caveat to this approach is the assumption that abundance patterns in galaxies can be described by two parameters: [Fe/H], and [α/Fe]. In reality, analyses of high resolution stellar spectra in the Galaxy consistently demonstrate that the α elements do not vary in lock-step (Edvardsson et al. 1993, Venn et al. 2004, Fulbright, McWilliam & Rich 2007). This means that the true total metallicity, Z, can only be accurately estimated if the detailed abundance patterns are known.
Gallazzi et al. (2005) applied the idea that [MgFe]' is insensitive to [α / Fe] (assuming that the α elements, C and N all vary in lock-step) to the analysis of 175,000 galaxies from the SDSS with the aide of the Bruzual & Charlot (2003) SPS models. Several age-sensitive and Z-sensitive spectral indices were used in their analysis. They derived light-weighted stellar metallicities for individual galaxies with statistical errors as low as 0.1 dex for the highest S/N spectra. These authors also explored a variety of systematic effects and concluded that these could add ~ 0.1 dex systematic uncertainty to the error budget on Z. Probably the dominant systematic in the results of Gallazzi et al., and others based on similar techniques, is the assumption that the α elements and C and N all vary in lock-step.
Another technique is to fit the entire optical spectrum with models that allow for variation in age and total metallicity, and to simply ignore the possibility that the observed spectrum may have non-solar abundance patterns. This approach has become increasingly common as automated spectral fitting codes garner wider use. Tojeiro et al. (2011) fit stacked spectra of luminous red galaxies from SDSS as a function of luminosity and redshift with the VESPA code. Remarkably, they found essentially no variation in Z with galaxy luminosity (though the sample was restricted to very luminous galaxies), and for the Conroy, Gunn & White (2009) and Maraston (2005) SPS models there was no evolution in Z with redshift over the interval 0.1 < z < 0.5. When the Bruzual & Charlot (2003) models are employed, VESPA favored higher metallicities at higher redshift. Variation in the best-fit metallicity between SPS models points toward systematic uncertainties in the models at the ~ 0.2 dex level.
Koleva et al. (2008) investigated the accuracy of full spectrum fitting codes at recovering metallicities. They considered both the ability of one SPS model to recover the known metallicity of a second model and the ability of an SPS model to recover the known metallicities of Galactic globular clusters. They concluded that the high-resolution version of the Bruzual & Charlot (2003) model carries large systematic uncertainties due to its use of the STELIB stellar library. STELIB does not sample a wide enough range in metallicity, and so metallicities derived from the Bruzual & Charlot models will carry large uncertainties. The other models tested, including the Vazdekis/MILES and Pegase-HR models, reproduced the known globular cluster metallicities to an accuracy of ≈ 0.14 dex.
Of course, the most robust method for estimating stellar metallicities is with models that self-consistently include abundance pattern variation. Such models have existed for the Lick indices since the late 1990s while models for the full optical-NIR spectrum have only recently become available (Coelho et al. 2007, Walcher et al. 2009, Conroy & van Dokkum 2012a).
Trager et al. (2000b, 2000a) modeled three spectral indices with SPS models that allowed for variation in abundance patterns. Trager and colleagues focused on fitting for the age, total metallicity, Z, and enhancement ratio, [α/Fe]. In practice, they grouped elements into two types, the `depressed' and the `enhanced' group, with the latter comprised of α elements except Ca, plus C and N, while the former comprised the iron-peak elements and Ca. In subsequent work, (Thomas et al. 2005) modeled the same set of spectral indices as in Trager et al., though with their own SPS models and with an expanded dataset. Their conclusions largely echoed those of Trager and collaborators, with the novel finding that at fixed velocity dispersion galaxies in denser environments appeared to be more metal-rich than galaxies in less dense environments.
As discussed in Section 4, most analyses of Lick indices fit single-age models to the data. Serra & Trager (2007) and Trager & Somerville (2009) considered the effect of multiple age components in the fitting of the Lick indices of mock galaxies and found that the derived metallicities agreed well with the light-weighted mean metallicities when the youngest component was older than ~ 3 Gyr. For young components with ages 1-3 Gyr there was a slight bias in the sense that the derived metallicities were ~ 0.1 dex higher than the true light-weighted mean metallicities. These authors did not consider young components younger than 1 Gyr.
The estimation of total metallicity with models that include abundance pattern variation are the most robust but also the most restricted. Models such as those by Thomas et al., Conroy & van Dokkum, Worthey, or Schiavon are limited to ages > 1 Gyr, and therefore are routinely applied only to early-type galaxies. A major area for future growth in this field is the extension of these models to younger ages in order to model galaxies of all types.
Wallerstein (1962) was the first to show that non-solar abundance patterns were common amongst metal-poor stars in the Galaxy. It was therefore natural to wonder if other galaxies harbored non-solar abundance patterns. Early data suggested that magnesium may vary more than iron amongst the early-type galaxies (O'Connell 1976, Peterson 1976, Peletier 1989), but it was with the availability of new, relatively high-quality spectral synthesis models that Worthey, Faber & Gonzalez (1992) were able to firmly establish that the [Mg/Fe] ratio varied within the early-type galaxy population. The discovery of non-solar abundance patterns has been one of the most significant discoveries afforded by population synthesis models. The ratio between the abundance of α-elements and iron-peak elements, [α/Fe], is considered to be particularly valuable, as it provides insight into the SFH of galaxies (Tinsley 1979). Following the development of models that allowed for arbitrary variation in abundance patterns, the measurement of abundance ratios became routine. Particular attention has been paid to [Mg/Fe], in large part because it is the most readily measurable abundance ratio in moderate resolution spectra, thanks to the numerous strong Fe i features and the Mgb feature at 5200 Å (see Figure 3).
As discussed above, Trager et al. (2000b, 2000a) presented the first systematic investigation of abundance patterns in early-type galaxies. They found enhancement ratios, [α/Fe] generally in excess of zero, with a strong correlation with velocity dispersion. As Trager and collaborators only fit Hβ, Mgb, and two iron indices, their [α/Fe] is in reality a statement about [Mg/Fe]. Since then, numerous authors, using different SPS models, have all reached the same conclusion that [Mg/Fe] exceeds zero and increases with galaxy velocity dispersion (Thomas et al. 2005, Schiavon 2007, Smith et al. 2009, Graves, Faber & Schiavon 2009, Johansson, Thomas & Maraston 2012).
As noted in the previous section, early studies grouped elements into two classes, `enhanced' and `depressed', and so only the total metallicity and the enhancement factor could be measured from the data (Trager et al. 2000a, Thomas et al. 2005). More recent work has allowed for the abundance of a larger number of elements to vary, including C, N, Ca, and Ti (see Schiavon 2010 for a complementary review to the one presented below).
The calcium abundance is most commonly measured from the Ca i line at 4227 Å, as probed by the Ca4227 Lick index (see Figure 3). Other regions of the spectrum with strong sensitivity to calcium abundance include the Ca ii H&K lines and the triplet of Ca ii lines at 8600 Å (CaT). The calcium abundance in early-type galaxies has been described as a `puzzle' because its abundance does not seem to track magnesium, despite the fact that they are both α elements. This was noted qualitatively in the early work of Vazdekis et al. (1997) and Trager et al. (1998) and quantified with variable abundance models by Thomas, Maraston & Bender (2003a). The CaT feature is weaker than even solar-scaled models, for reasons that will be discussed in Section 7. Schiavon (2007) and Johansson, Thomas & Maraston (2012) fit the Ca4227 index (along with others) of early-type galaxies from SDSS and find [Ca/Fe] values close to zero.
Carbon and nitrogen abundances can be measured from the NH, CH, C2, and CN molecular absorption features in the blue spectral region (see Figure 3). Kelson et al. (2006) were the first to probe the carbon and nitrogen content of early-type galaxies based on Lick indices. Schiavon (2007) measured [C/Fe] and [N/Fe] from Lick indices as a function of early-type galaxy luminosity based on stacked spectra from SDSS. He found that the abundance of these elements increased significantly with increasing luminosity. Johansson, Thomas & Maraston (2012) reached similar conclusions based on analysis of individual early-type galaxies in SDSS. The NH feature at ≈3360 Å is in principle a powerful probe of [N/Fe] because it is sensitive only to N (unlike CN). To date this feature has not been extensively utilized, both because it is near the atmospheric transmission cutoff and thus difficult to observe and because variable abundance models are not well-developed in this spectral region. Nonetheless, several authors have investigated empirical trends of this feature with other properties of early-type galaxies, with mixed results (Davidge & Clark 1994, Ponder et al. 1998, Serven et al. 2011).
Moderate resolution spectra of early-type galaxies respond strongly to changes in the abundances of Fe, Mg, C, N, Ca, and Ti, and thus these elements are the most easily measured. However, the optical and NIR spectrum of an old stellar population contains information on many more elements. In a forward-looking study, Serven, Worthey & Briley (2005) considered the spectral response due to variation in the abundance of 23 separate elements and concluded that for S/N = 100 spectra and a galaxy velocity dispersion of σ = 200 km s-1, one could in principle measure the abundance of C, N, O, Na, Mg, Al, Si, Ca, Sc, Ti, V, Cr, Mn, Fe, Co, Ni, Sr, and Ba. Of course, as the effects are often quite subtle, all relevant systematics must be well-controlled. As a first step toward extracting these more subtle features, Conroy, van Dokkum & Graves (2013) reported measurements of the abundances of the neutron-capture elements Sr and Ba from analysis of moderate-resolution spectra of nearby early-type galaxies. Studies such as these should provide important new clues to the formation histories of old stellar systems.
Attention here has focused exclusively on early-type galaxies with little or no ongoing star formation, and for good reason. The hot massive stars that dominate the SEDs of actively star-forming galaxies have generally weak metal absorption lines, especially in the optical-NIR, and so their presence acts primarily to dilute the strength of the metal lines of the older, cooler stars. More fundamentally, models simply do not currently exist to study the abundance patterns of actively star-forming galaxies.
5.4.1. What About Oxygen? Oxygen is the most abundant element in the universe after hydrogen and helium. Its abundance relative to iron, [O/Fe], is therefore a critical variable in both stellar interior models (VandenBerg & Bell 2001) and stellar atmospheres. There are no transitions of atomic oxygen visible in moderate resolution spectra, but molecules involving oxygen (including TiO, H2O, CO, and OH) do create significant features in the optical-NIR spectra of cool stars. TiO is the only molecule with transitions in the optical (beginning at ≈ 4500 Å ), and unfortunately the work on response functions of the Lick indices to abundance changes have neglected TiO line lists from their computations (Tripicco & Bell 1995, Korn, Maraston & Thomas 2005). The situation with oxygen is quite complex because CO has the highest dissociation potential of any molecule, and thus increasing the abundance of oxygen has a cascading effect on other species. For example, increasing oxygen causes more carbon to be consumed by the formation of CO, which in turn causes a decrease in the concentration of CN and C2. The oxygen abundance must therefore be known, or assumed, before one can interpret other spectral features. The OH lines in the H-band probably afford the most direct constraint on the oxygen abundance, but these features have not been exploited because of a lack of available models. This limitation has now been overcome with the variable abundance ratio models of Conroy & van Dokkum (2012a) that extend to the K-band. The upshot is that direct constraints on the photospheric abundance of oxygen in other galaxies currently do not exist, but they are possible with newly available models. This presents a significant limitation to current models because of the strong effect of oxygen on the effective temperatures, etc., of stars. More troubling is the observation that in the Galactic bulge the abundances of oxygen and magnesium do not track each other (Fulbright, McWilliam & Rich 2007). In fact, bulge stars with [Fe/H] > 0, have [O/Fe] < 0.2, [Si/Fe] < 0.2, [Ca/Fe] < 0.2, and [Ti/Fe] < 0.2, while [Mg/Fe] ~ 0.3 for the same stars. The lesson to draw from the Galactic bulge is that one should be very cautious in using [Mg/Fe] as a tracer of [α/Fe]. Because of these uncertainties surrounding oxygen, Thomas et al. (2005) investigated its effect on their analysis of Lick indices. They concluded that if oxygen is in reality decoupled from the other α-elements (e.g., [O/Mg] is non-zero) then the ages, [Fe/H], and [Mg/Fe] abundances are largely unchanged with respect to their standard model where oxygen tracks the other α-elements. However, these authors only considered the effect of oxygen on the stellar spectra; they did not consider the non-trivial effect of oxygen on the isochrones (Dotter et al. 2007). Further work is clearly needed regarding the important role of oxygen in SPS models.
5.4.2. Z vs. [Fe/H] The iron abundance, [Fe/H], is often regarded as a proxy for the total metallicity, Z, but, as discussed above, the correspondence between these two quantities breaks down for non-solar abundance patterns. As shown in Trager et al. (2000b), the relation between [Z/H] and [Fe/H] can be parameterized by [Z/H] = [Fe/H] + A[α/Fe]. The constant A depends on the detailed abundance pattern; for models in which all α elements and C and N are grouped together, A = 0.93, while for models with [O/Fe] = [C/Fe] = 0, A = 0.77. It needs to be emphasized here that formulae such as the one presented above only apply in the simple case in which all α elements vary in lock-step and C and N either are solar-scaled or vary with α. This is probably not a good approximation to reality. From the modeling perspective, some have chosen to enhance or depress element groups at fixed Z (e.g., Trager et al. 2000b, Thomas, Maraston & Bender 2003b), while others have chosen to fix [Fe/H] as other elements vary (e.g., Schiavon 2007, Conroy & van Dokkum 2012a). The choice would be rather arbitrary and inconsequential were it not for the fact that most models adopt a fixed set of isochrones as the abundances are varied. The important question is then whether isochrones vary more at fixed Z or fixed [Fe/H]. At least for variation in [O/Fe], Dotter et al. (2007) have demonstrated that the isochrones vary in Teff by approximately the same absolute amount (though with a different sign) when the variation is computed at fixed Z or fixed [Fe/H]. The disadvantage, at least conceptually, of computing models at fixed Z is that a variation in one element forces variation in another so that Z is held constant.
Stars within the Galaxy have a wide range of metallicities, and so one might expect other massive galaxies to harbor stars of varying metallicity. This expectation was confirmed with resolved color magnitude diagrams of nearby early-type galaxies (e.g., Grillmair et al. 1996, Harris & Harris 2000, Monachesi et al. 2011). The difference between a monometallic metal-rich stellar population and one that includes even a small fraction of metal-poor stars will be most apparent in the UV. This occurs for two reasons: at low metallicity the main sequence turn-off point is considerably hotter than at solar metallicity, and at low metallicity stellar populations are observed to contain significant numbers of blue HB stars. The closed box model of galactic chemical evolution predicts that ≈ 10% of the stars in an evolved galaxy will have [Fe/H] < -1. Old stellar populations with [Fe/H] ≲ -1 can be expected to harbor blue HB stars (by analogy with the Galactic globular clusters), and thus there will be a large difference in the UV between a closed box metallicity distribution function and one that is monometallic.
Bressan, Chiosi & Fagotto (1994) constructed spectrophotometric evolutionary models for elliptical galaxies and found that closed box models produced an excess of UV flux compared to observations. They argued that the failure of the model was due to the excess of metal-poor stars and concluded that real early-type galaxies contain a more narrowly peaked metallicity distribution function. This conclusion mirrors the observation in the solar neighborhood, where fewer low-metallicity stars are observed than predicted by the closed box model (this is known as the `G-dwarf problem'; Tinsley 1980). Worthey, Dorman & Jones (1996) arrived at a similar conclusion from analysis of a UV-optical spectrum of M31 and spectral indices for a sample of early-type and S0 galaxies. These authors argued for a metal-poor component a factor of 2-3 lower than predicted by the closed box model. From the analysis of Lick indices of a sample of early-type galaxies, Greggio (1997) also concluded that a closed box model for the metallicity distribution failed to reproduce the data.
While it is reasonably clear that early-type galaxies contain fewer low-metallicity stars than predicted by the closed box model, the more general task of measuring the detailed metallicity distribution function, or even the fraction of low-metallicity stars from integrated light measurements is much more complex. As discussed in Section 4.5, the UV spectral region is sensitive to minority populations of hot stars of many types, including metal-poor main sequence stars, young stars, and exotic and uncertain evolutionary phases such as blue stragglers, extreme HB stars, and post-AGB stars. The latter two are very hot, and so are more influential at λ < 2000 Å , where the UV upturn phenomenon in early-type galaxies exists. From consideration of the mid-UV (2000 Å < λ < 4000 Å ) spectra of M31 and other nearby galaxies, Worthey, Dorman & Jones (1996) argued for metal-poor fractions ≤ 5%. Maraston & Thomas (2000) modeled the mid-UV spectra of four nearby galaxies and found metal-poor fractions ≤ 6%, and Lotz, Ferguson & Bohlin (2000) argued in favor of small, but non-zero fractions of metal-poor stars. Maraston & Thomas (2000) also highlight the point, first raised by Greggio (1997), that known metallicity gradients within galaxies, when combined with projection effects, will `contaminate' nuclear spectra of galaxies with metal-poor stars. It is notable that Maraston & Thomas (2000) find evidence for a spread in metal-poor fractions, ranging from 0-6%. This suggests that one should include the metal-poor fraction as an additional free parameter when fitting the mid-UV of early-type galaxies. Care must be taken when interpreting these fractions because the definition of `metal-poor' varies, although it generally refers to metallicities at least as low as [Fe/H] ≲ -1.5. The problem boils down to the fact that the hot star fraction can be measured from UV (and perhaps blue spectral) data, but it is very challenging to convert this hot star population into a fraction of metal-poor stars owing to uncertainties in advanced phases of stellar evolution.
For actively star-forming galaxies essentially nothing is known regarding their internal distribution of metallicities, as the young stars overwhelm the subtle UV features signaling the presence or absence of low-metallicity stars.
The technique of measuring metallicities and abundance patterns from old stellar systems is well-established. The age-metallicity degeneracy can be robustly broken by considering the hydrogen Balmer lines in conjunction with iron features in moderate resolution optical spectra. Abundance ratios including [Mg/Fe], [C/Fe], [N/Fe], and [Ca/Fe] are now routinely measured from optical spectra. Other elements including O, Na, Si, Sc, Ti, V, Cr, Mn, Co, Ni, Sr, and Ba should also be measurable from high S/N optical-NIR spectra of old stellar systems, and models are currently being developed to extract this information. It is possible to measure metallicities based on photometric data, but the derived values depend on the underlying SPS model and on various assumptions like the form of the SFH. Photometric metallicities are therefore probably accurate only in a relative sense. Spectroscopic metallicities seem to be accurate at the ~ 0.2 dex level, with model systematics again being the dominant source of error. There is clearly information on the distribution of stellar metallicities within galaxies, and previous work suggests that it is possible to measure at least the low metallicity tail of the distribution. Further modeling is required to understand precisely how much information on the metallicity distribution function is available in the SEDs of quiescent galaxies.