


Most methods to constrain or measure the masses of galaxies are limited to relatively small radii, where baryons are dominant. This is, because these methods probe the gravitational potential through the dynamics of visible tracers. Although it is safe to assume that galaxies are virialized, uncertainties in the mass estimates remain, for instance due to anisotropies in the velocity distributions. Furthermore, these baryon dominated regions are not yet fully understood, which complicates a direct comparison of the models of galaxy formation to observational data. We note, however, that predictions from cosmological numerical simulations keep improving. Nonetheless, it would be advantageous to have observational constraints that can be robustly measured from numerical simulations. The virial mass of the galaxy is an obvious choice, but it is difficult to measure using dynamical methods. To date, only satellite galaxies have provided some information using data from large redshift surveys such as the SDSS (e.g. McKay et al. 2002; Prada et al. 2003).
In this section we focus on a direct probe of the matter distribution in the universe, which provides us with a unique opportunity to probe the outer regions of galaxies. It makes use of the fact that inhomogeneities in the matter distribution, such as the halos around galaxies, perturb the paths of photons emitted by distant sources: it is as if we are viewing these sources with a spatially varying index of refraction. As a result, the images of the distant galaxies typically appear slightly distorted (and magnified), an effect that is known as weak gravitational lensing. The amplitude of the distortion provides us with a direct measurement of the gravitational tidal field, which in turn can be used to "image" the distribution of dark matter directly (e.g. Kaiser & Squires 1993). If the distortion is large enough, multiple images of the source can be observed. This strong lensing provides accurate constraints on the mass distribution on small scales and its applications are discussed in Section 7.
The applications of weak lensing are not limited to galaxy-galaxy lensing, which is the study of the properties of galaxy dark matter halos. In fact the first detections were made by searching for the lensing-induced alignments of galaxies behind massive clusters of galaxies where the lensing signal is larger (Tyson et al. 1990; Fahlman et al. 1994). In recent years the focus has shifted to the measurement of the statistical properties of the large-scale structure: this cosmic shear is a promising probe of dark energy and has been detected with high significance (Fu et al. 2008). This application is driving much of the developments in improving measurement techniques, but also in terms of survey requirements. Consequently, galaxy-galaxy lensing studies benefit as well, because the data requirements are rather similar: we need to survey large areas of the sky, preferably in multiple bands in order to derive photometric redshifts. Such data sets are becoming available, and significant progress is expected in the coming years as the analyses of the first multi-color cosmic shear surveys are completed.
The first attempt to measure the weak lensing signal around galaxies 20 was made by Tyson et al. (1984) using data from photographic plates with fairly poor image quality. As discussed in more detail below, the determination of the lensing signal requires careful measurements of the shapes of faint galaxies which benefit greatly from good image quality. Consequently, the first detection was reported over a decade later by Brainerd et al. (1996) using deep ground-based CCD images. Soon after Hudson et al. (1998) exploited the combination of deep HST imaging and photometric redshifts in the Northern Hubble Deep Field.
An accurate determination of the galaxy-galaxy lensing does not only require good image quality. As explained below, the signal around an individual galaxy is too low to be detected. Instead we stack the signals for a large ensemble of lenses to improve the signal-to-noise ratio of the measurement. The early studies were all based on small survey areas, thus yielding small numbers of lens-source pairs. This changed with the start of the Sloan Digital Sky Survey (SDSS): Fischer et al. (2000) used only 225 deg2 of commissioning data and detected a significant galaxy-galaxy lensing signal out to 1 Mpc. The SDSS data are relatively shallow, but the large survey area provides the large number of lens-source pairs to measure the lensing signal with high accuracy. Another important feature of the SDSS is the availability of redshifts for the lenses (spectroscopic as well as photometric), which has been used by McKay et al. (2001), Guzik & Seljak (2002) and Mandelbaum et al. (2006b).
In the case of deep observations the reduction in the number of lenses (due to smaller survey area) is compensated by the increase in the number of sources, which are also more distant. Hence, even by imaging tens of square degrees the galaxy-galaxy lensing signal can be measured accurately (Hoekstra et al. 2004; Parker et al. 2007). Such surveys typically lack spectroscopic redshift information for the lenses and use photometric redshifts instead (but see van Uitert et al. 2011, for an example that combines SDSS spectroscopy with deeper imaging).
Below we provide a brief introduction to weak galaxy-galaxy lensing and present a number of highlights, demonstrating the potential of this technique. However, it is important to stress that this is a field that is still developing, and many exciting results are expected from the next generations of surveys.
Due to space limitations, we can only provide the most basic discussion of weak gravitational lensing. We refer the interested reader to a recent review by Hoekstra & Jain (2008) or the thorough introductions by Bartelmann & Schneider (2001) or Schneider (2006b).
Inhomogeneities along the line-of-sight deflect photons originating from distant galaxies. As these sources are typically small, the resulting effect is a remapping of fs, the surface brightness distribution of the source:
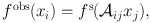 |
(42) |
where x is the position on the sky and
 is
the distortion matrix (i.e., the Jacobian of the transformation),
which is specified by the projected surface density of the lens
and the redshifts of the lens and the source.
It is convenient to introduce the deflection potential Ψ
is
the distortion matrix (i.e., the Jacobian of the transformation),
which is specified by the projected surface density of the lens
and the redshifts of the lens and the source.
It is convenient to introduce the deflection potential Ψ
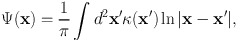 |
(43) |
where the convergence κ is the ratio of the projected surface density Σ(x) and the critical surface density Σcrit:
 |
(44) |
with Σcrit defined as
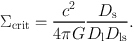 |
(45) |
Here Ds, Dl, and Dls correspond to the angular diameter distances between the observer and the source, observer and the lens, and the lens and the source. Hence, the lensing signal depends on both the redshifts of the lenses and the sources. Note that (in particular) the sources are too faint to determine spectroscopic redshifts, and photometric redshifts are used instead. Early galaxy-galaxy lensing studies lacked redshift information for both lenses and sources and average redshift distributions were used to infer masses (e.g. Hoekstra et al. 2004; Parker et al. 2007). Redshift information is particularly useful for the lenses, as it allows one to study the lensing signal as a function of baryonic content and environment. Often photometric redshifts are also used for the lenses (Hoekstra et al. 2005; Kleinheinrich et al. 2006), with the notable exception of the SDSS (Mandelbaum et al. 2006b; van Uitert et al. 2011).
Redshifts for individual sources are not critical, provided their redshift distribution is known. However, if such information is lacking, faint satellite galaxies associated with the lens will dilute the lensing signal, if left unaccounted for. Furthermore, if these galaxies align their major axis towards the host galaxies, they will bias the signal (Agustsson & Brainerd 2006).
The distortion matrix can
be written in terms of the second
derivatives of the deflection potential Ψ
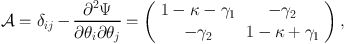 |
(46) |
where we used that κ = 1/2 ∇2Ψ and introduced the complex shear γ ≡ γ1 + iγ2, which are related to the deflection potential through
 |
(47) |
If κ and γ ≪ 1 (i.e., the weak lensing regime), the
effect of the remapping by
is to transform a circular source
into an ellipse, with axis ratio ~ (1 - |γ|) / (1 + |γ|) and
position angle α = arctan(γ2 /
γ1) / 2. In addition,
the source is magnified by a factor
 |
(48) |
boosting the flux by the same amount. To first order, the magnification depends on the convergence only. Both the shearing and magnification of sources are observable effects, although both are quite different in terms of techniques and systematics.
To study the dark matter distribution in the universe, the measurement of the shearing of background galaxies is most commonly used, because of the better signal-to-noise that can be achieved per lens-source pair when compared to the effect of magnification. It involves the measurement of the shapes of the faint background galaxies. Under the assumption that galaxies are randomly oriented in the absence of lensing, the strength of the tidal gravitational field can be inferred from the measured ellipticities of an ensemble of sources.
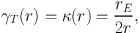
If we consider an isolated lens, the effect of weak lensing is a systematic (purely) tangential alignment of the images of the background galaxies with respect to the lens galaxy. The average tangential distortion, defined as
 |
(49) |
can then be used to quantify the lensing signal. Here φ is the azimuthal angle with respect to the lensing galaxy. For any mass distribution the azimuthally averaged tangential shear can be interpreted as a mass contrast:
 |
(50) |
A simple model to compare to the data is the singular isothermal sphere (SIS) with ρ(r) = σ2 / (2π G r2), where σ is the line-of-sight velocity dispersion. For this mass distribution we obtain
 |
(51) |
where re is the Einstein radius, which can be expressed in terms of σ and β = ⟨ Dls / Ds⟩:
 |
(52) |
If we fit the model to the data from R0 to R, the corresponding error is
 |
(53) |
where  is the number
density of sources and
σgal their intrinsic ellipticity (σgal
~ 0.3). For deep ground based observations
~ 10-20
arcmin-2. As discussed below, we should only consider the signal
at R < 120″ and R > 5″ (because the
lens light should not interfere
with our shape measurement). For a galaxy with a velocity dispersion
of 150 km/s, we obtain a typical signal-to-noise ratio of
re / σre ~ 0.39/1.4 ~ 0.26
(adopting a typical value of
β = 0.6). Even with the much higher source density in HST
observations the best we can achieve is S / N ~ 1. Hence
the signal of an individual lens galaxy is by far too small to be
detected. Instead we have to average the signals for an ensemble of
lenses to improve the signal-to-noise ratio.
is the number
density of sources and
σgal their intrinsic ellipticity (σgal
~ 0.3). For deep ground based observations
~ 10-20
arcmin-2. As discussed below, we should only consider the signal
at R < 120″ and R > 5″ (because the
lens light should not interfere
with our shape measurement). For a galaxy with a velocity dispersion
of 150 km/s, we obtain a typical signal-to-noise ratio of
re / σre ~ 0.39/1.4 ~ 0.26
(adopting a typical value of
β = 0.6). Even with the much higher source density in HST
observations the best we can achieve is S / N ~ 1. Hence
the signal of an individual lens galaxy is by far too small to be
detected. Instead we have to average the signals for an ensemble of
lenses to improve the signal-to-noise ratio.
Furthermore, the induced lensing signal is tiny, much smaller than the typical observational distortions that affect the observed shapes of the galaxies. The most relevant ones are the circularisation by the PSF (seeing) and PSF anisotropy. The former lowers the signal (if uncorrected for) and the latter can mimic a lensing signal. Much effort has been spent on understanding and correcting these sources of systematics. A major driver has been the study of lensing by large-scale structure, a.k.a. cosmic shear, which is an important way to study dark energy (see Hoekstra & Jain 2008 for a review) and extremely sensitive to residual systematics. In galaxy-galaxy lensing, however, one averages the signal perpendicular to lines connecting many lens-source pairs, which are randomly oriented with respect to the direction of PSF anisotropy. As a result any residual systematics are suppressed. The measurement of halo shapes is somewhat more sensitive, but as shown in Hoekstra et al. (2004) current results are not affected and it is possible to reduce the impact further, albeit at the expense of increasing the noise (Mandelbaum et al. 2006a; van Uitert et al. 2012).
The measurement of the magnification provides a complementary way to study the mass distribution. The actual magnification cannot be measured because the intrinsic fluxes of the sources are unknown. Instead, the signal can be inferred from the change in the source number counts. Such a change arises from the balance between two competing effects. On the one hand the actual volume that is surveyed is reduced, because the solid angle behind the cluster is enlarged. However, the fluxes of the sources in this smaller volume are boosted, thus increasing the limiting magnitude. As a consequence, the net change in source surface density depends not only on the mass of the lens, but also on the steepness of the intrinsic luminosity function of the sources. If it is steep, the increase in limiting magnitude wins over the reduction in solid angle, and an excess of sources is observed. If the number counts are shallow a reduction in the source number density is observed.
The uncertainty in the measurement is determined by variations in the number density (i.e., a combination of Poisson noise and the clustering of the sources). A correct interpretation of the results only requires accurate photometry and knowledge of the (unlensed) luminosity function. Therefore the requirements on the PSF are much less stringent compared to the shear-based approach.
The magnification has been measured for quasars in the SDSS (Scranton et al. 2005; Ménard et al. 2008) and Lyman-break galaxies in the CFHT Legacy Survey by Hildebrandt et al. (2009). The latter study is of particular interest, because these drop-out galaxies are readily identified in deep wide-field imaging surveys. Furthermore, as the sources are all at high redshift, this approach provides a unique way to study the masses of high redshift (z ~ 1) galaxies using ground-based data.
6.5. Galaxy-Mass Cross-Correlation Function
If galaxies are well separated, or randomly distributed, the observed lensing signal can be directly related to the ensemble averaged dark matter distribution. In the real universe, however, galaxies are clustered. This complicates such a simple interpretation of the data. On sufficiently small scales the lensing signal is dominated by individual halos, but on larger scales we measure the combined signals from many halos. An example is shown in Figure 19, which shows results from the analysis of 334 deg2 of data from the RCS2 (van Uitert et al. 2011; also see e.g., Fischer et al. 2000; Hoekstra et al. 2004; Sheldon et al. 2004). A significant signal is measured out to 30' from the lenses, which corresponds to ~ 9 Mpc. Figure 19 also shows the best fit NFW profile (to data between 0.2 and 0.6 arcmin), which drops below the observations for scales larger than 1' (~ 300 kpc). Hence on these larger scales the clustering of the lenses is important to interpret the data. van Uitert et al. (2011) also compared the data to a SIS model and found that it also fits the data well out to ~ 300 kpc, indicating that it is typically difficult to distinguish between profiles. We note that Gavazzi et al. (2007) used a combination of strong and weak lensing measurements around massive ellipticals and found that a SIS model provides a good fit to the data. As discussed below, this does not imply that the density profile is isothermal. Rather, it is believed to be the result of the clustering of galaxies, which themselves have NFW density profiles.
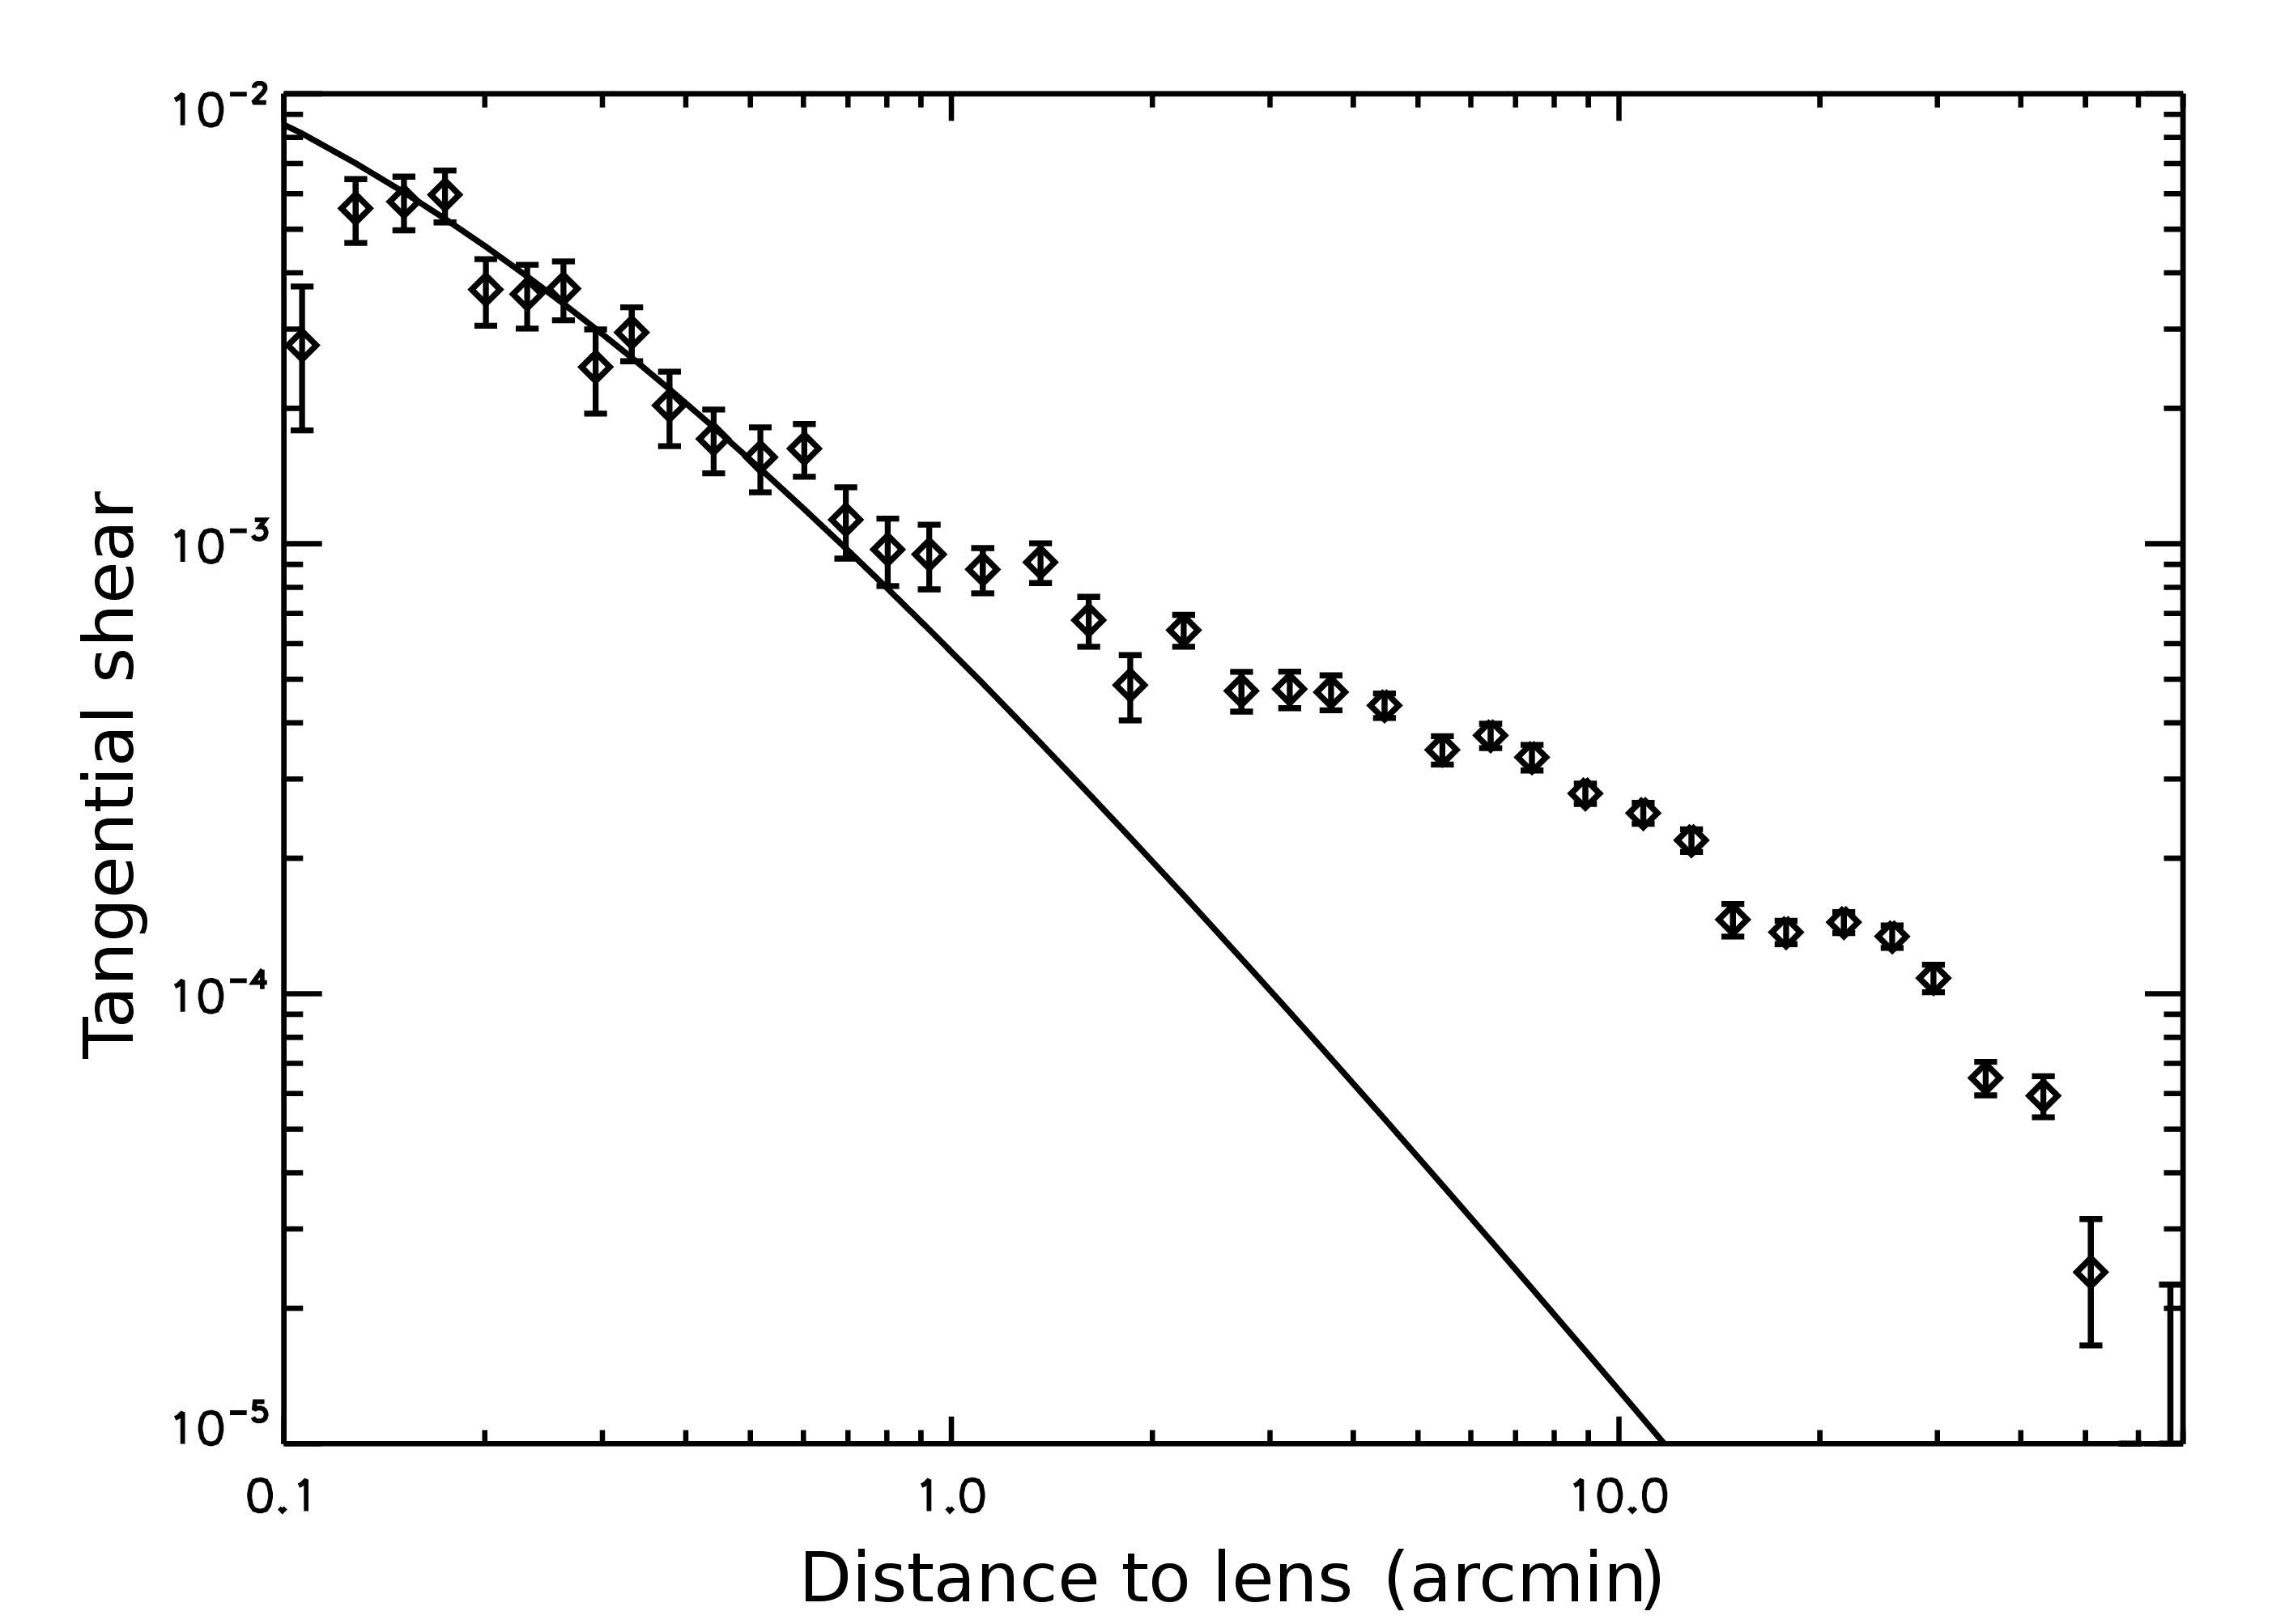 |
Figure 19. Plot of the ensemble averaged tangential shear as a function of distance from the lens using 334 deg2 of r' data from the RCS2 (van Uitert et al. 2011). The lenses are selected to have apparent magnitudes 19.5 < mr < 21.5 and the sources 22 < mr < 24. For reference the best fit NFW profile is also drawn, which shows that on scales beyond 1' (~ 300 kpc) the clustering of the lenses becomes important. |
It is therefore more appropriate to think of the galaxy-galaxy lensing signal as a measurement of the cross-correlation between the galaxy and mass distribution: the galaxy-mass cross-correlation function. This observable provides additional constraints for models of galaxy formation and can be used to study the bias parameter as a function of scale (e.g. van Waerbeke 1998). In particular, it allows us to study whether the (small scale) bias is non-linear and/or stochastic (e.g. Pen 1998; Dekel & Lahav 1999).
The galaxy-mass cross-correlation function is closely related to the galaxy two-point correlation function and the cosmic shear signal, as they all provide ways to study the growth of structures via gravitational instability. On large scales the biasing is (close to) linear and the galaxy and dark matter distributions are well correlated. In this situation the galaxy power spectrum is b2 times the matter power spectrum, P(k) which can be measured through cosmic shear studies (Hoekstra & Jain 2008; Fu et al. 2008). The value of the bias parameter b is not known a priori. Similarly, the galaxy-mass cross-power spectrum will be b × r × P(k), where r is the cross-correlation coefficient. The observed tangential shear measurement can be expressed as a integral over the power spectrum multiplied by a filter (see Guzik & Seljak 2001; Hoekstra et al. 2002, for more details).
The combination of the galaxy two-point correlation function and the galaxy-galaxy lensing signal provides a direct measurement of the ratio b / r as a function of scale. This ratio was first measured by Hoekstra et al. (2001), who later extended the analysis to the full RCS data in Hoekstra et al. (2002). They found that b/r is constant out to ~ 7 Mpc with an average value of 1.09 ± 0.035 for ~ L* galaxies. Sheldon et al. (2004) found similar results using SDSS data. Hoekstra et al. (2002) also included cosmic shear measurements from the VIRMOS-Descart survey (Van Waerbeke et al. 2002) to study the scale dependence of b and r separately. Although, Hoekstra et al. (2002) found tentative evidence for a variation of b and r with scale, this results needs to be confirmed as residual systematics in the cosmic shear signal may have affected the results (Van Waerbeke et al. 2005).
Finally, Reyes et al. (2010) recently showed how General Relativity can be tested by combining the observed galaxy-galaxy lensing signal with measurements of redshift-space distortions and the clustering of galaxies. This measurement combines three probes of large-scale structure to compare the two scalar potentials in the gravitational metric (ψ and φ). In ΛCDM and GR, both scalar potentials are equal. The lensing signal is sensitive to the sum of these, whereas the clustering measurements are only sensitive to the Newtonian potential φ. Although each of the observational probes depends on the value of the bias and the normalization of the power spectrum, the combination of these probes does not. Reyes et al. (2010) used data from the SDSS and found good agreement with GR on scales ranging from ~ 2-40 Mpc. The results cannot yet rule out f(R) gravity models, but do disfavor some TeVeS models.
6.6. Properties of Dark Matter Halos
Although the study of the galaxy-mass cross-correlation function can provide useful constraints for models of galaxy formation, one would also like to learn more about the properties of the galaxy dark matter halos themselves. This requires us to "separate" the contributions from individual halos from the clustering of the lenses. There are a number of ways this can be done. For instance, we can use the actual positions of the lenses and make the simplifying assumption that the observed signal arises only from the dark matter halos associated with those lenses. Hence this approach does not describe well the situation in clusters or the large-scale structure. Furthermore, it is computationally expensive, in particular if the model is extended to include more parameters. An advantage, however, is that it uses the two-dimensional shear field around the lenses, which is compared to the observations in a maximum likelihood fashion. The maximum likelihood method, however, has not been studied in detail using numerical simulations and it is currently unclear to what extent the simplifying assumptions bias the results. Such tests are needed before this approach can be applied to modern, large data sets.
The maximum likelihood method was used by Hoekstra et al. (2004) to examine the extent of dark matter halos around galaxies (also see e.g. Brainerd et al. 1996; Hudson et al. 1998). The lack of color information limited the analysis, but Hoekstra et al. (2004) was able to constrain for the first time the sizes of the dark matter halos. Figure 20 shows the result when an NFW model is assumed (Navarro et al. 1997). The mass and scale radius rs are free parameters in the model, which are well constrained. Numerical simulations of cold dark matter (e.g. Navarro et al. 1997) predict a correlation between these parameters and the dashed line shows this prediction, which is in excellent agreement with these measurements. However, the mass-concentration relation depends on cosmology (in particular the normalization of the matter power spectrum σ8), which has changed over the years. Furthermore, larger numerical simulations have been used to examine the relations between halo properties and their evolution. The original results presented in Hoekstra et al. (2004) used σ8 = 0.85, but updated results with both lower and higher figures both yield larger values for rs. We therefore also show in Figure 20 the expectations for Neto et al. (2007) who used σ8 = 0.9 and Duffy et al. (2008) who used σ8 = 0.8; given the limited investigations on the merits of the maximum likelihood method, it is unclear whether or not there is tension between the data and the predictions. It does suggest that this is an avenue worth pursuing.
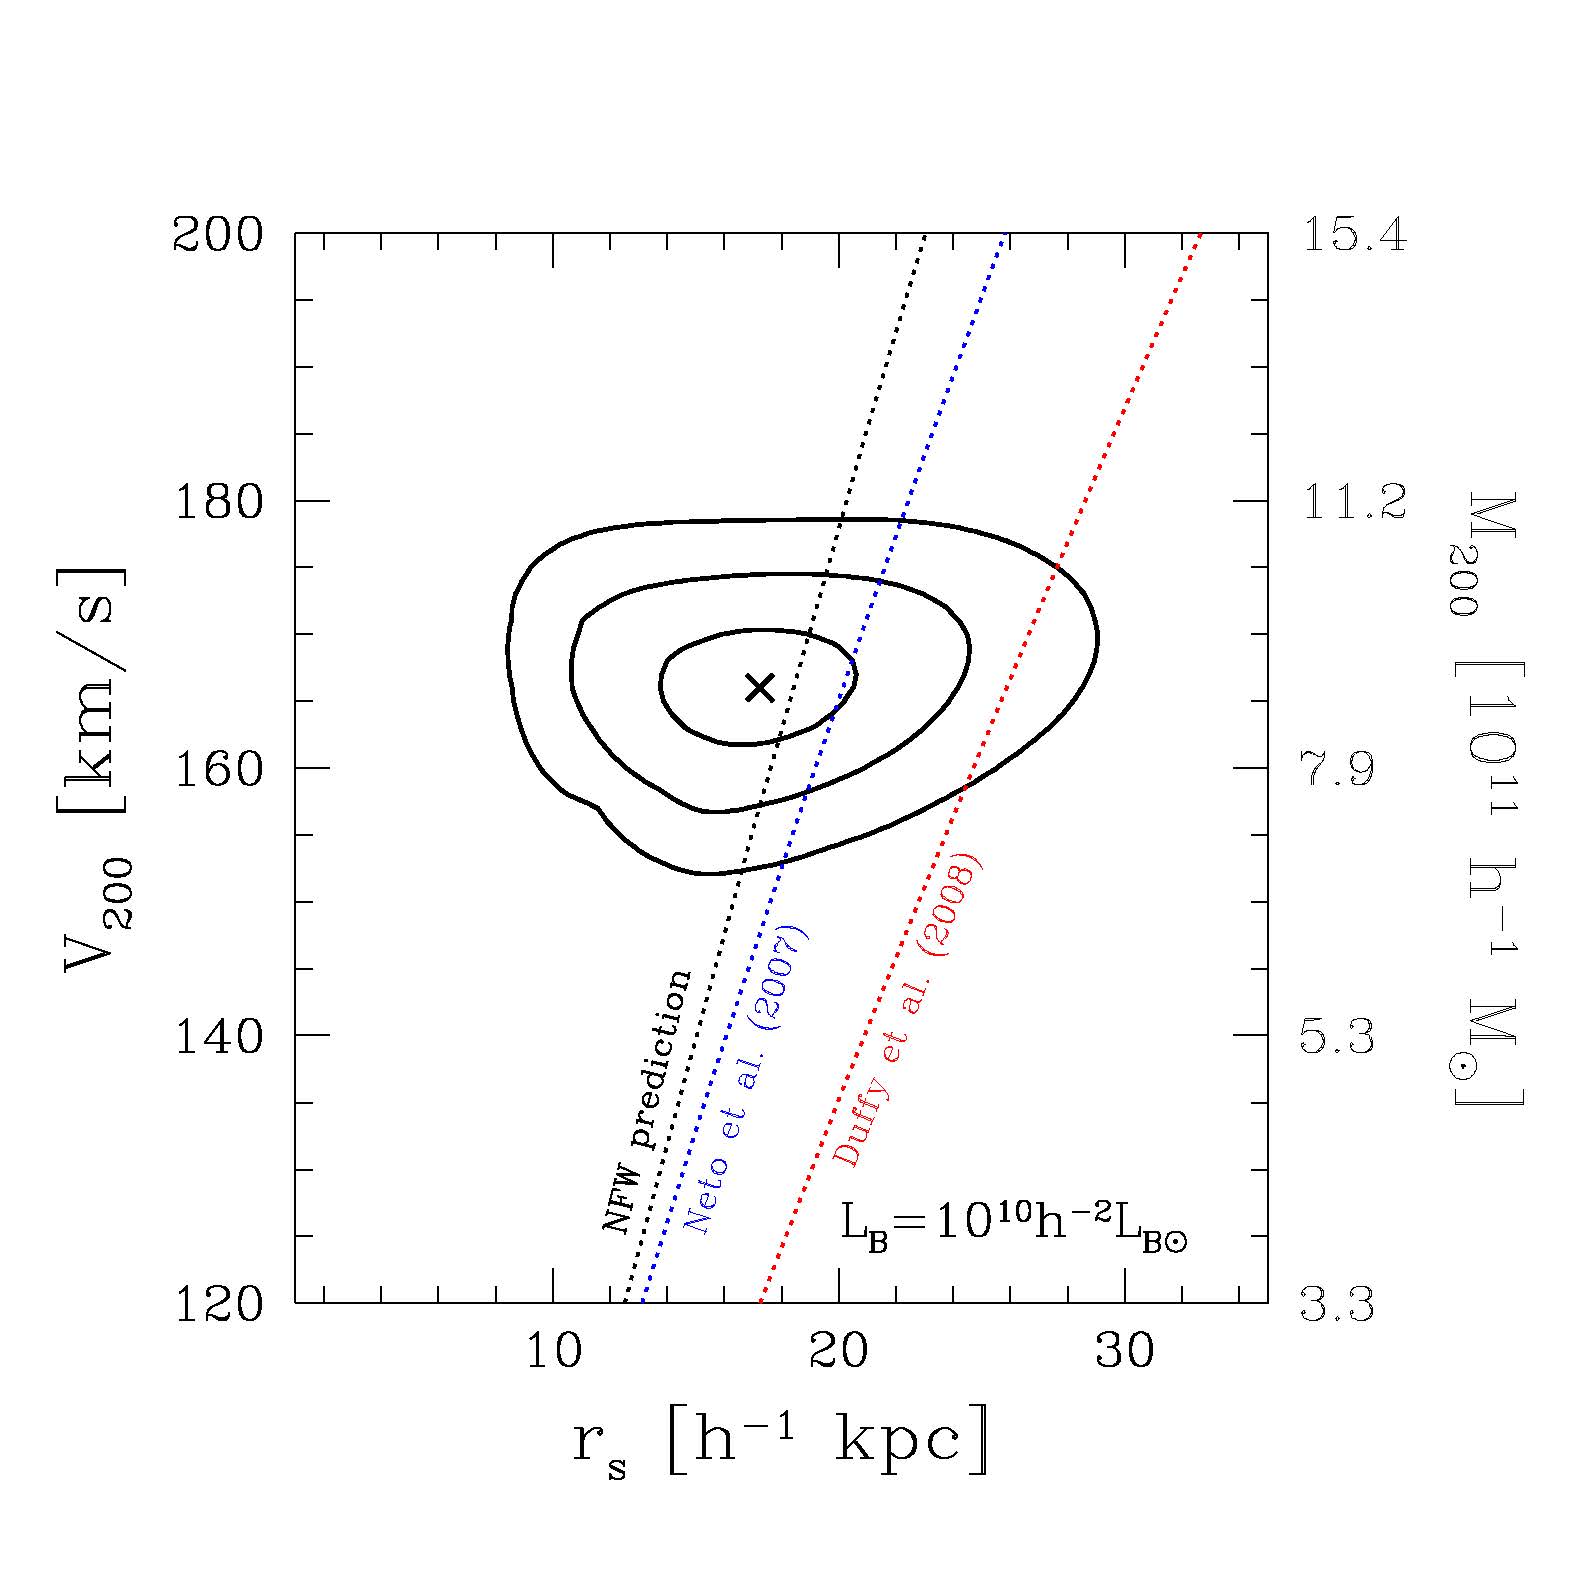 |
Figure 20. Joint constraints on the scale radius rs and mass M200 (and corresponding rotation velocity V200 for a galaxy with an NFW profile and a fiducial luminosity LB = 1010 h-2 LB⊙. The contours indicate the 68%, 95% and 99.7% confidence on two parameters jointly. The dotted line indicates the prediction from the numerical simulations by NFW (from Hoekstra et al. 2004). Our updated version of this figure shows expectations from works by Neto et al. (2007) and Duffy et al. (2008). |
In high density regions, such as clusters of galaxies, the galaxy dark matter halos are expected to be tidally stripped due to the interaction with the tidal field of the smooth cluster mass distribution. Galaxy-galaxy lensing studies provide the only way to examine the sizes of the dark matter halos as a function of cluster-centric radius (Natarajan & Kneib 1997; Natarajan et al. 1998). A complication is that the signal arises from a combination of the stripped halos and the global cluster mass distribution. The various components can be modelled by a maximum likelihood method 21). To minimize contamination by field galaxies, with their much more extended halos, early work has been confined to early type galaxies (Natarajan et al. 1998; Limousin et al. 2007), but recently Natarajan et al. (2009) were able to study late type galaxies as well. These studies have shown that dark matter halos of cluster galaxies are tidally truncated (Limousin et al. 2007; Natarajan et al. 2009), which is also observed in strong lensing studies (Halkola et al. 2007).
The clustering of dark matter halos as a function of mass is well-understood. This knowledge can be used to predict the galaxy-mass cross-correlation function, by relating the dark matter distribution statistically to the observable galaxies through a halo occupation distribution (HOD; Seljak 2000; for a review see Cooray & Sheth 2002). This halo model approach is a powerful (and natural) way to interpret the data as it provides a natural way to account for the fact that the clustering depends on mass and that more massive halos host more than one galaxy (i.e., groups and clusters of galaxies). A minor drawback is that it only uses the tangential component of the shear. For isolated lenses the signal is indeed purely tangential, but this is no longer the case for an ensemble of lenses. The halo model was used by Guzik & Seljak (2002) and Mandelbaum et al. (2006b) to interpret the results from the SDSS and constrain the fraction of satellite galaxies. A similar study was carried out by van Uitert et al. (2011) who complemented the SDSS spectroscopic data with deep imaging data from the second Red-sequence Cluster Survey (RCS2). This improved constraints for the massive galaxies, which on average are at higher redshifts.
The former studies focus only on the galaxy-mass cross-correlation function, but a consistent model for galaxy formation also makes predictions for the clustering of galaxies and the luminosity and/or stellar mass functions. Combining the information of these complementary probes can improve the constraints on the halo model parameters (Leauthaud et al. 2011). Such a joint analysis was performed recently by Leauthaud et al. (2012) using data from the COSMOS survey. The high quality lensing data, in combination with unprecedented wavelength coverage, allowed Leauthaud et al. (2012) to study the evolution of the stellar-to-halo mass relation from z = 0.2 out to z = 1. They found that the halo mass scales with stellar mass ∝ M*0.46 for galaxies with M*<5 × 10¹⁰M⊙ over the redshift range studied, whereas the slope of the relation steepens for higher masses.
One can also attempt to 'avoid' the complication caused by the clustering of the lenses by considering only relatively ‘isolated' lenses. In this case the observed lensing signal is dominated by only a single galaxy. Such a selection, which requires (photometric) redshift information, was used in Hoekstra et al. (2005) to study the relation between the virial mass and the luminosity. They limited the sample to galaxies that are more than 30" away from a brighter galaxy. For these galaxies Hoekstra et al. (2005) found that the virial mass scales with luminosity as ∝ L1.5, in agreement with the results from Guzik & Seljak (2002); Mandelbaum et al. (2006b) who used the halo model to interpret the SDSS data. For a galaxy with fiducial luminosity of LB = 1010 h-2 LB⊙ Hoekstra et al. (2005) obtained a virial mass Mvir = 9.9-1.3+1.5 × 10¹¹ M⊙, also in good agreement with Mandelbaum et al. (2006b).
If we assume that baryons do not escape the dark matter overdensity they are associated with, the ratio of Mb, the mass in baryons, to the virial total mass of the halo is Mb / Mvir = Ωb / Ωm. Furthermore, the amount of cold gas is negligible for massive galaxies. Therefore, by comparing the stellar mass of the lenses to the virial mass determined by weak lensing, the efficiency with which baryons are converted into stars can be constrained. Hoekstra et al. (2005) found that late types convert a ~ 2 times larger fraction of baryons into stars compared to early-type galaxies. The measurement of Hoekstra et al. (2005) is mostly constrained by relatively luminous galaxies. Mandelbaum et al. (2006b) find that the conversion efficiencies are independent of morphological type for stellar masses less than ~ 7 × 10¹⁰M⊙, but also find that later type galaxies appear more efficient for higher stellar masses. Heymans et al. (2006) used GEMS data to study the mean virial to stellar mass ratio for a complete sample of massive galaxies out to z ~ 0.8. The results, which agreed well with Hoekstra et al. (2005) and Mandelbaum et al. (2006b) showed little evidence for evolution. Leauthaud et al. (2012) also study the stellar mass fraction as a function of mass finding a minimum at a halo mass of ~ 1.2 × 10¹² M⊙.
These studies demonstrate the potential of weak lensing results for the study of galaxy evolution. We note, however, the accuracy of the halo model is limited, and that measurements soon will be limited by this.
The average shape of dark matter halos can provide another way to learn more about the nature of dark matter (and the interaction with baryons). Numerical simulations of CDM have shown that the resulting dark matter halos are triaxial with a typical ellipticity of ~ 0.3 (e.g. Dubinski & Carlberg 1991; Jing & Suto 2002b; Hayashi et al. 2007). In the case of self-interacting dark matter, the predicted halos are more spherical, although this difference is more pronounced on small scales (Davé et al. 2001). We also note that hydrodynamic simulations suggest that baryonic effects cause dark matter halos to evolve more oblate configurations at all radii, even if the effect of baryons is most prominent in the inner parts (e.g. Kazantzidis et al. 2004; 2010).
The small scales, which are baryon-dominated, are best probed by strong lensing studies or dynamical studies. The latter approach has been extended to larger scales through the study of streams of stars in the Milky Way (Helmi 2004; Koposov et al. 2010). On large scales, which are best constrained by numerical simulations, only weak lensing studies can provide observational constraints on the shapes of dark matter halos. The measurement, however, is difficult: we now need to measure an azimuthal variation in the, already small, galaxy-galaxy lensing signal. The azimuthal variation is measured with respect to the major axis of the light distribution, i.e. we assume that the halos are aligned with the lens. If halos are flattened, but not aligned with the light distribution, the resulting lensing signal will be isotropic. Hence, any misalignment will reduce the amplitude of the azimuthal variation and the weak lensing constraints are in effect lower limits on the shapes. Such misalignments might result from baryonic effects. For instance Bailin et al. (2005) found in their hydrodynamic simulations of disk galaxies that the outer part of the halo is not well aligned with the inner regions, which do show a good alignment between disk and inner halo (also see e.g. Abadi et al. 2010).
Weak lensing studies of dark matter halo shapes are more sensitive to systematic effects/errors compared to the measurement of the galaxy-mass cross-correlation function. For instance, residual PSF anisotropy leads to correlations between the lenses and sources, biasing the dark matter halo shape determination (Hoekstra et al. 2004; Mandelbaum et al. 2006a, e.g.). However, even in the absence of residual systematics, lensing by lower redshift structures can align the lens and the source, reducing the signature of an anisotropic halo. This cosmic shear contribution is described in detail in Mandelbaum et al. (2006a) (also see Brainerd 2010 and Howell & Brainerd 2010 who also discuss this problem). This source of bias becomes more prominent with increasing lens redshift and will need to be taken into account when interpreting the current generation of surveys. Fortunately, Mandelbaum et al. (2006a) provide a method to suppress this signal, although this can only be applied reliably on relatively small scales and with limited accuracy (van Uitert et al. 2012).
A successful measurement of the halo shapes requires a much larger number of lens-source pairs, as the signal-to-noise ratio is about a tenth of that of the tangential shear signal, and limited to small scales (van Uitert et al. 2012). In recent years a number of pioneering studies have been carried out, but the results are still inconclusive. The first claim of elliptical dark matter halos using weak lensing was presented in Hoekstra et al. (2004) using 42 deg2 of data from the RCS. The lenses were selected based on their apparent magnitude and early type galaxies contribute most of the signal. Hoekstra et al. (2004) found that the halos are aligned with the light distribution and estimated an ellipticity of ⟨ ehalo⟩ = 0.33-0.09+0.07. These results are in fair agreement with the results from Parker et al. (2007), who used 22 deg2 of deep i′ data from the CFHT Legacy Survey and also inferred an ellipticity ~ 0.3.
The analysis of SDSS data by Mandelbaum et al. (2006a) did not detect an azimuthal variation in the lensing signal when considering the full sample of lens galaxies. However, when restricting the sample to bright early type galaxies, the results of Mandelbaum et al. (2006a) do suggest that the halos are aligned with the light. Recently, van Uitert et al. (2012) completed the analysis of 800 deg2 of RCS2 data, but did not detect a significant anisotropy signal. Part of the loss of precision is caused by a careful accounting for possible systematic effects.
An interesting, still open question, is whether the alignments are the same for different types of galaxies. The possible differences between the various analyses needs to be investigated further, but it is clear that significant progress will only be possible with the next generation of deep, multi-color surveys which provide redshift information for the lenses. The latter is important because of the scale dependence of the anisotropy signal (Mandelbaum et al. 2006a; van Uitert et al. 2012).
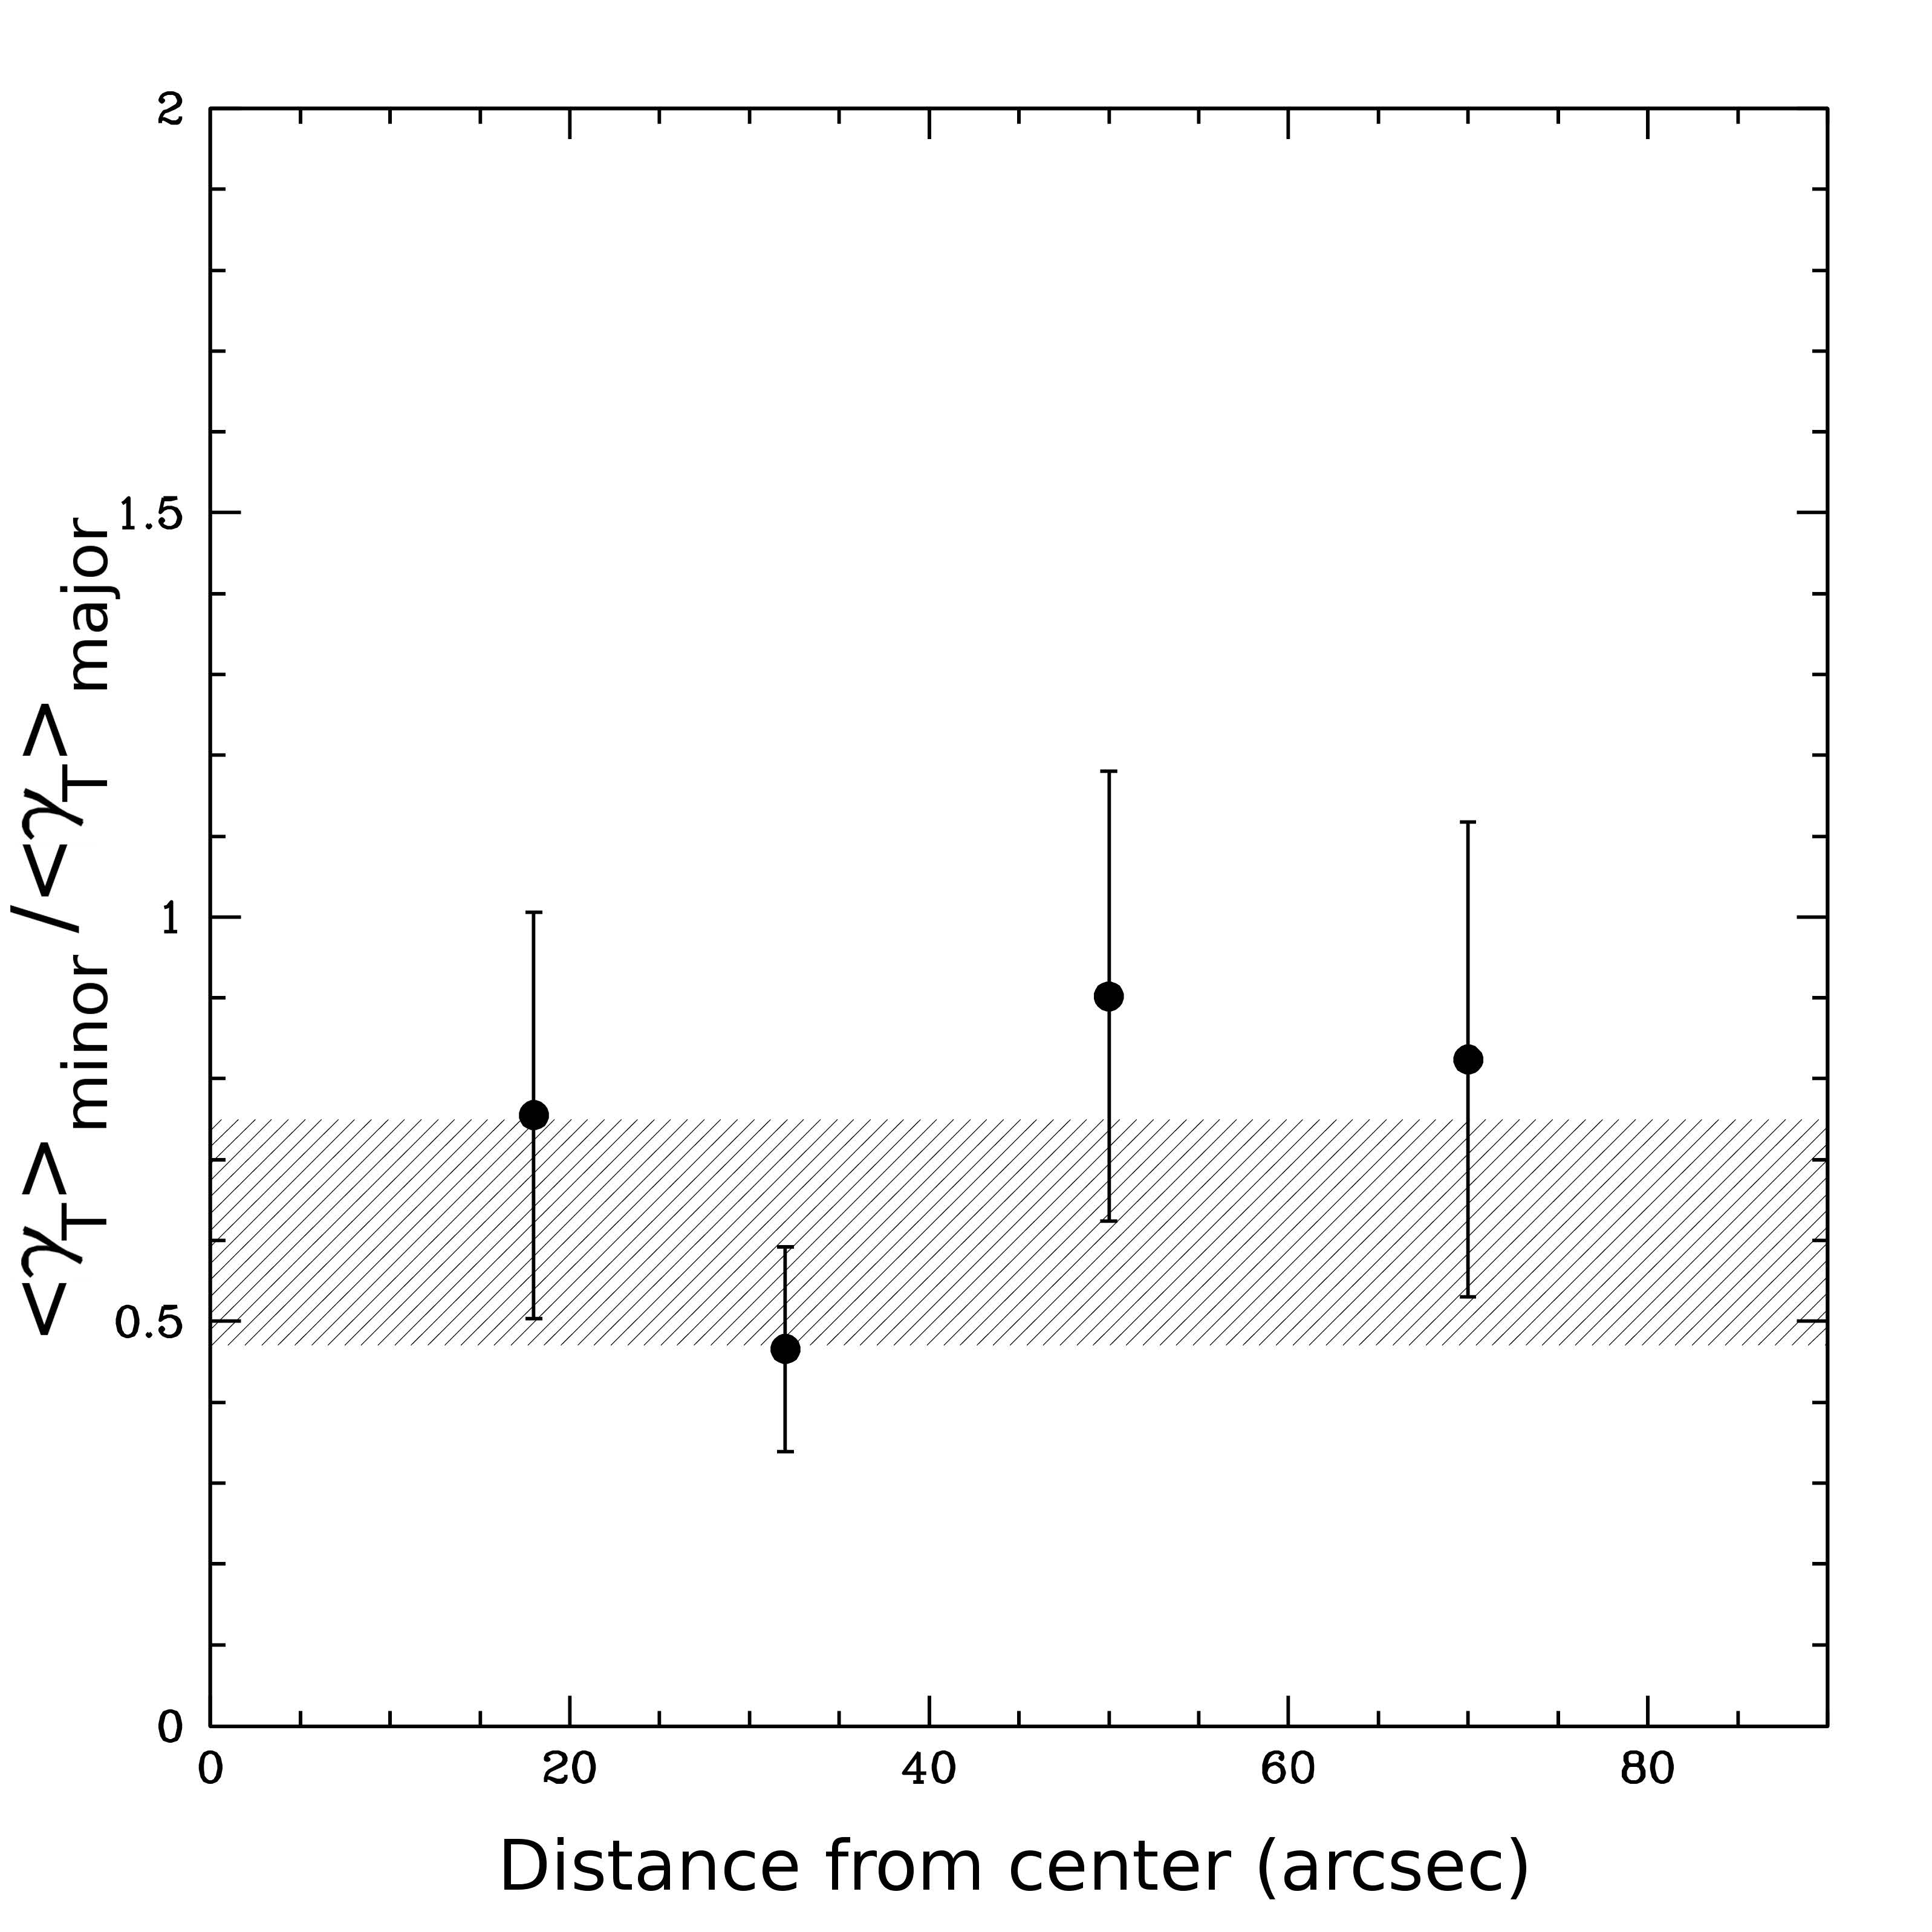 |
Figure 21. Ratio of the mean shear experienced by sources closest to the minor axes of a foreground lens to that of sourcest closest to the major axes for lenses with axis ratios b/a between 0.5 and 0.8. This criterion preferentially selects early type galaxies. The results are taken from Parker et al. (2007) who analysed 22 deg2 of i′ data from the CFHTLS. The weighted average shear ratio is 0.61 ± 0.14. |
Early weak galaxy-galaxy studies have already provided unique constrains on the properties of dark matter halos, such as constraints on their extent and shapes, as well as masses. The SDSS results have demonstrated the usefulness of multi-color data and redshift information for the lenses. Of particular interest would be studies that complement the SDSS with deeper imaging. The precision of photometric redshifts limits their usefulness at low redshifts, but for the study of lenses with z > 0.3 the excellent statistics that can be achieved from the next generation surveys are expected to outweigh the limitations. For instance the KiloDegree Survey (KiDS) which started observations in the fall of 2011 will cover 1500 deg2 in nine filters. The extensive wavelength coverage will yield accurate photometric redshifts for the lenses. As a result statistical errors will be reduced by a factor ~ 4 over current results and provide a first opportunity to study in detail the properties of dark matter halos as a function of density and baryon contents. The Dark Energy Survey, which recently started taking data, will image 5000 deg2.
Another major step forward will come from the Large Synoptic Survey Telescope (LSST) which plans to start surveying ~ 20,000 deg2 around the turn of this decade and space-based dark energy projects, such as the recently approved Euclid mission (Laureijs et al. 2011), which is scheduled for launch in 2020. The excellent statistics provided by the latter projects will allow for the study the galaxy lensing signal over a wide range in physical properties and redshift. Thanks to these developments galaxy-galaxy lensing will continue to develop into an important tool to study galaxy masses as a function of their (observable) baryonic properties.
20 In fact, it was the first attempt ever to measure a weak lensing signal. Back.
21 Which can also include strong lensing features to constrain the model further. Back.