


A common criticism of some local Lyα studies is that the sample selection is different from that of LAEs and LBGs at z≳ 2. The first generations of small HST studies were assembled largely from IUE atlas (Kinney et al., 1993), which in turn were selected from older objective prism or BCG surveys; in contrast most high-z objects are selected by Lyman break techniques or Lyα detection in narrowband filters. Several recent studies have begun to rectify this: firstly using HST the Lyman Break Analog samples (Heckman et al., 2005, Hoopes et al., 2007, based upon UV luminosity and compactness), the Lyman alpha Reference Sample (LARS; Hayes et al., 2013, Hayes et al., 2014, based upon UV luminosity and Hα EW), and studies undertaken with the GALEX Satellite (Deharveng et al., 2008, Cowie et al., 2010, based upon selection by Lyα emission).
The GALEX satellite has been a vital contributer to low-z Lyα astrophysics. As well as FUV and NUV imaging channels, GALEX also had the capability to perform slitless spectroscopy across the same FUV and NUV bandpasses, providing low-resolution spectroscopy of Lyα for objects at z ≈ 0.19 − 0.45 and z ≈ 0.65 − 1.25. In turn, this enables us to really survey the low-z universe for Lyα-emitting galaxies (Deharveng et al., 2008, Cowie et al., 2010), and redshifts around 1 (Barger et al., 2012, Wold et al., 2014), in a manner very similar to those employed at high-z. In the FUV channels GALEX LAE surveys capture objects with NUV apparent magnitudes down to 21.8 (AB); at z = 0.3 this corresponds to a SFR of 3.6 M⊙ yr−1, assuming the continuum is unobscured.
Figure 10 shows the Lyα luminosities probed by various studies out to z ∼ 4. As shown by the cyan squares and red upward-facing triangles, UV-selected LARS galaxies and GALEX LAEs occupy a very similar range of Lyα luminosities. Contrasting these luminosities with some z > 2 surveys, significant overlap is seen with the deepest ground-based observations: surveys of Hayes et al., (2010), Cantalupo et al. (2012, both narrowband), and Rauch et al. (2008, blind long-slit spectroscopy, without aperture correction) overlap the local HST and GALEX samples at above the 50% level.
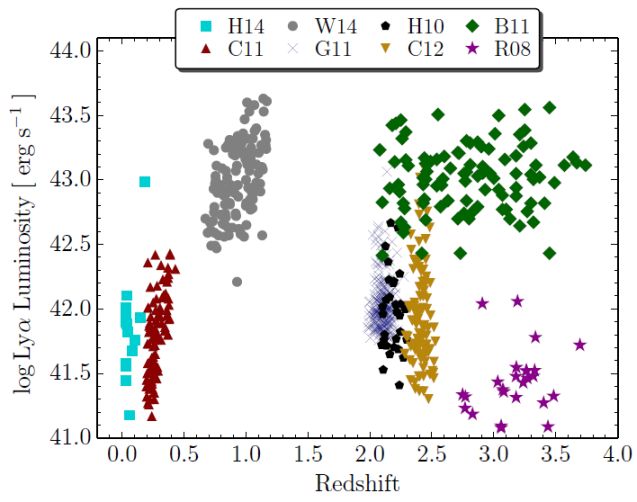 |
Figure 10. The Lyα luminosities probed by various galaxy surveys. Reference coding: C10 = Cowie et al., (2011); W14 = Wold et al., (2014); H14 = Hayes et al., (2014); R08 = Rauch et al., (2008); G11 = Guaita et al., (2011); B11 = Blanc et al., (2011); C12 = Cantalupo et al., (2012); H10 = Hayes et al., (2010). Narrowband surveys (G11, C12, H10) have been artificially randomized by Δz = 0.05 to aid visibility. |
The z ∼ 1 LAEs discovered by GALEX, however, are an order of magnitude more luminous than the z < 0.4 sample, and show almost no overlap with the more local objects. This is entirely a matter of distance, where the same limiting flux corresponds to a factor of 20 difference luminosity between z = 0.3 and 1. This difference in luminosity may introduce some biases when comparing the luminosity distributions of the two GALEX samples, as we show in the coming Section. These z ∼ 1 LAEs, however, do span a similar luminosity range to some of the larger volume, shallower Lyα-surveys at z ≳ 3 (e.g. Blanc et al., 2011).
In the following Sections I discuss the most important results from the ⟨ z ⟩ = 0.3 and ∼ 1 studies with GALEX, regarding the numbers/evolution of Lyα-emitting galaxies (Section 6.1), and statistical studies of their properties (Section 6.2); in part of course the properties of galaxies are part of that evolutionary process.
6.1. Evolution of Lyman alpha Galaxies into the Nearby Universe
IUE demonstrated that Lyα emission is rare in the nearby universe but GALEX could determine how rare. The first Lyα luminosity functions (LFs) at z ≈ 0.3 showed that Lyα emitting galaxies have become both fainter and less abundant than at high-z. Figure 11 shows the LFs measured at z∼ 0.3 and 1 (Cowie et al., 2010, Wold et al., 2014, respectively) together with recent measurements for z = 2.1 (Ciardullo et al., 2012).
It should be noted that, while these LFs are the best that can be done with GALEX, the samples are not large: 119 at z ∼ 0.3 and 141 at z ∼ 1. However, because of GALEX's wide field-of-view and the large continuous wavelength range provided by slitless spectroscopy, the cosmic volumes probed are in fact rather large, and covering several 106 comoving Mpc3. Thus while the individual parameters in the Schechter function may not be very tightly constrained, the small number of galaxies is certainly because of the relative paucity of LAEs at lower redshifts.
As discussed in Section 6, the two GALEX samples cover different luminosity ranges (Figure 10). Moreover the dynamic range of the surveys is not large, and even for the less luminous z ≲ 0.4 sample it is not possible to calculate the faint-end-slope (α) of the LF. Thus the LFs presented in Figure 11 assume α, basing the assumption on measured values at z = 2−3 for the z ∼ 1 sample, and the α for local Hα-emitters for the z ≲ 0.4 sample. Note also that the faint-end slope of the Lyα LF is also not very tightly constrained at high redshift (reasons outlined in Dressler et al., 2014).
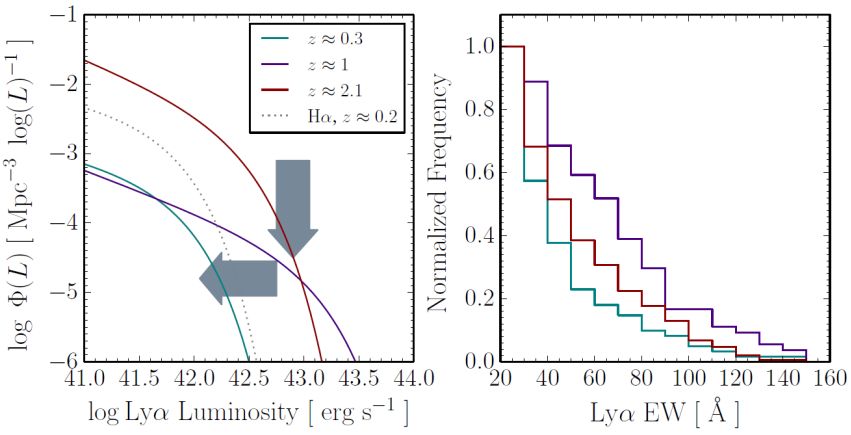 |
Figure 11. Left: The evolution of the Lyα luminosity functions with redshift. Turquoise line shows the z ≈ 0.3 LF of Cowie et al., (2010) and purple shows the z ≈ 1 LF of Wold et al., (2014), measured by GALEX FUV and NUV, respectively. The dark red line shows the LF of Ciardullo et al., (2012), measured at z = 2.1 using narrowband filters. Significant evolution is seen between the distant universe and the local one; grey arrows show the suspected modes of evolution in both luminosity and density (see text for details). The dotted line shows the Hα LF at z = 0.2 of Tresse & Maddox, (1998). Right: the cumulative Lyα equivalent width distribution at the same redshifts; data are taken from the same surveys, with the z ≈ 2.1 distributions from Guaita et al. (2010, 2011). |
At z ≈ 0.3 and to the UV limits mentioned in Section 6, the shape of the Lyα LF closely resembles that of Hα and Hβ, although is lower in normalization: Lyα-emitting galaxies make up about ≈ 15 % of the local Hα-selected galaxy population (Deharveng et al., 2008, Hu et al., 2009) and 1/20 the FUV counts at the same z (Cowie et al., 2010). This equates to a volume-averaged escape fraction of below 1 % (Hayes et al., 2011), although this fescLyα will be slightly higher when considering possible emission from galaxies not formally classed as LAEs (i.e. galaxies that emit weaker Lyα with 0 ≤ WLyα < 20Å). At z ∼ 2 the average fescLyα is ≈ 5 %, so the average Lyα output of the whole cosmic volume decreases 5-fold. Note that this decrease in the emitted fraction of Lyα happens on top of the decrease in the cosmic star formation rate density, which also drops by a factor of 5–10 over the same change in redshift (Madau & Dickinson, 2014), implying the Lyα luminosity density of the local universe is far below that of z ≳ 2.
A large fraction of this evolution takes place in the 4.3 Gyr that elapses between redshifts of 1 and 0.3 (Wold et al., 2014). At the higher redshift of 1 luminous Lyα emitters are certainly in place, with luminosities equivalent to L⋆ at z ≈ 2−3, and the evolution between z ≈ 0.3 and 1 can be well described by a simple factor of 10 increase of L⋆ in the Schechter, (1976) function. Over this redshift range the space density of LAEs does not appear to change but the galaxies simply scale up in luminosity. Between z = 1 and 2 (3 Gyr), φ⋆ increases by an order of magnitude to produce the LFs observed in ground-based surveys. Arrows in Figure 11 show how the evolution of the LF manifests as a drop in density, followed by a dimming. Between the peak in the cosmic SFRD at z ∼ 2−3 and z = 1, the universe first acts to turn off a fraction of the Lyα emitters, whereafter between z = 1 and the nearby universe the abundance is constant but the galaxies get fainter in line with the evolution in both the UV and Hα.
Interestingly, this evolution is not strongly reflected in the equivalent width distribution of LAEs, which does not evolve as dramatically. The EW distribution of Guaita et al., (2011) at z ≈ 2.1 agrees well with the distribution at z ∼ 1 (shown in the right panel of Figure 11) despite the fact that the overall Lyα-emitting fraction has decreased by a factor near 5 (Cowie et al., 2010 contrasted with Shapley et al., 2003). Thus whatever process is turning Lyα-emitters off it does not affect the shape of the remaining EW distribution (i.e. galaxies with WLyα ≳ 20Å). Of course the equivalent width distribution of the overall population changes significantly, as many galaxies drop below the canonical 20Å limit; the higher EW tail of the distribution remains largely constant. Note that it is not necessarily fair to conclude strong evolution in the EW distribution to z∼ 0.3 from Figure 11, as the GALEX FUV observations are first continuum selected. This will lead to a fraction of continuum-faint objects with high EWs being missed, which will extend the tail of the distribution. However because the bulk of the luminosity comes from low EW galaxies, the LFs are will be largely unaffected.
In light of the extended Lyα halos discussed in Section 5.2, we may ask whether much Lyα also extends beyond the spectroscopic extraction apertures of GALEX. These spectra are extracted using an optimal model of the point spread function (PSF, Morrissey et al., 2007), which has FWHM of ≈ 5′′. At z = 0.3 (z = 1) this aperture corresponds to a spatial scale of 22 (40) kpc, and thus one dimensional spectra are summed over scales that exceed this. At z ∼ 0.3 the aperture is 5 times the median Lyα Petrosian radius in LARS, and while we do not known precisely how the Lyα profiles behave at larger radii, it is likely that in most cases GALEX captures the majority of the total flux. At z = 1 Barger et al., (2012) discovered a giant Lyα blob, extended over an 18′′ diameter, but also measure such objects to be extremely rare (one in the whole volume). Moreover, aperture sizes (≈ 5′′ at z = 0.3) are equivalent to a 3′′ diameter aperture at z = 2, so if halo extension does significantly affect the recovered Lyα flux, it is likely by a similar factor as in high-z observations.
6.2. The Properties of Nearby Lyman alpha Galaxies
Unlike most high-z studies, both the GALEX and HST samples are sufficiently close that many of their properties may be systematically measured. I assemble some of the key data obtained from these telescopes in Figure 12, and in this Section discuss what we have learned about galaxies that emit, and do not emit, Lyα.
 |
Figure 12. Scatter plots to the Left show the observed global Lyα / Hα ratio measured by GALEX (pink squares) and HST (dark blue circles). For the GALEX samples, data are assembled from Cowie et al., (2011), Scarlata et al., (2009), Finkelstein et al., (2011), and Atek et al., (2014); for the HST samples data are taken from Östlin et al., (2009, 2014) and Hayes et al., (2013, 2014). Note that because of the differing quantities plotted on the abscissa, the figures do not necessarily include the same number of points. Furthermore, since these points are chosen to have Lyα in emission, the non-emitting population cannot be visualized. Upper Left: the absolute UV magnitude in the AB system. Upper Right: the Hα equivalent width. Lower Left: the Hα/Hβ ratio, where the black line shows the effect of dust attenuation (Calzetti et al., 2000 law), assuming Lyα / Hα = 8.7 and Hα / Hβ = 2.86. Lower Right: the [Nii]λ 6584Å / Hα ratio (=N2 index). Histograms to the Right compare the frequency of GALEX-LAEs (pink filled histograms) and non-Lyα-emitting galaxies (green outlined histogram), as a function of WHα (upper) and N2 index (lower). |
Over the Lyα luminosity ranges probed by low-z Lyα observations (∼ 1042 erg s−1), known LAEs have typical stellar masses on the order of ∼ 109 M⊙ (Finkelstein et al., 2011, Hayes et al., 2014). This is significantly higher than estimates made for most LAE samples at high-z, while the Lyα luminosities are equivalent or somewhat lower. This difference in the M / L(Lyα) reflects the fact that the average nearby galaxy is more evolved, and has had substantially more time to build stellar mass than a similarly selected galaxy in the more distant universe.
This evolution is also reflected in recovered stellar ages. However caution is needed here: when estimated from SED fitting age is a luminosity-weighted average, and wavelength-dependent function of the included bands and the range of permitted star-formation histories. Finkelstein et al., (2011) find a wide range of SED-fit ages with a median of ∼ 300 Myr. However when subtracting an underlying population of old stars, Hayes et al., (2014) determine recent star-formation to have occurred in short bursts with luminosity-weighted ages up to a few tens of Myr. This suggests that Lyα emitting galaxies, like starbursts in general, have temp temporarily elevated SFRs. The total Lyα luminosity shows no dependency upon stellar age, but both WLyα and the relative throughput (fescLyα) are higher in younger galaxies.
The above would suggest that Lyα escape fractions and equivalent widths are higher in galaxies with higher Hα equivalent width, which roughly measures the specific SFR (sSFR). Cowie et al., (2011) indeed show that the fraction of Lyα-emitting galaxies increases when progressively higher Hα EW thresholds are applied, finding almost 60% LAEs in sub-samples of WHα > 250Å. Hayes et al., (2014) similarly find that all their galaxies with fescLyα above 10% have Hα EWs above 400Å. Interestingly, however this effect is not visible when comparing the Lyα / Hα ratio (or WLyα) with WHα (Figure 12) for the objects with WLyα > 20 Å. The most convincing results emerge when we compare the average properties of LAE and non-LAE samples.
In UV-selected local galaxies, the objects with the highest WLyα and fescLyα are found to be among the more compact ones. LARS galaxies tend to have particularly compact UV morphologies and LAEs are found among those with Petrosian radii of ∼ 1 kpc on average, similar to higher redshift results of Malhotra et al., (2012). Larger galaxies all show lower WLyα.
Galaxies hosting Lyα-emitting starbursts represent a mixture of various types, although still a mixture that is distinct from the UV-selected galaxy population in general. The LAEs contain a higher fraction of compact galaxies and merging systems. More curiously, an enhanced fraction of the GALEX LAE disks appear to be face on (Cowie et al., 2010). This phenomenon is also expected from radiative transfer modeling (Verhamme et al., 2012, Laursen et al., 2013), and suggests that orientation effects may hide some disks from Lyα selection. Unfortunately current samples are not sufficiently large to test Lyα emission as a function of inclination angle.
6.2.3. Interstellar Dust and Metals
LAEs have bluer UV-optical colours than non-emitting galaxies of the same magnitude (Cowie et al., 2010, 2011) but there is significant overlap in colours between the emitting and non-emitting subsamples. UV-selected samples similarly exhibit higher Lyα escape fractions (fescLyα >10 %) where UV colours are bluer (β < −1.8; Hayes et al., 2014). This should be in part a reflection of the stellar age effects discussed in Section 6.2.1, but may also be due to dust extinction that reduces the Lyα throughput: Lyα / Hα ratios and escape fractions (independent of age) are both higher for bluer galaxies, not only equivalent widths.
The average Lyα / Hα ratio found for the GALEX-selected LAEs is slightly above 2 (Atek et al., 2009a, Scarlata et al., 2009, Cowie et al., 2010), although perhaps surprisingly, plots comparing Lyα and Hα flux directly show no general covariance over more than 1 dex in each quantity. Examining Lyα / Hα however, the ratio decreases significantly with increasing Hα / Hβ, and the conclusion that dust reduces the transmitted Lyα in the LAE samples is shared over many studies. Indeed as shown in the lower left panel of Figure 12a, the anticorrelation between Lyα / Hα and Hα/Hβ is one of the few trends that is significant over the dynamic range of today's surveys.
The comparison of these line ratios with extinction laws reveals several curious features. Firstly, at the lowest Hα/Hβ ratios, most of the galaxies lie below the predicted curves, and even in Lyα-selected samples only ∼ 25% of Lyα photons escape when Hα / Hβ is in the range 2.8–3.2. These galaxies emit less Lyα than dust attenuation would predict. However the same is not true for dustier galaxies: at Hα / Hβ ≳4 the mean Lyα / Hα ratio is ∼ 1, even though from this Balmer decrement we would would expect 97% of the Lyα radiation to be absorbed. Thus the locus of points in the Lyα / Hα – Hα / Hβ plane shows a trend that is much flatter than known extinction laws, and the normalized Lyα escape fraction (measured fescLyα divided by that which is expected for the derived dust content) increases with attenuation. Above EB−V ≈ 0.3 Lyα emission becomes on average several times stronger than expected (Scarlata et al., 2009, Atek et al., 2014, Hayes et al., 2014).
The most basic example of a simple screen of dust that reddens the nebular lines is incompatible with observation. Atek et al., (2009a) and Finkelstein et al., (2009) invoked the Neufeld, (1991) geometry to explain this apparent enhancement of Lyα, in which dust is embedded within the Hi clumps of a multiphase ISM, and Lyα scattering prevents photons from encountering dust. Radiative transport simulations show that this effective ‘boost' of Lyα is very difficult to reproduce without rather contrived combinations of parameters (Laursen et al., 2013, Duval et al., 2014), and the predicted increase of Lyα EW with measured attenuation is not observed.
Scarlata et al., (2009) argue instead for a scenario that requires no such preservational scattering, but is still built upon a clumpy dust distribution (which may anyway follow the cold gas). This model does not require clumps to act as mirrors to Lyα and nor does it predict Lyα EW to rise with EB−V. Similarly Atek et al., (2014) point out that a galaxy is likely made up of many Hii regions with a large variety of optical depths and since we see only down to an optical depth of 1 at each wavelength, observed radiation in each line (and continuum) comes from regions of different sizes. At the dusty end of the galaxy distribution these latter two scenarios do not require any scattering at all, and indeed recently Martin et al., (2015) have shown that significant Lyα emission can be detected from ultraluminous infrared galaxies (ULIRGs), from which it most likely escapes through holes in the ISM.
Dust can absorb Lyα and metals cannot. At the UV luminosities probed by GALEX and LARS, the LAEs exhibit metallicities that overlap with the UV-continuum selected galaxies, but extend down to lower metal abundance. LAEs are on average deficient in nebular oxygen by about 0.4 dex (Figure 12c), and are drawn mainly from a sub-populations with metallicities of 12 + log(O/H) ≲ 8.2. Indeed a remarkable result from the GALEX studies is that the N2 index (= log([Nii] / Hα) segregates Lyα-emitters from non-emitters more cleanly than Hα / Hβ.
Part of this apparent preference for low metallicity galaxies comes from an enhanced fraction of more compact irregular galaxies (Section 6.2.2), which are lower metallicity in general. Comparing Lyα EW with age and metallicity, Cowie et al., (2011) suggest LAEs are drawn from a stage in the evolutionary sequence during which metals build up and Lyα EWs decrease, in a similar way to that which would be expected for Hα. In addition Hayes et al., (2014) find that not only does EW decrease with age but also the Lyα escape fraction, which has no dependence upon stellar evolutionary stage. This shows that not only do older stellar populations produce less Lyα, but also that their ISM become more opaque to Lyα; this would also support hypothesis of dust buildup, although current samples do not have the statistical power to say whether this is purely a dust effect.
While dust absorption is ultimately the process that can expunge Lyα radiation from a galaxy, Hi scattering determines the path length of Lyα between the nebulae in which it is produced and eventual emission. Here we discuss observations that probe the Hi phase directly by 21 cm emission, telling us about the total amount of Hi available for scattering, and its large scale kinematics. For a discussion of the Hi properties measured on small scales by absorption line studies, see Section 4.
Masses in Hi, and the large scale Hi envelope of individual galaxies can only be measured by 21 cm observations, which currently limits us to the nearby universe. However to avoid Lyα absorption by the Milky Way and to separate the line from geocoronal emission, the lower limit of a galaxy's recession velocity is cz ≲ 2500 km s−1. By this distance of ≈ 35 Mpc, Hi 21 cm observations are already challenging (Pardy et al., 2014).
Regarding the Lyα-absorbing dwarf galaxies, I Zw 18 is known to lie within a huge Hi envelope that is many times its optical size, with a central column density of NHi ≳ 1021 cm−2 (van Zee et al., 1998) and total mass of 7 × 10⁷ M⊙. Thus if all the Hi were static with respect to the Hii regions, Lyα would see upwards of 107 optical depths at line centre. SBS 0335-052 exhibits very similar properties in both central Lyα absorption and large static Hi envelope (Thuan et al., 1999). In cases like this the fate of the Lyα radiation is unclear: does the Lyα scatter so many times that it is eventually absorbed by the small amount of available dust, or does the Lyα eventually leak out in a large, low surface-brightness halo that cannot easily be detected? Without very large aperture imaging observations that cannot be obtained with existing facilities, conclusive answers are difficult to provide.
Sixteen more starbursts (MUV = −17.5 to −21, from Östlin et al., (2009) and the LARS sample), complete with Lyα imaging and spectroscopy from HST, have been observed at λ = 21 cm with the Green Bank Telescope (GBT) and/or Karl G. Jansky Very Large Array (VLA, Cannon et al., 2004, Pardy et al., 2014). Hi masses are between 109 to several 1010 M⊙, which is or 10–100 times as much as the dwarf galaxies, but for the seven galaxies where Hi detections are resolved the central column densities are comparable. In these samples the Lyα-emitting objects with fescLyα above 10% all have Hi masses below 4× 10⁹M⊙. While galaxies above this mass emit only a small fraction of their Lyα photons, several of the less Hi-massive galaxies also show fescLyα below a few percent, or in absorption. The same result is seen with dynamical masses derived from Hi line-widths. While it may be hypothesized that less Hi would permit more Lyα photons to escape, it cannot be ruled out that this anti-correlation between fescLyα and MHI is not simply reflecting the fact that higher fescLyα is also seen at lower stellar mass (Section 6.2.1) and is not causally connected with Hi.
Spatial resolution in these 21 cm observations is currently still low, even with the VLA, but in every case the Hi is resolved, and extends over more than 10 Petrosian radii in the UV. Most galaxies show signs of tidal interactions, both in their 21 cm morphologies and line shapes. Perhaps most interestingly ESO 338-IG04, IRAS 08339+6517 (Cannon et al., 2004) and Arp 238 (LARS 03, Pardy et al., 2014) show long Hi tidal streams and debris trails: in the cases of ESO 338-IG04 and IRAS 08339+6517 these streams stretch over 50–100 kpc to companion objects, while in Arp 238 a huge (M ∼ 2 × 10⁹ M⊙) Hi body has been ejected that contains no apparent companion galaxy at the level of SDSS imaging.