


3.1. Progress in Rotation Curve Studies Evidencing for the Dark Halo
The rotation of galaxies was discovered a century ago when inclined spectra were observed across the nuclei of nearby galaxies. The modern era of rotation curves started in the 1950's when red-sensitive photographic plates were used to observe the Hα λ6563 and [NII] λ6584 emission lines arising from HII regions. History review of developments in the galaxy rotation has been given in Sofue and Rubin (2001).
Since the early measurements, flat rotation curves were routinely observed in spiral galaxies. Figure 8 shows a progress in the rotation curve obtained for the spiral galaxy M31. Late in the last century, larger and advanced telescopes and detectors in optical, infrared, and radio observations combined with higher spectral resolution have allowed us to obtain higher accuracy rotation curves at farther distances. The generally observed 'flat rotation' in disk galaxies has shown the existence of massive dark halo around galaxies.
 |
Figure 8. Half a century progress in the rotation curve of M31. From top to bottom: 1950's rotation curve using data by M.U. Mayall et al. of 1940's (Takase 1957); 1960's in the HI 21-cm line (Roberts 1966); a modern PV diagram and rotation curve in HI, showing flat rotation up to 40 kpc (Chemin et al. 2009); and a grand RC from the center to ∼ 300 kpc in semi logarithmic scaling (Sofue 2013b). |
3.2. Observations of Rotation Velocities
In this subsection we review the progress in obtaining rotation curves and related techniques and analysis methods. The content is based on our earlier review in Sofue and Rubin (2001), while recent topics and particular progress are added. In table 5 we list the major papers in which rotation curve data are available in machine-readable formats, or in figures and tables.
| Authors‡ (year) | Objects | Distances | Method | Catalogue type† |
| Mathewson et al. (1992) | 965 southern spirals | <∼ 100 Mpc | Hα/HI | RC/TF |
| Amram et al. (1994) | 21 NGC/UGC | Cluster | Hα | RC/VF/tab. |
| Makarov et al. (1997, 2001) | 135 edge-on | ∼ 100 Mpc | Hα | RC |
| Vogt et al. (2004a, b) | 329 spirals | z < 0.045 | Hα/HI, RC, M/L, FuP | |
| Fridman et al. (2005) | 15 Sb/Sc/NGC | 10 - 70 Mpc | Hα/FP | RC/PV/VF |
| GHASP (2002-05) | 85 spirals | Hα/FP | RC/VF | |
| Márquez et al. (2002) | 111 spipral/NGC | Hα/HII | RC | |
| Blais-Ouellette et al. (2004) | 6 Sb/Sc | <∼ 20 Mpc | FP | RC/VF |
| URC (1996-2007) | Spirals | Nearby | Av. of compil. | Universal RC |
| Big FP Hα Survey (Hernandez, et al. 2005) | 21 barred spirals | 2-38 Mpc | Hα FP | RC, Vf |
| Daigle et al. 2006; Dicaire et al. 2008) | ||||
| Noordermeer et al. (2007) | 19 S0/Sa/U,NGC | 15 - 65 Mpc | Hα/HI | RC/PV/VF |
| THINGS (2008) | 19 Nearby NGC | Nearby | HI | RC/PV/VF |
| Spano et al. (2008) | 36 NGC | Nearby | HI | RC |
| DiskMass (2010-13) | 146 face-on | B < 14.7 | Hα/[OIII]/CaII/IS | RC/VF |
| Sofue et al. (1996); Sofue (2003, 2016) | ∼ 100 Sb/Sc/NGC | Nearby+Virgo | Hα/CO/HI | RC/PV |
| McGaugh et al. (2001) | 36 LSB | Hα/slit | RC | |
| de Blok and Bosma (2002) | 26 LSB/UGC | 3 - 45 Mpc | Hα/HI | RC/PV |
| Swaters et al. (2009) | 62 LSB dw/Ir/UGC | Nearby | Hα | RC/PV |
| † RC=rotation curve, VF = velocity field, PV = position-velocity diagram, FP = Fabry Perrot, FuP = fundamental plane; IS = integral fiber spectroscopy. ‡ URC: Persic et al. (1996), Salucci et al. (2007); THINGS: de Blok et al. (2008); GHASP: Garrido et al. (2002-05); DiskMass: Bershady et al.(2010a, b), Martinsson et al. (2013). | ||||
Observations of optical emission lines such as Hαand [NII] lines sample population I objects, particularly HII regions associated with star forming regions in the galactic disk. These objects have small velocity dispersion compared to the rotation velocity, which allows us to derive circular velocities without suffering from relatively high velocity components by polulation II stars. The traditional method to derive rotation curves is long slit spectral observation along the major axis of disk galaxies (Rubin et al. 1982, 1985; Mathewson et al. 1992; Amram et al. 1994; Corradi et al. 1991; Courteau 1997; Sofue et al. 1998).
On the other hand, absorption lines, showing high velocity dispersion and slower rotation, manifest kinematics of population II stars composing spheroidal components and thick disk. Their line width is used to estimate the Virial mass through the pressure term in the equation of motion. In this paper, however, we concentrate on low velocity dispersion component for rotation velocities.
 |
Figure 9. Slit spectrum of the Hα 6563A and [NII] 6584A lines along the major axis of Sb galaxy NGC 4527 (Sofue et al. 1999b) |
3.2.2. Two-dimensional spectroscopy for velocity fields
Fabry-Perot spectrographs are used to measure two-dimensional velocity fields in disk galaxies. Velocity fields include information not only of the global galactic rotation, but also non-circular stream motions due to spiral arms and bars (Vaughan 1989; Vogel et al. 1993; Regan and Vogel 1994; Weiner and Williams 1996; Garrido et al. 2002, 2004; Kamphius et al. 2000; Vogel et al. 1993; Hernandez et al. 2005; Daigle et al. 2006; Dicaire et al. 2008; Shetty et al. 2007).
The recent "DiskMass" survey of disk galaxies have observed largest sample of nearly face-on galaxies from the Upsala Galaxies Catalogue (UGC) brighter than B = 14.7 with disk sizes 10 to 20 arcsec, and obtained their two-dimensional dynamical data (Bershady et al. 2010a, b; Martinsson et al. 2013a, 2013b; Westfall et al. 2014). They employed integral-field spectroscopy fiber instruments to measure stellar and ionized gas kinematics, covering [OIII]λ5007 and Hαlines. They also observed MgIb and CaII near-infrared triplet in stellar absorption for kinematics of spheroidal and old disk components.
Spectral observations in the infrared wavelengths, including the Paα and/or [Si VI] lines, and integral field analysis technique are powerful tools to reveal kinematics of dusty disks (Krabbe et al. 1997; Tecza et al. 2000). They are particularly useful in the nuclear regions of spiral galaxies, where dust extinction is significant, so that even such a red line as Hα is heavily obscured. Infrared observations are also powerful for mergers with dust buried nuclei.
Rotation of outer disks of galaxies is crucial to derive the mass in the dark halo, while observations are still scarce because of the faint and small numbers of emission regions. Not only bright HII regions, but also planetary nebulae and satellite galaxies are used as test particles for determining the mass distribution in outer regions.
The 21-cm HI line is powerful to obtain kinematics of entire spiral galaxy, because the radial extent in HI gas is usually much greater than that of the visible disk. HI measurements have played a fundamental role in establishing the flatness of rotation curves in spiral galaxies (e.g., Bosma 1981a, b).
The CO molecular lines in the millimeter wave range are valuable in studying kinematics of the inner disk and central regions of spiral galaxies for their higher concentration toward the center than HI, which is deficient in the center, and for their extinction free nature against the central dusty disks (Sofue 1996, 1997).
3.3. Methods to Determine Rotation Velocities
A rotation curve of a galaxy is defined as the trace of terminal velocity on the major axis corrected for the inclination of the galaxy's disk. The observed lines are integration various velocity components along the line of sight through the galaxy disk. Hence, the intensity peaks do not necessarily represent the terminal velocities.
3.3.1. Peak-intensity and intensity-weighted velocities
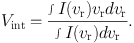
The velocity at which the line intensity attains its maximum, which is called the peak-intensity velocity, is often adopted to represent the rotation velocity, method (Mathewson et al. 1992, 1996). More popular method is to measure the intensity-weighted velocities, which is sometimes approximated by a centroid velocity of half-maximum values of a line profile (Rubin et al. 1982, 1985). The intensity-weighted velocity is defined by
 |
(26) |
Here, I(vr) is the intensity as a function of the radial velocity. Rotation velocity is then given by
 |
(27) |
where i is the inclination angle and Vsys is the systemic velocity of the galaxy.
However, the intensity-weighted velocity gives always underestimated rotation velocity because of the finite resolution of observation, due to which the plus and minus velocities in both sides of the nucleus are not resolved, but are averaged. Thus, derived rotation curves often start from zero velocity at the center. However, the nucleus is the place nesting a massive black hole and high density bulge core, where gas and stars are most violently moving. Therefore, one must carefully apply the peak-intensity and/or intensity weighted velocity methods, because the methods often largely underestimate the central rotation velocities. However, they usually result in good approximation in sufficiently resolved outer disks.
3.3.2. Terminal-velocity and envelope-tracing method
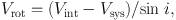
The terminal velocity Vt in a position-velocity (PV) diagram is defined by a velocity, at which the intensity becomes equal to
 |
(28) |
where Imax is the maximum intensity, and Ilc is the intensity representing the lowest contour, which is often taken at ∼ 3 rms noise level in the PV diagram. The fraction η (0.2 ∼ 0.5) represents the critical intensity level of the line profile.
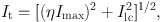
The rotation velocity is then derived as
 |
(29) |
where σISM and σobs are the velocity dispersion of the interstellar gas and the velocity resolution of observations, respectively. The interstellar velocity dispersion is of the order of σISM ∼ 7 to 10 km s−1 , while σobs depends on instruments.
3.3.3. Iteration methods using position-velocity (PV) diagram and 3D cube
A reliable method to estimate the rotation velocity is the iteration method, with which observed PV diagram is reproduced by the finally obtained rotation curve (Takamiya and Sofue 2000). In this method, an initial rotation curve RC0 settled from the observed PV diagram using by any method as above. Using RC0 and the observed radial distribution of the intensity, a PV diagram, PV1, is constructed. The difference between PV1 and PV0 is then used to correct RC0 to obtain a corrected rotation curve, RC1. This RC1 is used to calculate another PV diagram PV2 using the observed intensity distribution, from which the next iterated rotation curve, RC2 is obtained by correcting for the difference between PV2 and PV0. This procedure is iteratively repeated until PVi and PV0 becomes identical within the error, and the final PVi gives the most reliable rotation curve.
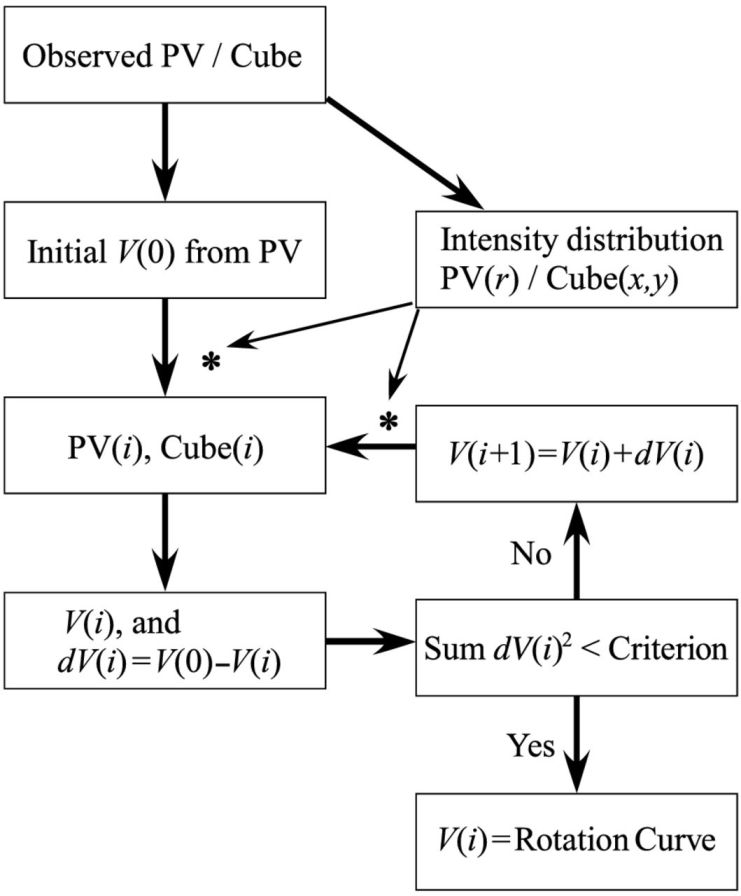 |
Figure 10. Iteration method of rotation curve fitting using PV diagrams and/or 3D cube. |
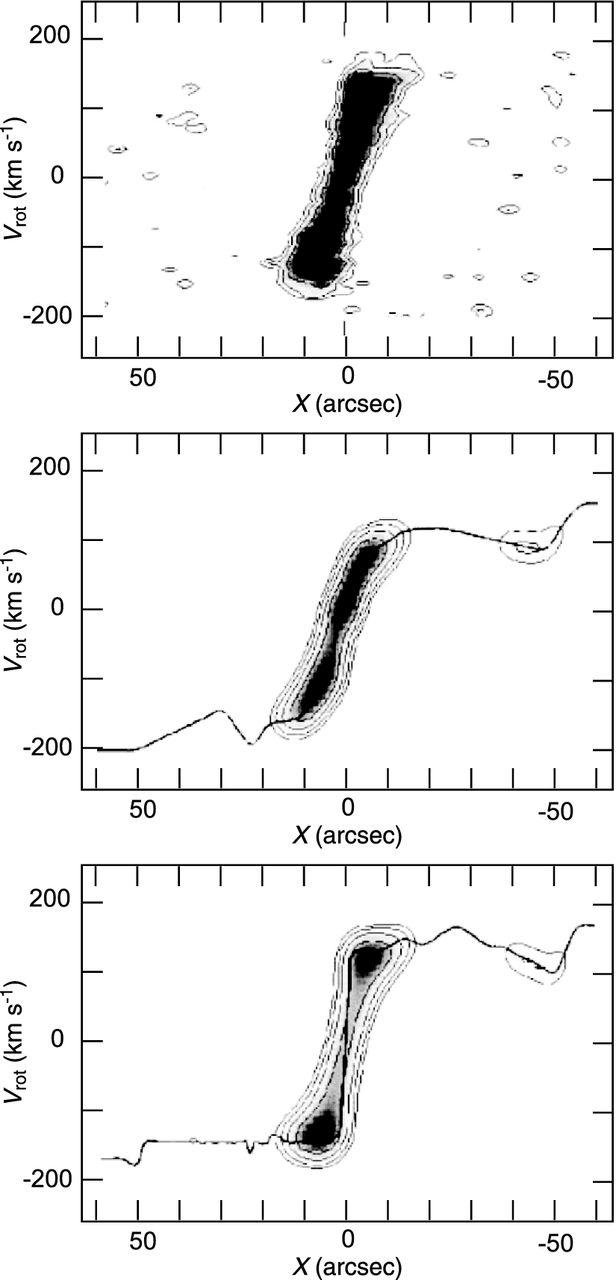 |
Figure 11. Iteration method: a PV diagram of NGC 4536 in the CO line (top panel), an approximate rotation curve using the peak-intensity method and corresponding PV diagram, the final rotation curve and reproduced PV diagram (bottom). |
The PV diagram along the major axis represents only one dimensional velocity information along the major axis. The next-generation measurement of rotation velocities would be to utilize three-dimensional spectral data cube of the entire galaxy. This will be particularly useful for optically thin radio lines in the central regions such as HI and CO lines. The reduction procedure would be similar to that for the PV iteration method. We first settle an approximate RC, and calculate a data cube using this RC and observed intensity distribution. The calculated cube is then compared with the original cube, and the difference is used to correct for the initially assumed rotation curve. This procedure is repeated iterative to minimize the difference between the calculated and observed cubes. In 3D iteration method, the entire data cube is analyzed without losing information, and we would be able to reach an ultimate rotation curve of a galaxy. The method will be particularly useful for obtaining a rotation curve in the central region, where observational resolution is not sufficient.
3.3.5. Tilted-ring method for rotation velocity
The rotation velocity Vrot , inclination angle i, and observed radial velocity vr relative to the systemic velocity are related to each other as
 |
(30) |
where θ is azimuth angle in the disk of a measured point from the major axis. Obviously the rotation velocity and inclination are coupled to yield the same value of vr.
The most convenient way to derive a rotation curve is to measure radial velocities along the major axis using position-velocity diagrams, as described in the previous subsection. Thereby, inclination angle i has to be measured independently or assumed. Given the inclination, the rotation velocity is obtained by
 |
(31) |
with vr = vr(r, 0).
Inclination angle i is measured from the ratio of major to minor axial lengths of optical isophotes of a galaxy. An alternative way is to compare the integrated HI line width with that expected from the Tully-Fisher relation (Shetty et al. 2007). However, as equation 31 shows, the error in resulting velocity is large for small i, and the result diverges for a face-on galaxy.
If a velocity field is observed, coupling of the rotation velocity and inclination can be solved using the tilted-ring technique to determine either rotation velocity or the inclination (Bosma 1981; Begeman 1989; Józsa et al. 2007). The radial velocity vr is related to position angle φ and azimuthal angle θ as
 |
(32) |
with
 |
(33) |
and vr,max is the maximum value along an annulus ring.
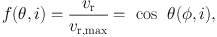
Figure 12 shows variations of cos θ(φ), or vr normalized by its maximum value along an annulus ring, as functions of φ and θ for different values of inclination. The functional shape against φ is uniquely dependent on inclination i, which makes it possible to determine inclination angle by iterative fitting of vr by the function. Once i is determined, Vrot is calculated using vr. Thus, both the inclination and Vrot are obtained simultaneously.
 |
Figure 12. Variation of V′ = vr / vr, max along a tilted-ring as a function of position angle φ (full line) for different inclinations (from bottom lines: i = 85∘, 75∘, 60∘, 45∘, 30∘ and 15∘). Variation against azimuthal angle θ is shown dashed. |
In often adopted method, the galactic disk is divided into many oval rings, whose position angles of major axis are determined by tracing the maximum saddle loci of the velocity field. Along each ring the angle θ is measured from the major axis. Observed values of f(θ, i) are compared with calculated values, and the value of i is adjusted until chi2 gets minimal stable. The value of i yielding the least χ2 is adopted as the inclination of this ring. This procedure is applied to neighboring rings iteratively to yield the least χ2 over all the rings. Begeman (1989) has extensively studied the tilted-ring method, and concluded that it is not possible to determine inclinations for galaxies whose inclination angles are less than 40∘. Di Teodoro and Fraternali (2015) recently developed a more sophisticated method incorporating the velocity field as a 3D cube data (velocity, x and y) to fit to a disk rotation curve.
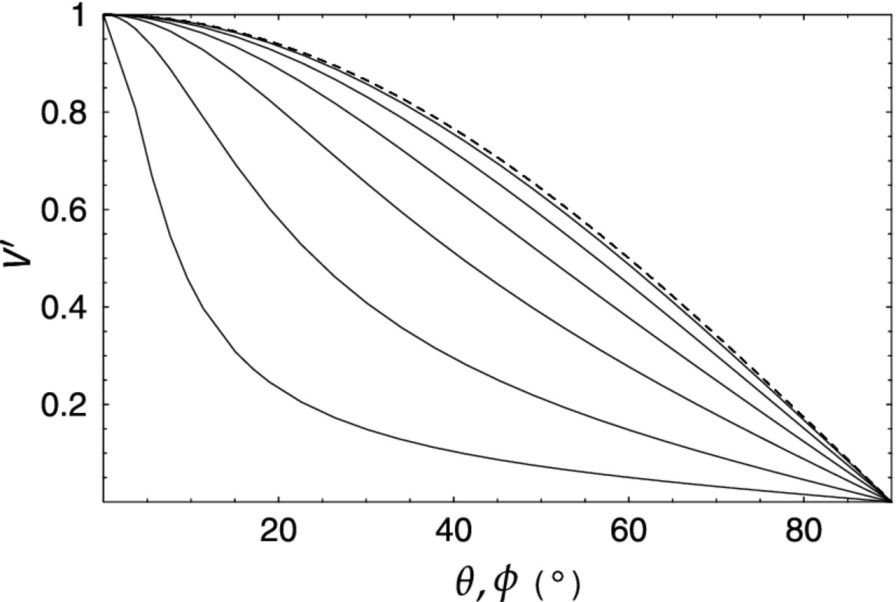 |
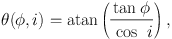
Figure 13. Tilted rings and velocity field fitted to HI velocity fields of NGC 5055 (Bosma 1981a). |
3.3.6 Tilted-ring method for inclination
The tilted-ring method is useful for highly and mildly inclined galaxies for velocity determination, but it fails when the galaxy is nearly face-on. This property, in turn, may be used to determine the inclination by assuming the rotation velocity, remembering that the inclination is written as sin i = vr / Vrot , which means that the inclination can be determined by measuring vr, if Vrot is given.
This equation is used for determination of inclination using the Tully-Fisher relation: The intrinsic line width is determined by the disk luminosity, and is compared with observed line width to estimate the inclination angle. The equation can be used to determine inclinations of individual annulus rings, if the rotation curve is given. This principle has been applied to analyzing warping of the outer HI disk of the face-on galaxy NGC 628 (Kamphuis and Briggs 1992) and M51 (figure 20: Oikawa and Sofue 2014).
3.4. Galaxy Types and Rotation Curves
3.4.1. Observed rotation curves
Figure 14 shows rotation curves published in the two decades as compiled from the literature by Sofue (2016), and figure 15 shows those for galaxies types from Sa to Sc. The shapes of disk and halo rotation curves are similar to each other for different morphologies from Sa to Sc, from less massive to massive galaxies. This suggests that the form of the gravitational potential in the disk and halo is rather universal over the galaxy types.
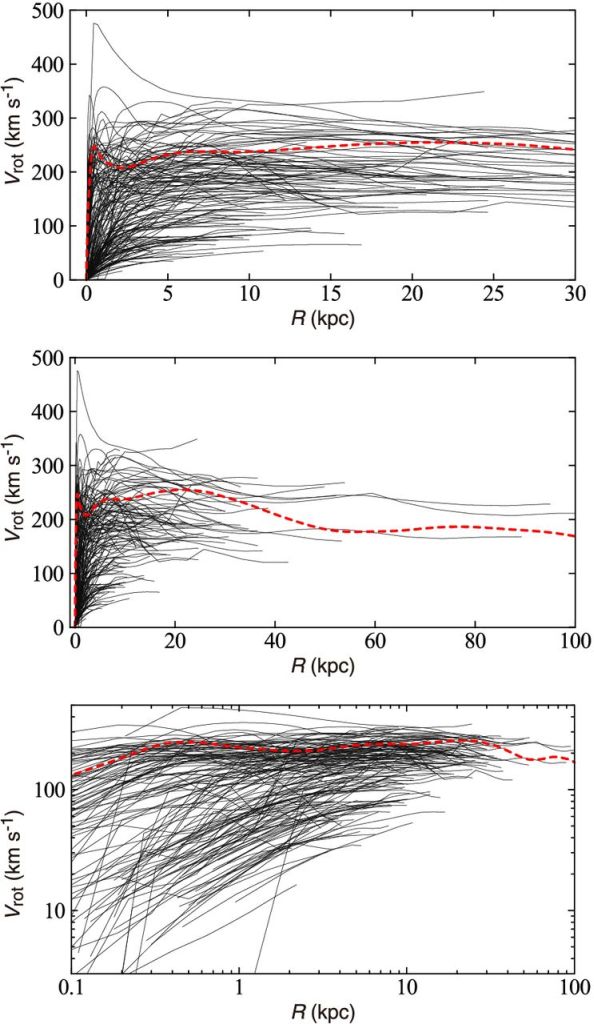 |
Figure 14. Rotation curve compilation (Sofue 2015), which includes those from Sofue et al. (1999, 2003); Ryder et al. (1998); Hlavacek-Larrondo et al. (2011a, b); Erroz-Ferrer et al. (2012); Gentile et al. (2015); Olling (1996); Whitmore & Schweizer (1987); Richards et al. (2015); Scarano et al. (2008); Gentile et al. (2007); Marquez et al. (2004); de Blok et al. (2008); Garrido et al. (2005); Noordermeer et al. (2007); Swaters et al. (2009); Martinsson et al. (2013); Bershady et al. (2010a, b). |
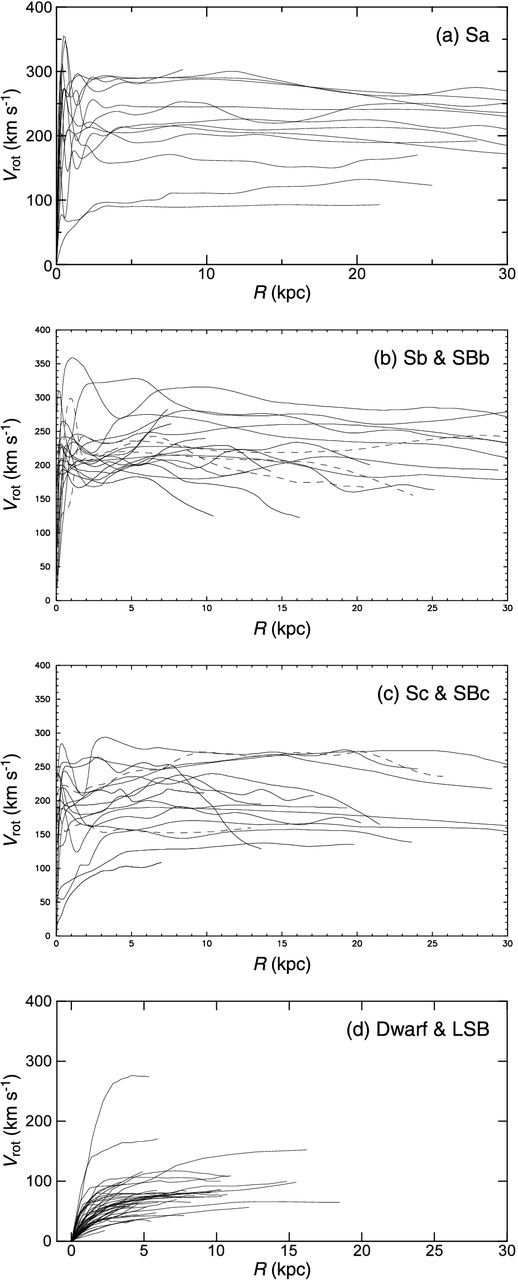 |
Figure 15. Rotation curves (RC) for Sa type galaxies (top: Noordermeer et al. 2007), Sb (full lines) and barred SBb (dashed lines) (second panel); Sc and SBc (third panel: Sofue et al. 1999), and dwarf and LSB galaxies (bottom: Swaters et al. 2009) |
Figure 14 shows examples of rotation curves of nearby spiral galaxies obtained by combining optical (mainly Hα) and radio (CO and HI) observations. There is a marked similarity of form of rotation curves for galaxies with different morphologies from Sa to Sc (figure 15). The forms may be classified into three groups: the centrally peaked, shoulder rise, and rigid-body rise types. The three types are observed mainly in massive and large-diameter galaxies, medium sized galaxies, and less massive Sc and dwarf galaxies, respectively.
3.4.2. Universal rotation curve
Massive Sa to Sb galaxies show higher central velocities than less massive Sc galaxies (figure 16). On the contrary, dwarf galaxies show slower central rise in a rigid-body fashion. Massive galaxies have universally flat rotation, while less massive galaxies show monotonically increasing rotation curve (Persic et al. 1996). The observed rotation curves may be approximated by simple function (Persic et al. 1996; Courteau 1997; Roscoe 1999), which is dependent on the luminosity and radius of a galaxy.
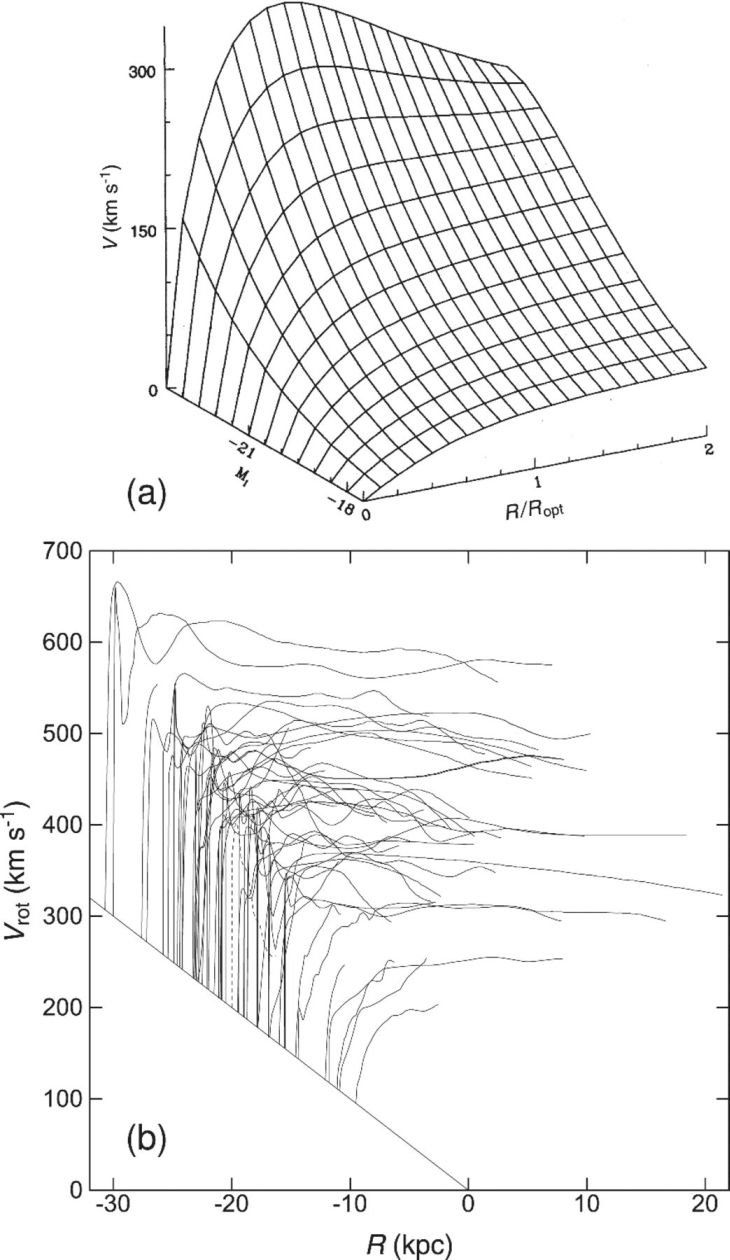 |
Figure 16. (a) Universal rotation curves obtained from 967 spiral galaxies by solid lines (Persic and Salucci 1996). (b) Observed rotation curves from figure 14 with the origins shifted according to the disk rotation velocities (averages from R = 1 to 10 kpc), approximately from Sa (top-left), Sb to Sc (bottom-right). |
3.4.3. Flatness and similarity of rotation curves
The flatness of the overall shape of entire rotation curves applies to any mass ranges of galaxies. Figure 17 shows averaged rotation curves of galaxies from the sample of Sofue et al (1999), categorized into three groups by dashed lines, one those with maximum rotation velocity greater than 250 km s−1 , and the second between 200 and 250 km s−1 , and the third slower than 200 km s−1 .
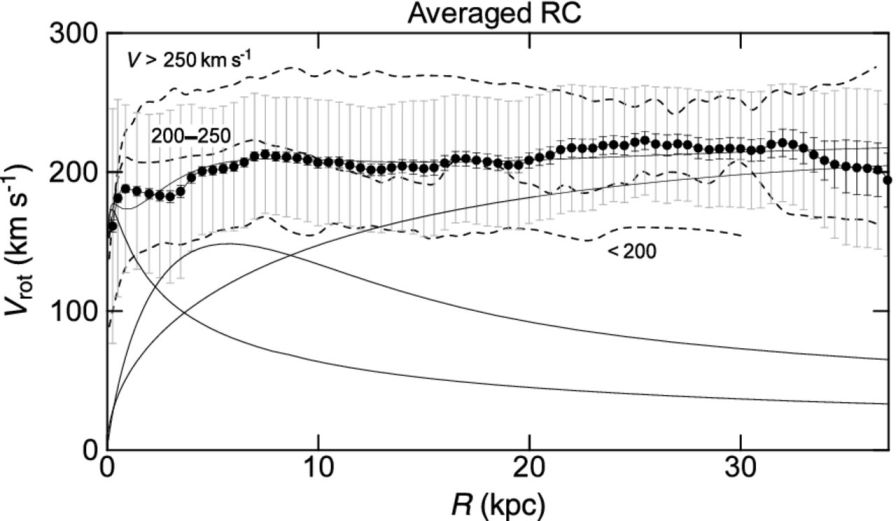 |
Figure 17. Black circles show Gaussian averaged rotation curve from all galaxies listed in Sofue et al. (1999). Long and short bars are standard deviations and standard errors, respectively. Thin lines show the least-χ2 fitting by de Vaucouleurs bulge (scale radius 0.57 kpc, mass 9.4 × 10⁹ M⊙), exponential disk (2.7 kpc, 3.5 × 10¹⁰ M⊙), and NFW dark halo (35 kpc, ρ0 = 3 × 10⁻³ M⊙ pc−3). Three dashed lines are averaged rotation curves of galaxies with maximum velocities greater than 200 km s−1 , between 200 and 250 km s−1 , and below 200 km s−1 , respectively, from top to bottom. |
The thick line shows a Gaussian averaged rotation curve of all the sample galaxies, where long and short bars denote the standard deviation and standard error of the mean value, respectively, in each radius bin at 0.5 kpc interval with Gaussian averaging width of 0.5 kpc.
3.5. Dark Halo: Grand Rotation Curves
The outermost rotation curve beyond the flat disk is still not well determined for external galaxies because of the lack in extended disk and weak emissions. In order to solve this difficulty, non-coplanar objects such as outer globular clusters and satellite galaxies have been often used to estimate the dark halo masses applying the Virial theorem.
Similarly to the Milky Way as described in section 2, orbiting satellite galaxies can be used to obtain expected circular velocities within several hundred kpc of the parent galaxy (Sofue 2013b). The technique has been applied to M31 to derive a grand rotation curve (GRC) within ∼ 300 kpc by combining disk rotation velocities and radial velocities of satellite galaxies and globular clusters. Figure 18 shows the logarithmic GRC and model fitting by bulge, disk and dark halo components (Sofue 2015a). The whole rotation curve up to ∼ 40 kpc is well represented by the pseudo-isothermal halo model (Burkert 1995), predicting a flat rotation, while the outermost region beyond 50 kpc seems to be better represented by the Navaro-Frenk-White (1996, 1997) (NFW) model (see chapter 3).
 |
Figure 18. Logarithmic rotation curve of M31. Thin lines show the least-χ2 fit by the bulge, disk and dark halo components. |
3.6. Nuclear Rotation Curves and Black Holes
Central rotation curves have been produced for a number of galaxies by a systematic compilation of PV diagrams in the Hα and CO lines (Rubin et al. 1997; Sofue et al. 1997, 1998, 1999; Bertola et al. 1998). Many spirals exhibits rapid central velocities, suggesting massive compact nuclear objects (van der Marel et al. 1994; Kormendy and Richstone 1995; Richstone et al. 1998, Bertola et al. 1998; Ferrarese 1999; Kormendy and Westpfahl 1989; Kormendy 2001).
VLBI water maser observations of the spiral galaxy NGC 4258 showed a disk of radius 0.1 pc in Keplerian rotation, indicating the first firm evidence for a massive black hole of mass of 3.9 × 10⁷ M⊙ (Nakai et al. 1993; Watson and Wallim 1994; Miyoshi et al. 1995; Herrnstein et al. 1999). Further VLBI observations of the water maser line have revealed a rapidly rotating nuclear torus of sub parsec scales in several nearby active galactic nuclei (Haschick et al. 1990; Trotter et al. 1998; Sawada-Satoh et al. 2000; Greenhill et al. 1996).
3.6.2. Logarithmic presentation
Logarithmic presentation of rotation curves is powerful to discuss the innermost dynamics in relation to the galactic structure. Figure 19 shows rotation curves of nearby galaxies and Virgo samples in logarithmic presentation. Also shown are the rotation curves of nearby galaxies with known super massive black hole, where black holes and outer rotation curves are interpolated by dashed lines. The thick line with dots and error bars are the rotation curve of the Milky Way (Sofue 2013b). The figure demonstrates that, except for the Milky Way, the resolution is not sufficient, and higher resolution observations such as using ALMA are a promising subject for the future for linking the central black hole to the galactic structure.
 |
Figure 19. Logarithmic rotation curves of nearby spiral galaxies with typical resolutions, ∼ 2−10″ (thick lines) and those from Virgo CO survey (∼ 1″, thick dashed lines), compared with the Milky Way rotation curve (circles with error bars). Thin dashed lines show NGC 224, 1068 and 4258 as interpolated with their black holes by horizontal straight lines. |
3.6.3. Effect of finite resolution
Simulation in figure 11 reveals the effect of the finite resolution on the observed PV diagram as shown. Central rotation curves derived from observed PV diagrams generally give lower limits to the rotation velocities. Angular resolution and high dynamic range are crucial for the analysis of central kinematics (Rubin et al. 1997; Sofue et al. 1998, 1999a; Bertola et al. 1998). Also crucial is the interstellar extinction in optical observations of the nuclear dusty disks. To avoid this difficulty, radio line observations, particularly the CO lines, are powerful because of the negligible extinction and high concentration in the nuclei (Sofue et al. 1999a).
3.7. Shapes of Rotation Curves and Galaxy Types
Figure 15 shows observed rotation curves of Sa, Sb, Sc and low-surface brightness galaxies. Individuality of observed rotation curves of many spiral galaxies can be explained by the difference in dynamical parameters of the bulge, disk and dark halo. Without any particular exception, the observed rotation curves can be reproduced by properly choosing the masses and scale radii of the mass components.
In each mass component of the bulge, disk and dark halo, it is known that the larger is the scale radius, the more massive is the component, and therefore the higher is the corresponding rotation velocity (Sofue 2016). This general characteristics applies to the comparison among different galaxies. Thus, the general tendency of differences of rotation curve shapes among the galaxy types can be simply attributed to their mass and size differences. Namely, earlier-type (Sa, Sb) galaxies are generally more massive and larger in size, and hence show higher rotation velocity, than later (Sc) type galaxies.
The most significant difference in the shape occurs in the central rotation curves: Sa and Sb galaxies, including the Milky Way, have high-velocity rotation near the nucleus, while Sc galaxies show slower and rigid-body like rotation in the center. This means that Sa and Sb galaxies have large and massive central bulge. On the other hand, Sc galaxies have smaller and less massive bulge.
Difference, though not so significant, appears in the outermost rotation curve: Earlier galaxies show flat or slowly declining rotation in the outermost region, while later type galaxies show monotonically increasing rotation.
Kinematics of barred galaxies is complicated due to the non-circular streaming motion superposed on the circular motion (e.g., Bosma 1981a, b). Considering that a half or more of observed galaxies exhibit bars, it is not easy to discuss particular differences of rotation curves between bar and non-bar galaxies. Rotation curves for SBb and SBc galaxies shown by dashed lines in figure 15 are not particularly distinguishable from normal galaxies.
Another effect of bars on rotation curves would be statistical underestimation of rotation velocity: Since interstellar gas is streaming along the bar (Hunter and Gottesman 1996; Buta et al. 1999; Kuno et al. 2000), observed velocities are close to rigid-body motion of the bar potential, and hence slower than circular velocity. Considering the larger probability of side-on viewing of a bar than end-on probability, simply derived rotation velocity from the radial velocities is statistically underestimated.
For barred galaxies, more sophisticated modeling of non-circular motions is inevitable based on 2D velocity measurements, such as the DISKFIT method proposed by Spekkens and Sellwood (2008) or the numerical method based on N-body simulations (Randriamampandry et al. 2015). In fact in the decade, an extensive 2D spectroscopy has been obtained for a large number of barred spiral galaxies by Fabry-Perot Hαobservations (e.g., Dicaire et al. 2008), which will further open a new era of non-axisymmetric galactic dynamics, overcoming the difficulties as raised in table 3.
3.7.3. Dwarf and low surface brightness (LSB) galaxies
Within the decades, a large number of low surface brightness (LSB) galaxies have been found (Schombert and Bothun 1988; Schombert et al. 1992). Dwarf and LSB galaxies show slow rotation, monotonically rising until their galaxy edges (de Blok et al. 1996, 2001; de Blok 2005; Swaters et al. 2000, 2001, 2009; Carignan and Freeman 1985; Blais-Quellette et al. 2001; Noordermeer et al. 2009; figure 15). Blue compact galaxies also show that rotation curves rise monotonically to the edges of the galaxies (Östlin et al. 1999). Also, dwarfs with higher central light concentrations have more steeply rising rotation curves, similarly to spirals.
Observations show that the mass-to-luminosity (M/L) ratio of dwarfs and LSB is usually higher than that normal spirals, indicating that they are more dark matter dominant than normal spirals (Carignan 1985; Jobin and Carignan 1990; Carignan and Freeman 1985; Carignan and Puche 1990a, b; Carignan and Beaulieu 1989; Puche et al. 1990, 1991a, b; Lake et al. 1990; Broeils 1992; Blais-Ouellette et al. 2001; Carignan et al. 2006).
3.7.4. Interacting and irregular galaxies
Rotation curves for irregular and interacting galaxies are not straightforward. Some irregular galaxies exhibit quite normal rotation curves, whereas some reveal apparently peculiar rotations. Hence, it is difficult to deduce a general law property to describe the curves, but individual cases may be studied in case by case. We may raise some examples below.
The Large Magellanic Cloud is the closest dwarf galaxy interacting with the companion Small Magellanic Clouds and the parent Milky Way. Despite of the strong gravitational interaction, the rotation curve is nearly flat at ∼ 100 km s−1 (Kim et al. 1998). The dynamical center inferred from the kinematical center is displaced from the optical center of the bar center, suggesting a massive component that is not centered by a stellar bulge. The dark bulge suggests an anomalously high M/L ratio in the dynamical center (Sofue 1999).
The peculiar galaxy M51 (NGC 5194) interacting with the companion NGC 5195 exhibits an anomalous rotation curve, which declines more rapidly than Keplerian in the outer disk (figure 20). Even counter rotation is observed in the outermost HI ring (Rots et al. 1990; Appleton et al. 1986). Kinematics of M51 has been observed at various wavelengths, which all indicates the rotation anomaly. This apparent rotation anomaly is explained by the warping of galactic disk, assuming that the galaxy has intrinsically normal flat rotation curve (Oikawa and Sofue 2014). Figure 20 shows a calculated warping of the disk for a given normal rotation curve, where the disk is nearly flat and then bends at r = 7.5 kpc steeply.
 |
Figure 20. [Top] Anomalous rotation curve of M51 showing faster decrease than Keplerian beyond 8 kpc followed by apparent counter rotation, compared with averaged rotation curve of spiral galaxies. [Bottom] Warped disk calculated for rotation curve assuming a universal rotation. The line-of-sight is toward top. (Oikawa and Sofue 2014) |
The peculiar galaxy M82 is a companion to the giant spiral M81. It shows an exceptionally peculiar rotation property. It has a normal steep rise and high rotation near the center, but it exhibits a significantly declining rotation, obeying the Keplerian law beyond the peak. This can be well explained and modeled by tidal truncation of the outer disk and dark halo by the close encounter with the massive parent galaxy M81 (Sofue 1992).
3.7.5. Activity and rotation curves
Active galaxies like starburst galaxies, Seyferts, LINERs, and those with nuclear jets appear to show no particularly peculiar rotation. Even such an active galaxy like NGC 5128 (Cen A) shows a rotation curve similar to a normal galaxy (van Gorkom et al. 1990). The edge on galaxy NGC 3079 has strong nuclear activity and is associated bipolar lobes in radio continuum and ionized and high-temperature gases. However, its rotation properties are quite normal with very high central velocities (Sofue and Irwin 1992; Irwin and Sofue 1992).
While these galaxies show a steep central rise of rotation curve, it is not peculiar, but generally observed in normal massive galaxies without any pronounced activity. Thus, the global rotation and mass distribution of galaxies having activity are considered to be normal. This means that the nuclear activity is not directly produced by the fundamental dynamical structure, but is caused by more temporal dynamics and/or ISM phenomena in the central deep gravitational potential, such as a sudden inflow triggered by intermittent feeding of circum nuclear gas and stars.
3.8. Statistical Properties of Rotation Curves: Tully-Fisher Relation
Rubin et al. (1985) used their synthetic rotation curves to derive dynamical masses interior to the Holmberg radius (R25) of spiral galaxies, and showed a clear correlation with the H-band infrared luminosity. Instead of the total dynamical mass, the maximum rotation velocity at a few galactic-disk scale radii was shown to be related to the luminosity, as observed as one-half the velocity width of an integrated 21 cm HI line velocity profile. The relation is called the Tully-Fisher relation (Tully and Fihser 1977; Aaronson and Mould 1986; Mathewson et al. 1992, 1996; Masters et al. 2008, 2014), and is one of the major tools to derive intrinsic luminosities of distant galaxies for measurement of the Hubble constant.
3.9. High Redshift Rotation Curves
Rotation and dynamics of high-redshift galaxies at cosmological distances are one of the major subjects in the new era of sensitive observations in the 21st century. Rotation curves of sub-z (z < 1) galaxies had been observed already in the decades (Simard and Prichet 1998; Kelson et al. 2000; Vogt et al. 1993, 1996, 1997). However, the modern era of higher redshift rotation curves was opened in this century.
Erb et al. (2003) used Keck I, II telescopes and VST to obtain near-infrared slit spectra for 16 star forming galaxies at z = 2 to 3. Referring to archival HST images, they obtained rotation curves for six galaxies. Although the angular resolution ∼ 0″.5, corresponding to ∼ 5 kpc, was not sufficient to resolve the details, the rotation velocities of 100 to 200 km s−1 have been observed, and the mean dynamical mass of the galaxies were shown to be greater than 4 × 10¹⁰ M⊙.
Genzel et al. (2008, 2011) obtained 2D Hα velocity fields for star forming galaxies at z = 2−3, obtaining rotation curves along the major axis for several objects. There is an increasing number observations of galaxies at z ∼ 1−3 in near-infrared spectroscopy using the Hubble Space Telescope and large aperture telescopes (Epinat et al. 2012; Law et al. 2009; Robertson and Bullock 2008; van der Wel and van der Marel 2008; Shapiro et al. 2008).
The rotation curve for BzK 6004 at z = 2.387 (Genzel et al. 2011) shows already similar rotation property to those in the nearby galaxies. Distant galaxies so far observed at redshifts z < 3 appear to show no particular difference in rotation curve shapes and velocities from those of nearby galaxies. This may imply that the dynamical structure of spiral galaxies at the present time were already reached at these redshifts. Higher resolution rotation curves at higher redshifts would be crucial to investigate dynamical evolution of disk galaxies and their merging processes.
However, the inner rotation curves of high-redshift galaxies are still not precise enough to be compared with those of nearby galaxies. This is mainly due to the beam-smearing effect caused by the limited angular resolution of the instruments. This effect usually results in milder rise and slower velocity of rotation in the inner and nuclear regions of the galaxies, as well as in higher velocity dispersion, than the true values. It may be remembered that the angular resolution of 0.01″ achieved by the current optical/infrared/sub-mm instruments corresponds to linear resolution of only ∼ 200 pc at z > 2 or at distances greater than several billion pc.