

4.2.3. Galactic Scales
Mass distributions and predicted rotation curves
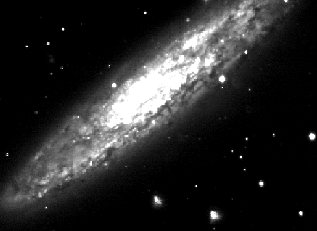
Figure 4-2 shows an image of a typical edge-on
spiral galaxy where the
thin disk and central bulge concentration are evident.
If the distribution of light traces the
distribution of mass, then we would expect a high mass concentration
that corresponds with the bulge light. In that case, the galaxy
is similar to the point mass approximation that governs solar
system orbits. From the Virial Theorem,
Vc2
 M / R
and hence orbital velocity should decline as R-1/2.

|
Figure 4-2: CCD image of the nearly edge-on spiral NGC 253 taken by the Author. Note the relatively thin disk and bright central light concentration. |
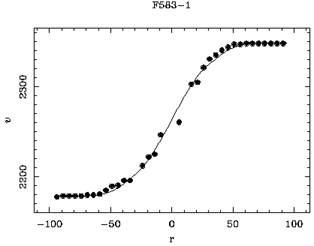
Rotation curves of galaxies were first systematically studied by Vera Rubin and her colleagues starting in the late 60's. Those initial observations showed that no spiral galaxies exhibited a rotation curve which scaled as R-1/2. Instead, rotation curves were mostly flat with R. A typical rotation curve for a spiral galaxy is shown in Figure 4-3. These data show that the point mass approximation is invalid and another form for the potential is necessary.

|
Figure 4-3: Typical optical rotation curve for a disk galaxy that shows a sharp rise and then a relatively flat region out to the optical radius. Data courtesy of E. de Blok. |
The luminosity profiles of disk galaxies exhibit an exponential fall off. Does this provide a clue to the form of the potential? If the mass distribution is also exponential then we have

| (11) |
For this exponential mass distribution there is some value of R which maximizes this expression

| (11a) |
This equation can be solved numerically to show that
the maximum rotational velocity occurs at Rmax
 2.2rh.
Strictly speaking, this result is only valid for the case of
a spherical distribution of mass. The case of a flattened distribution,
however, yields a similar value for Rmax and a peak
rotational
velocity which is 15% higher than the case of the exponential sphere
(see Figure 2-17 in Binney and Tremaine).
For the general case of a rotating system where the virial theorem applies, the mass enclosed in some radius, r is given by equation 6f. For the point mass approximation, vc goes as R-1/2 and there is no dependence of M(r) on r. Flat rotation curves indicate that vc is not a function of r and hence M(r) increases with scale. Since galaxies are obviously finite in mass, there must be a limit to this increase. Moreover, the light profile of galaxies decreases in intensity as r increases. Hence flat rotation curves demand the presence of an extended mass distribution which is not reflected in the light distribution. This extended mass distribution is generally assumed to be in the form of a spherical halo. In the derivation of the dynamical friction timescale (see Chapter 3) we made use of a specific halo density distribution. This density distribution again is

| (12) |
Since M(r) = vc2 r / G then dM(r) / dr = vc2 / G so that

| (12a) |
For this halo we also specify M(r) goes as
<  >R3.
Substituting this into equation 12a recovers equation 6f.
The kind of potential that can give rise to the density distribution given in equation 12 is often called an isothermal sphere. In order to achieve a balance between outward pressure and inward gravity, an isothermal sphere must satisfy the equation of hydrostatic equilibrium

| (13) |
For an ideal gas composed of one particle of mass m,
p = nkT and
 = nm. Therefore

| (14) |
where T is the constant Temperature. The usual way to
solve this differential equation is to multiply both sides by
r2 /
 and differentiate each side with respect to r. Since this
is a sphere then M(r) = 4/3
  r3
r3  and dM(r) / dr = 4
 r2
r2  we have

| (15) |
For this differential
equation we can try a solution of the form
 = Cr-n.
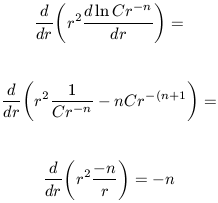
For the left hand side we have:

| (16) |
The right hand side is

| (16a) |
which is solved as

| (16b) |
Hence 
 r-2 gives
rise to a potential
in which vc is not dependent on r. In general,
the power law exponent
in the density distribution does not have to be -2 to produce a flat
rotation curve and the generalized halo density profile is

| (17) |
where  (0)
is the central mass density and rc is
the core radius of the halo. A well-defined rotation curve, in which
the luminous contribution to the mass distribution has been accounted
for, can constrain
 (0),rc
and n.
Observational Evidence for Flat Rotation Curves
The unambiguous identification of
rotation curves in which vc does not decline as a
function of r
provides very powerful evidence for the presence of a mass distribution
that is like an isothermal sphere.
For the case of an exponential mass distribution, the
surface brightness at Rmax is down by approximately 2.5
mag arcsec-2 relative to µ(0). For a typical disk
galaxy this corresponds to a mean blue surface brightness level of
 24.0 mag arcsec-2, which is 1.5 mag fainter than the sky.
This makes detection of stellar absorption lines and the subsequent
determination of stellar rotational velocities at that radius
very difficult. Without data beyond R
 2.5 rh,
flat rotation
curves by themselves do not provide good evidence for an extended halo mass
distribution that dominates the disk dynamics. The data is still
consistent with a simple exponential mass distribution. To make
further progress requires the construction of rotation curves
that reached well beyond 2.5 rh using one of the following
techniques:
 Using optical emission lines
as the velocity tracer: These
lines usually arise from the ionization of hydrogen by hot stars.
If there is sufficient star formation in some spiral galaxy at
r
  2.5 rh,
then that galaxy's rotation curve will provide
a good check on the existence of an extended mass distribution.
In general, there are few spirals that have such an extended region
of star formation. Observations of about 100 such objects by
Schommer et al. (1993) have revealed a mixed collection of rotation
curves. Some are flat, some are still rising at the last measured
point and some are falling which indicates and end to the mass
distribution. Figure 4-4 shows some examples
of these kinds of rotation
curves. This data is consistent with an extended halo
mass distribution but not conclusive.
Conference proceedings of the late 70's and early 80's often contain
a lively debate on the existence of dark halos around spiral galaxies.
At this time, there were about 30 rotation curves of high quality
but few were measured at points greater than 3rh - hence
a lively debate fueled by the paucity of relevant data. In the mid
80's, radio interferometers such as the Westerbork Array and the
Very Large Array in New Mexico, begin to make good two dimensional
maps of the distribution of atomic hydrogen in spiral galaxies. Prior
to these observations it had been well established that many late
type spiral galaxies showed evidence for extended gas distributions
relative to the stellar distribution. In some cases, the gas distribution
could be measured out to a radius of
 10rh. Measurements
of the extended neutral hydrogen distribution in many spiral galaxies indicated
flat rotation curves over scales of 5-10rh. To date
this remains
the strongest evidence for the existence of extended dark matter halos
although there are two important caveats:
 The self-gravity of the gas
in these extended distributions
can not be ignored in constructing a mass model. Consideration of this
has important implications on the measured value of rc.
 This result can not strictly
be generalized to other galaxies because
it is possible that the only galaxies which still have extended
gas distributions are also ones which have extended halos.