Copyright © 1994 by Annual Reviews. All rights reserved
| Annu. Rev. Astron. Astrophys. 1994. 32:
371-418 Copyright © 1994 by Annual Reviews. All rights reserved |
The data and analyses described above, combined with other astrophysical data, can help us evaluate some of the basic hypotheses laid out in the Introduction.
If the CMB defines a standard cosmological frame then the established
Heliocentric dipole pattern of  T / T = (1.23 ± 0.01) x
10-3 is a direct measurement of peculiar velocity of the LG:
V(0) = 627 ± 22 km s-1 towards
(l, b) = (276° ± 3°, +30° ± 3°)
(Kogut et al. 1993).
The Copernican hypothesis then implies
that large peculiar velocities exist in general, and the question
is only how coherent are they. A more esoteric interpretation
tried to explain the CMB dipole by a horizon-scale gradient in entropy,
relic of bubbly inflation, which can be made consistent with the
smallness of the quadrupole and the achromaticity of the dipole (e.g.
Gunn 1989;
Paczynski & Piran 1990). In
addition to the general objection to
global anisotropy based on the simplicity principle of Occam's razor, a
non-velocity interpretation fails to explain the fact that the
gravitational acceleration vector at the LG, g(0), as inferred from
the galaxy distribution in our cosmological neighborhood
(Section 8.1), is
within 20° of V(0) and of a similar amplitude of several
hundred km s-1 for any reasonable choice of
  . This argument in
favor of the reality of V(0) and the standard GI picture is
strengthened by the fact that a similar g(0) is obtained from the
POTENT mass field derived from velocity divergences in the neighborhood
(Kolatt et al. 1994).
The measurements of CMB fluctuations on scales
 90° are independent of
the local streaming motions, but GI predicts an intimate relation between them.
The CMB fluctuations are associated with fluctuations in gravitational
potential, velocity and density in the surface of last scattering at
z ~ 103, while similar fluctuations in our
neighborhood have grown by gravity to produce the
dynamical structure observed.
The comparison between the two is therefore a crucial test for GI.
Before COBE, the streaming velocities were used to predict
the expected level of CMB fluctuations.
The local surveyed region of ~ 100 h-1Mpc corresponds to a
~ 1° patch on the last-scattering surface.
The major effect on scales > 1° is the
Sachs-Wolfe effect (1967), where
potential fluctuations
 g induce temperature
fluctuations via gravitational redshift,
  T / T =
 g / (3c2).
Since the velocity potential is proportional
to
  g in the linear
and quasi-linear regimes,

 g is ~ V x,
where x is the scale over which the bulk velocity is
V. Thus,
  T /
T ~ V x / (3c2).
A typical bulk velocity of ~ 300 km s-1 across ~ 100
h-1Mpc corresponds to
  T / T ~ 10-5 at ~ 1°.
If the fluctuations are scale-invariant (n = 1),
then
  T / T ~
10-5 is expected on all scales > 1°.
Bertschinger et al.
(1990) produced a
  T / T map
of the local region as seen by a distant observer, and predicted
 T / T ~
10-5 from the local potential well associated with
the GA. Now that CMB fluctuations of
  10-5 have been detected
in the range 1°-90° (e.g.
Smoot et al. 1992;
Schuster et al. 1993;
Cheng et al. 1993), the
argument can be reversed: if one assumes GI then the expected
bulk velocity in the surveyed volume is ~ 300 km s-1, i.e. the
motions are real. If, alternatively, one accepts the velocities as real,
then the CMB-POTENT agreement is a relatively
sensitive test of GI, truly addressing the specific time-evolution of
structure predicted by GI.
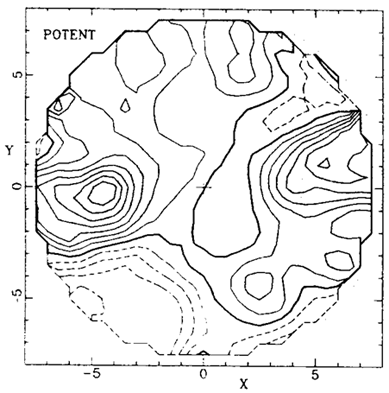
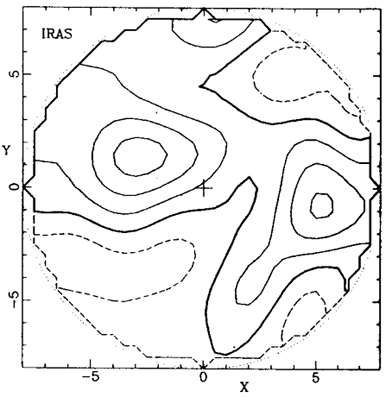
The theory of GI plus the assumption of linear galaxy biasing predict a correlation between the dynamical density field and the galaxy density field, which can be addressed quantitatively based on the estimated errors in the two data sets. Figure 5 compares density maps in the Supergalactic plane for IRAS 1.2 Jy galaxies and POTENT Mark III mass, both Gaussian smoothed with radius 12 h-1Mpc. The correlation is evident - the GA, PP, Coma and the voids all exist both as dynamical entities and as structures of galaxies. A quantitative comparison of these new data is in progress, but so far an elaborate statistical analysis (Dekel et al. 1993) has been applied only to the earlier POTENT reconstruction based on Mark II data and IRAS 1.9 Jy survey. Noise considerations in POTENT limited that analysis to a volume ~(53 h-1Mpc)3 containing ~ 12 independent density samples. Monte-Carlo noise simulations showed that the POTENT density is consistent with being a noisy version of the IRAS density, i.e. the data are in agreement with the hypotheses of GI plus linear biasing.

|

Figure 5. POTENT mass versus IRAS galaxy density fields in the Supergalactic plane, Gaussian smoothed with radius 12 h-1Mpc. Contour spacing is 0.2 (Dekel et al. 1993). |
What is it exactly that one can learn from the observed correlation (Babul et al. 1994)? First, it is hard to invoke any reasonable way to make the galaxy distribution and the TF measurements agree so well unless the velocities are real (H6), provided that IM bias has been properly corrected (Sections 3.2 and 4.4). Then, it is true that gravity is the only long-range force which could attract galaxies to stream toward density concentrations, but the fact that this correlation is predicted by GI plus linear biasing does not necessarily mean that it can serve as a sensitive test for either. Recall that converging (or diverging) flows tend to generate density hills (or valleys) simply as a result of mass conservation, independent of the source of the motions.
Let us assume for a moment that galaxies trace mass, i.e., the linearized
continuity equation,  dot
= -
 · v,
is valid for the galaxies
as well. The observed correlation means
 -
- · v, and
together they imply that
  dot
dot 
 , or equivalently
that
  · v
is proportional to its time average. This property is not
exclusive to GI; one can construct a counterexample
where the velocities are produced by a non-GI impulse. Even
irrotationality does not follow from
 -
- · v; it
has to be adopted based on theoretical arguments in order to enable
reconstruction from radial velocities or from observed densities.
Once continuity and irrotationality are assumed, the observed

 -
- · v implies a
system of equations which is
identical in all its spatial properties to the equations of GI,
but can differ in the constants of proportionality and their
temporal behavior. It is therefore impossible to distinguish between GI and
a non-GI model which obeys continuity plus irrotationality
based only on snapshots of present-day linear fluctuation fields.
This makes the relation between CMB fluctuations and velocities
an especially important test for GI. On the other hand, the fact that
the constant of proportionality in

 -
- · v is indeed
the same everywhere is
a non-trivial requirement from a non-GI model. A version of
the explosion scenario
(Ostriker & Cowie 1981;
Ikeuchi 1981), which
tested successfully both
for irrotationality and v -
  correlation, requires certain synchronization among the
explosions (Babul et al. 1994).
While the sensitivity of the v -  relation to GI is
only partial, this relation turns out to be
quite sensitive to the validity of a continuity-like relation
for the galaxies; when the latter is strongly
violated all bets are off for the v -
  g relation. A
non-linear biasing scheme
would make continuity invalid for the galaxies, which
would ruin the v -
  g relation even if GI is valid. The observed
correlation is thus a sensitive test for density biasing. It
implies, subject to the errors, that the ~ 10 h-1Mpc-smoothed
densities of galaxies and mass are related via a simple, nearly linear
biasing relation with b not far from unity.
A priori, it is possible that the inferred motions are just a reflection of systematic variations in the distance indicators, e.g. due to environmental variations in intrinsic galaxy properties, or in the apparent quantities due to Galactic absorption (e.g. Silk 1989; Djorgovski et al. 1989). Efforts to detect correlations between velocities and certain galaxy or environmental properties have led so far to null or at most minor detections (Aaronson & Mould 1983; Lynden-Bell et al. 1988; Burstein 1990a, 1990b; Burstein et al. 1990) - no correlation with absorption and with local galaxy density, and marginal correlations with absolute luminosity and with stellar population (Gregg 1994). Admittedly, these null results are only indicative as one cannot rule out a correlation with some other property not yet tested for.
Qualitative comparisons of the velocities of ellipticals (Es) and
spirals (Ss) indicated general agreement
(Burstein et al. 1990),
and now the Mark III data enable a quantitative comparison
at the same positions
(Kolatt & Dekel 1994a).
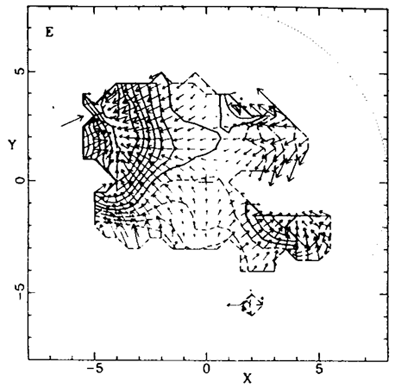
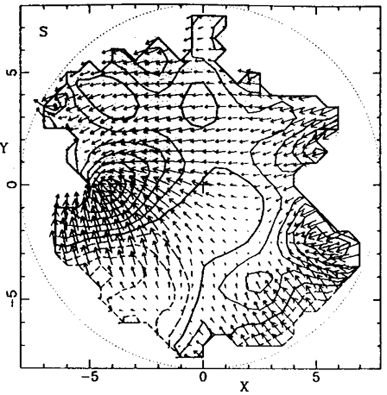
Figure 6 compares the two
fields as derived independently by POTENT, showing a general resemblance.
The radial velocities of each type were
interpolated into a smoothed field u(x) on a grid using
12 h-1Mpc POTENT smoothing
(Section 4.2), and then compared
within a volume limited by the poor sampling of Es to
 (50
h-1Mpc)3, containing ~ 10 independent sub-volumes.
The two fields were found to be consistent with
being noisy versions of the same underlying field, while the
opposite hypothesis of complete independence is strongly ruled out,
indicating that the consistency is not dominated by
errors. A possible discrepancy indicated earlier by the Mark II data
(Bertschinger 1991) is now gone
with the improved data and bias-correction.
The strength of this test will improve further as the E sample grows in
extent (e.g. project EFAR by
Colless et al. 1993) and
in accuracy
(e.g. the SBF method).

|

Figure 6. Ellipticals versus Spirals. Mass-density and velocity fields in the Supergalactic plane as recovered by POTENT independently for the two types. Smoothing is 12 h-1Mpc. Contour spacing is 0.2. Distances and velocities are in 1000 km s-1 (Kolatt & Dekel 1994). |
The E-S correlation is consistent with motions (H6), but it cannot rule
out environmental effects beyond making this idea less plausible. If
such effects were dominant, then the two distance indicators
would have to vary coherently, which would require that the large-scale
properties of the environment be
different from the local properties determining the
galaxy type (E in clusters, S in field). It would also require
that the properties affecting the virial equilibrium which determines the
Dn -  relation, and those affecting the additional constraint involved in
the TF relation at galaxy formation
(Section 2.1), vary
together in space. The one quantity that could plausibly affect the two
in a correlated way is M / L, but to test for this one will have
to compare the
TF/Dn -
  velocities to those inferred from an independent indicator, e.g. SBF.
The E-S correlation is consistent with the hypothesis of GI (H4) because, following Galileo, the velocities of all test bodies in a given gravitational potential are predicted to be the same as long as they share the same initial conditions. However, the observed E-S correlation does not rule out any non-GI model where all objects obtain the same velocities independent of their type, e.g. cosmological explosions or radiation pressure instabilities (Hogan & White 1986).
A practical use of the independent derivation of u(x) for Ss and Es is in matching the zero points of the distance indicators, otherwise determined in an arbitrary way (Section 2). A 5% Hubble-like outflow has to be added to the peculiar velocities of Es from Mark II to optimally match the S data of Mark III.