


As noted earlier, there are some 20 broad, isolated emission lines, and a similar number of narrow lines, that can be measured and compared with the model calculations. Each observed line ratio conveys different information about the line emission region, and there are more than enough constrains on the models. At this stage we are only interested in integrated line intensities. Later we discuss the information obtained from line variability (chapter 8) and line profiles (chapter 9).
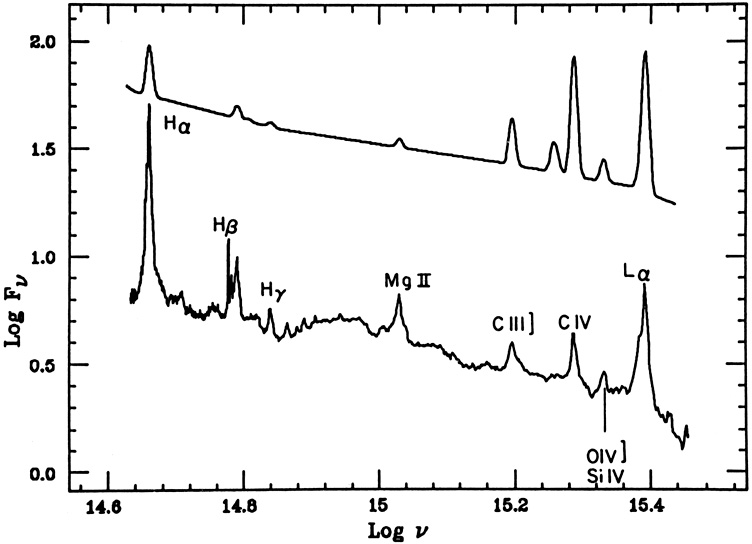
Fig. 14 shows a comparison of the composite
quasar spectrum of Fig. 2 and
the theoretical model of Fig. 11.
The calculated line intensities, up to
rout = 2 × 1018 cm, are put on
top of an artificial continuum, similar in shape to the
observed one, and normalized to give the observed
L equivalent width.
|
Figure 14. A comparison of a composite quasar spectrum (bottom) with model calculations. |
Given the uncertainty in the model parameters, the difficult radiative transfer and the unknown gas distribution, it is quite remarkable that photoionization models for the BLR, like the ones describe here, give a good overall fit to the observed spectrum. Many of the observed line ratios are reproduced by the models and can be used to deduce important physical properties. There are, however, some line ratios that badly disagree with the model predictions, suggesting that some important ingredients are still missing. Below is a brief account of the present status of the theory, and the outstanding problems in this area.
6.1.1 Resonance metal lines. The strong
ultraviolet lines of
CIV 1549,
NV1240 and
OVI1035 are
good indicators of the gas temperature and
ionization parameter. As seen from Table 1 and
Fig. 14, the calculated strength of
these lines, relative to
L, are in fairly
good agreement with the observations.
The agreement is not as good in models of smaller U, although, a
harder ionizing
continuum can compensate, somewhat, for that. It has been proposed that
optically thin BLR clouds, combined with much smaller ionization parameters,
can explain the strong high excitation lines. Such clouds are expected
to have very strong
NV1240,
OVI1035 and
HeII lines. Their contribution to the
total broad line flux is large only if their covering factor is much
greater than the covering factor of the optically thick clouds.
1549,
NV1240 and
OVI1035 are
good indicators of the gas temperature and
ionization parameter. As seen from Table 1 and
Fig. 14, the calculated strength of
these lines, relative to
L, are in fairly
good agreement with the observations.
The agreement is not as good in models of smaller U, although, a
harder ionizing
continuum can compensate, somewhat, for that. It has been proposed that
optically thin BLR clouds, combined with much smaller ionization parameters,
can explain the strong high excitation lines. Such clouds are expected
to have very strong
NV1240,
OVI1035 and
HeII lines. Their contribution to the
total broad line flux is large only if their covering factor is much
greater than the covering factor of the optically thick clouds.
The CIII]1909 /
CIV1549 line
ratio has been used, in the past, to deduce
the ionization parameter. The models presented here clearly show this line
ratio to be insensitive to the exact value of U. In fact, the
line ratio is in
good agreement with the observations over most of the range calculated, and
disagreement appears only where the contribution of lower density material
starts to dominate the spectrum.
6.1.2 Intercombination lines. Semi-forbidden
lines such as
CIII]1909,
NIII]1750,
OIII]1663 and
NIV]1486, are
weak in the inner part of the
BLR, where the density is above their critical density
( 109.5
cm-3 for
CIII]1909). Further out, where the density is lower, such lines
can be important
coolants, and the energy distribution among the different cooling agents is
changed. The presence of strong intercombination lines is a sign that the
contribution of Ne > 1010
cm-3 material to the emitted spectrum is not significant.
109.5
cm-3 for
CIII]1909). Further out, where the density is lower, such lines
can be important
coolants, and the energy distribution among the different cooling agents is
changed. The presence of strong intercombination lines is a sign that the
contribution of Ne > 1010
cm-3 material to the emitted spectrum is not significant.
6.1.3 Broad forbidden lines. With the
N  r-s, s > 0 density law considered
here, some forbidden lines, such as
[OIII]4363, are
predicted to be strong in
large r clouds, where the density drops to their critical density
( 108
cm-3).
Strong, broad forbidden lines are never observed, although there are
hints to the presence of weak, broad
[OIII]5007 in
some objects. Thus, there seems
to be a natural limit to the extent of the BLR. This may be due to the
radial
dependence of the covering factor at large r, to clouds becoming
optically thin, or to some other reasons.
r-s, s > 0 density law considered
here, some forbidden lines, such as
[OIII]4363, are
predicted to be strong in
large r clouds, where the density drops to their critical density
( 108
cm-3).
Strong, broad forbidden lines are never observed, although there are
hints to the presence of weak, broad
[OIII]5007 in
some objects. Thus, there seems
to be a natural limit to the extent of the BLR. This may be due to the
radial
dependence of the covering factor at large r, to clouds becoming
optically thin, or to some other reasons.
6.1.4 The hydrogen spectrum. The calculated
intensity of L in
the s = 2 model
(Fig. 11) increases with r
much like the predicted r5/6 dependence of (62). This
reflects, mostly, the increase in the covering factor, and suggests that
a fixed proportion of all ionizing photons are converted to
L. It resembles
the so
called "recombination Case B flux", occurring in lower density nebulae,
where each absorbed Lyman continuum photon results in the emission of a
L photon.
In AGN BLR clouds, the situation is more complicated, due to the high
density and large optical depth. However, in many models the calculated
L flux is
within a factor 2 of the simple, "Case B" value.
Despite the simple atomic configuration, the good atomic data and the big
improvements in the treatment of line transfer, the hydrogen line
spectrum of AGNs is not yet well understood. This is demonstrated in
Fig. 14 where it is evident that the calculated
H and
H lines are much weaker, relative to
L, than in the
observations. This has come to be known as the
"L /
H"
problem. It is not yet clear whether it reflects wrong physical
assumptions, the inaccuracy of the calculations or, perhaps, some reddening.
lines are much weaker, relative to
L, than in the
observations. This has come to be known as the
"L /
H"
problem. It is not yet clear whether it reflects wrong physical
assumptions, the inaccuracy of the calculations or, perhaps, some reddening.
Regarding wrong physical assumptions, there are two proposed explanations.
The first invokes a very strong, hard X-ray continuum, extending to
MeV energies, and the second, extreme column densities
( 1025
cm-2). The two are not without difficulties. A strong
X-ray- -ray
continuum is observed
only in very few AGNs (there are only very few such observations) while the
"L /
H"
problem seems to be common to most objects. There are also
problems in violating the
-ray
background if all AGNs have such a hard continuum.
Large column densities are appealing for some reasons (see below) but
the large Compton depth makes the line transfer calculations
questionable, and there are
difficulties associated with the physical size of the clouds in low
luminosity objects (chapter 8).
-ray
continuum is observed
only in very few AGNs (there are only very few such observations) while the
"L /
H"
problem seems to be common to most objects. There are also
problems in violating the
-ray
background if all AGNs have such a hard continuum.
Large column densities are appealing for some reasons (see below) but
the large Compton depth makes the line transfer calculations
questionable, and there are
difficulties associated with the physical size of the clouds in low
luminosity objects (chapter 8).
The most likely cause for inaccurate calculations is the simplified escape
probability treatment. Typical BLR clouds are expected to have huge
L and
H optical depths
( (L) ~ 108,
(H) ~ 104),
and the local nature of this
transfer method may not be adequate for such extreme conditions. Among the
present dustless models, that use as an input the typical observed
continuum, some get close to explaining the observed
L /
H ratio and some
manage to reproduce the observed Balmer decrement, but none is
successful in explaining both.
(L) ~ 108,
(H) ~ 104),
and the local nature of this
transfer method may not be adequate for such extreme conditions. Among the
present dustless models, that use as an input the typical observed
continuum, some get close to explaining the observed
L /
H ratio and some
manage to reproduce the observed Balmer decrement, but none is
successful in explaining both.
Line reddening is another possible explanation which is not without its difficulties. It is discussed in chapter 7.
6.1.5 The helium spectrum. The optical depth
in many HeI lines must be large
because of the high population of the HeI 23S
metastable level. The
HeI5876,
HeI10830 and
other HeI line intensities are likely to be affected by that, and
accurate transfer calculations are required.
To date most accurate calculations consider an up to 100 level HeI atom, with optical depth in all lines. Such a large number of levels is needed since three-body recombination is important in populating the high energy HeI levels at the BLR densities. The calculated line intensities are quite reliable, but not reliable enough to use the model helium/hydrogen line ratios to determine the helium abundance.
The calculations of the HeII spectrum are much simpler. The optical depth
in all lines, except for the Lyman series and, perhaps,
HeII1640, is small,
and the three-body recombination process is not as important as in
hydrogen. A notable problem is the
HeII304
L line, which is
a major ionization
source for hydrogen and a major fluorescence excitation source for
OIII. The
approximate methods (chapter 4) that are used
leave much to be desired and
the calculated line intensity is rather uncertain. The observation of
this line
is a major challenge of space astronomy and a real comparison with the
calculations is still to come. Another complication is the wavelength
coincidence between the hydrogen
L and the HeII
H
lines (separation of 0.498Å). This
is a potential pumping source for the HeII n = 4 level but it is
thought to be unimportant because of the small optical depth in the HeII
H
line, and
the relatively large wavelength difference, The result of the small
optical depth, and the good atomic data, is that the
HeII1640 / 4686 line ratio
is easy to calculate. This line ratio is an important reddening
indicator and its use in determining the reddening in AGN clouds is
explained in chapter 7.
6.1.6 FeII and MgII lines. The low excitation
lines of FeII and MgII are
produced in the partly neutral region of the BLR clouds. Such regions are
thought to be heated and ionized by X-ray photons. They are characterized by
Te
104K and NH0 /
NH+
10.
While MgII2798
is a relatively simple line to calculate, this is not the
case for the FeII lines, because of the extremely complicated energy level
configuration of Fe+. There are several thousand FeII
transitions to be considered,
many with a large optical depth. The atomic data for this ion is poorly
known and reliable cross sections are only starting to become available. An
additional complication is the large number of wavelength coincidences
of different FeII lines; more than 300 (!) with separation less than 10
km s-1. This is a major
population process for the levels that must be taken into account. Other
potentially important processes are the absorption of incident continuum
radiation
in FeII lines and the continuos opacity due the hydrogen n = 2 level.
The large number of FeII lines form several distinct emission bands at 2200-2600Å, 3000-3400Å, 4500-4600Å and 5250-5350Å. The strongest ultraviolet FeII lines originate from some odd parity levels with energies of ~ 5 eV above the ground. Other ultraviolet lines, out of energy levels as high as 9 eV, are also observed. Such lines are not consistent with collisional excitation at the deduced electron temperature of ~ 104K and fluorescence or some other unknown processes must be responsible for that. All this is not unique to AGNs. The same FeII lines are known to be strong in the spectrum of symbiotic stars; galactic objects with no hard X-ray continuum.
Fig. 15 demonstrates the complicated nature of
the FeII spectrum. It shows
a calculated FeII spectrum, for AGN clouds, with more than 3000 FeII lines.
There is no way to isolate most of these lines, because of their large
number and the broad line profiles. The convolution of the theoretical
spectrum with a
typical observed line profile (bottom part of the diagram) form broad,
shallow emission features that demonstrate the difficulties in measuring
the continuum luminosity, and the intensity of lines such as
MgII2798 and
H, in
spectral
regions rich in FeII lines. The conglomerations of the strong FeII
lines, the
Balmer continuum, and other spectral features, creates a noticeable energy
excess between the wavelengths of 2000 and 4000Å. This feature is
sometimes
referred to as the "small bump" and was confused, in the past, with the
underlying nonstellar continuum of AGNs.

|
Figure 15. Top: A theoretical FeII spectrum on top of a power-law continuum. Bottom: the same spectrum but lines are 4000 km s-1 gaussians. |
The FeII spectrum is one of the unsolved problems of AGN study. The total
observed strength of these lines can equal the
L intensity,
while the calculated
strength is only about 1/3 or 1/2 of that. The ratio of the optical FeII
lines
to the hydrogen Balmer lines presents a similar, or even bigger problem, and
there is also a difficulty in explaining the observed ratio of optical
FeII lines to
ultraviolet FeII lines. Suggested explanations, within the general
framework of
photoionization, include very high densities, large iron abundances and
emission
from the outer regions of central accretion disks. There was also a
suggestion of
a different model, based on the idea that the lines are formed in a
thick, warm
medium which is mechanically heated. Such models have the extra degree of
freedom of not being directly associated with the central radiation source.
6.1.7 CaII lines. These are the lowest
ionization lines observed in the spectrum
of AGNs. The strongest feature is the infrared triplet at 8498, 8542 and
8662Å.
The lines are observed in about 1/3 of all objects, while other CaII
lines, such as
the H, K and the forbidden lines near 7300Å, are weak or
absent. Theoretical
modeling shows that the internal CaII line ratios, and their strength
relative
to H,
requires very large column densities, Ncol ~
1025 cm-2. Such models
are appealing for some theoretical reasons (energy budget, to be explained
below, the L /
H
problem) but there are difficulties as well. For example, objects
with very weak CaII infrared lines are not very different,
spectroscopically, from objects with strong CaII lines. In particular,
strong CaII emitters are not very different in their
L /
H from
weak CaII emitters. If large column densities
are essential to explain both the observed
L /
H and
CaII lines in AGNs, it
is not very clear why the CaII lines are not more common. Furthermore, very
large column density clouds, with typical BLR densities, are more than
1015 cm
thick, a dimension which is of the order of the cloud-central source
separation in low luminosity AGNs (chapter 8).
6.1.8 Diffuse continua. The free-free continuum and several of the bound-free continua (Paschen, Balmer) are cavations.
6.1.9 Very high excitation metal lines. These
lines (CIII977,
OIII835 etc.)
are calculated to be strong at small r high density clouds, where
the temperature
is high due to the collisional suppression of other cooling agents, such as
CIV1549. The
lines are weak or unobserved in most AGN spectra which is
another argument against having a large contribution from very high density
clouds to the broad-line spectrum.
6.1.10 Small dense BLR. Some gas clouds may survive in the innermost part of the BLR, where the radiation field is most intense. These must have very high densities (~ 1012 cm-3) since low density material will not achieve thermal equilibrium at this environment (chapter 9). The clouds may be associated with the inflow of gas from the BLR, or perhaps produced near the central black hole. At such high densities the gas must be close to thermal equilibrium, most cooling is via bound-free and free-free emission and no line emission is likely to be important. The clouds are therefore reprocessing the central continuum radiation, absorbing it at some frequencies and re-emitting in others. The resulting spectrum can resemble, in some ways, the spectrum of a thin accretion disk, showing a "blue bump" in optical and ultraviolet energies and a strong edge at the Lyman limit. Currently there are too few observational constraints, and too many theoretical uncertainties, to put this idea into a serious observational test.