

4.4.2. X-ray images of clusters and the morphology of the intracluster gas
A tremendous increase in our understanding of the distribution of the X-ray emitting gas in clusters has come about through imaging of the two-dimensional X-ray surface brightness. The launch of the Einstein X-ray observatory satellite made it possible to image X-ray clusters routinely, although a rocket-borne X-ray mirror was used to image the X-ray emission from the Coma, Perseus, and M87/Virgo clusters prior to the launch of Einstein (Gorenstein et al., 1977, 1978, 1979). The results of the X-ray imaging observations of clusters have been extensively reviewed recently by Forman and Jones (1982).
Forman and Jones (1982; also Jones et al., 1979, and Jones and Forman 1984) propose a two-dimensional classification scheme for the X-ray morphology of galaxies, which they relate to the evolutionary state of the cluster as determined by its optical properties (Section 2.9, 2.10). This scheme is presented in Table 3, which is taken in large part from Forman and Jones (1982). In Figure 17 the X-ray surface brightness distributions from the Imaging Proportional Counter (IPC) on the Einstein X-ray observatory are shown for representative examples of clusters of each morphological type. The X-ray brightness distribution is shown as a contour plot, in which the lines are loci of constant X-ray surface brightness. The contours are superimposed on optical photographs of the cluster for comparison.

|
Figure 17. The X-ray morphology of several clusters of galaxies from Jones and Forman (1984). Contours of constant X-ray surface brightness are shown superimposed on optical images of the clusters. (Top left), the prototypical irregular nXD cluster A1367. (Top right), the irregular XD cluster A262. (Bottom left), the regular nXD cluster A2256. (Bottom right), the regular XD cluster A85, showing the X-ray emission centered on the cD galaxy. |
First of all, Forman and Jones classify the clusters as being irregular
('early')
or regular ('evolved'), based on their overall X-ray distribution. The
early clusters
have irregular X-ray surface brightnesses, and often show small peaks in the
X-ray surface brightness, many of which are associated with individual
galaxies
in the cluster. Their X-ray luminosities Lx and X-ray
spectral temperatures Tg
are low. Optically, these clusters tend to be irregular clusters
(Table 1). That is,
they have irregular galaxy distributions with subclustering and with low
central concentration. They are not generally very rich, and tend to be
Bautz-Morgan types II to III and Rood-Sastry types F and I. They generally
have low velocity dispersions
 r. They are
often, but not always, spiral rich.
On the other hand, the evolved clusters have regular, centrally condensed X-ray structures (Forman and Jones, 1982). The X-ray distribution is smooth, and X-ray emission peaks are not found associated with individual galaxies, except possibly with a central dominant galaxy at the cluster center. The evolved clusters have high X-ray luminosities and gas temperatures. Optically, these are regular, symmetric clusters, generally of Bautz-Morgan type I to II and Rood-Sastry types cD, B, L, or C. They are rich and have a high central concentration of galaxies. They have high velocity dispersions and are spiral poor in their galaxy composition.
The second determinant of the X-ray morphology of clusters is the presence
or absence of a central, dominant galaxy in the cluster. The X-ray
emission from
a cluster tends to peak at the position of such a galaxy. Clusters
containing such central dominant galaxies are classified by
Forman and Jones (1982)
as X-ray
dominant (XD); those without such a galaxy are classified as non-X-ray
dominant (nXD). The nXD clusters have larger X-ray core radii
rx  500 / h50
kpc. There is no strong X-ray emission associated with any individual
galaxy in these systems.
The XD clusters have small X-ray core radii rx
 250 /
h50 kpc. The X-ray
emission is strongly peaked on the central dominant galaxy. In many cases,
spectral observations indicate that gas is cooling in this central peak
and being accreted onto the central galaxy
(Sections 4.3.3 and
5.7). The data of
Jones and Forman (1984)
suggest that all cooling flows are centered on the dominant
galaxies in XD clusters. Regular XD clusters have, on average, the
highest X-ray luminosities of any clusters
(Forman and Jones, 1982;
Jones and Forman, 1984).
Examples of irregular nXD clusters include A1367 (Jones et al., 1979; Bechtold et al., 1983), A194 (Forman and Jones, 1982), A566 (Harris et al., 1982), and A2069 (Gioia et al., 1982). A1367, which is shown in Figure 17a, is the prototype of this class.
Virgo/M87 is the prototype of the irregular XD clusters, of which A262 (Forman and Jones, 1982), A347 (Maccagni and Tarenghi, 1981), A2147 (Jones et al., 1979), and A2384 (Ulmer and Cruddace, 1982) are also members. Figure 17b shows the X-ray image of A262.
Regular nXD clusters probably include Coma (A1656; Abramopoulos et al., 1981; see Figure 19 below) A576 (White and Silk, 1980), A1763 (Vallee, 1981), A2255, A2256 (Jones et al., 1979; Forman and Jones, 1982), and CA0340-538 (Ku et al., 1983). Figure 17c shows the X-ray image of A2256. Although the statistics are poor, it appears that clusters with radio halo emission (see Section 3.4) are primarily of this class.
The regular XD clusters include Perseus (A426, Branduardi-Raymont et al., 1981; Fabian et al., 1981a), A85, A1413, A1795 (Jones et al., 1979), A478 (a href="Sarazin_refs.html#685" target="ads_dw">Schnopper et al., 1977), A496 (Nulsen et al., 1982), A2029 (Johnson et al., 1980), A2218 (Boynton et al., 1982), and possibly A2319 (White and Silk, 1980). Figure 17d shows the X-ray image of the cD cluster A85.
The prototypes of each of these classes (A1367, Virgo/M87, Coma, and Perseus) are discussed individually in Section 4.5 below.
Forman and Jones (1982) and Jones et al. (1979) argue that this classification scheme represents a sequence of cluster evolution, just as the sequence of cluster optical morphology (Section 2.5) was related to the dynamical evolution of the cluster in Section 2.9. Specifically, the evolution of the overall cluster distribution may be due to violent relaxation during the collapse of the cluster. This occurs on the dynamical time scale of the cluster, which depends only on its density (equation 2.32). On the other hand, the formation of central dominant galaxies may be due to mergers of galaxies; as demonstrated in Section 2.10.1, this mechanism favors compact but poor regions. Thus, while both a regular overall distribution of a cluster and the presence of a central dominant galaxy may indicate that the cluster has undergone dynamical relaxation, the processes are different and depend in different ways on the size and mass of the region. This provides a possible qualitative explanation for this two-dimensional classification system of X-ray morphology.
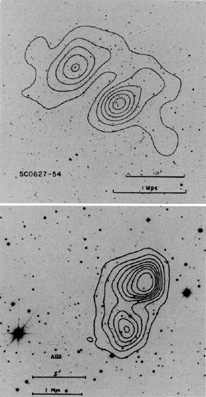
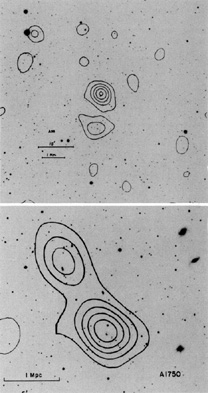
Double peaked X-ray emission has been seen in a number of clusters, of which the best studied example is A98 (Henry et al., 1981; Forman et al., 1981). Other possible examples include A115, A1750, SC0627-54 (Forman et al., 1981), A1560, A2355 - A2356 (Ulmer and Cruddace, 1982), A982, A2241 (Bijleveld and Valentijn, 1982), CA0329-527 (Ku et al., 1983), and possibly A399 / 401 (Ulmer et al., 1979; Ulmer and Cruddace, 1981) and A2204 - 2210 (Ulmer et al., 1985). In Figure 18, the X-ray distributions are shown for four double clusters observed by Forman et al. (1981). In most of these systems, the galaxy distribution is also double peaked (Dressler, 1978c; Henry et al., 1981; Beers et al., 1983), and the two peaks correspond to slightly different radial velocities (Faber and Dressler, 1977; Beers et al., 1982). The small velocity differences indicate that the two subclusters are bound, and would be expected to collapse together and merge in a time of typically a few billion years.

|

|
Figure 18. The X-ray surface brightness in four double clusters, from Forman et al. (1981). Contours of constant X-ray surface brightness are shown superimposed on optical images of the clusters. |
These double systems may represent an intermediate stage in the evolution
of clusters from irregular to regular distributions
(Tables 1 and
3). In
fact, numerical N-body simulations of cluster formation often show an
intermediate bimodal stage to the galaxy distributions (see
Figure 5c;
White, 1976c;
Ikeuchi and Hirayama,
1979;
Carnevali et al.,
1981).
With the
current (rather poor) statistics, the fraction of clusters detected in this
double phase ( 10%) is
consistent with the relatively short lifetime of the phase.

|
Figure 19. The X-ray surface brightness of the Coma cluster of galaxies from the IPC on Einstein, kindly provided by Christine Jones and Bill Forman. Contours of constant X-ray surface brightness are shown superimposed on the optical image of the cluster. |
In the irregular and double clusters, the gas distribution is correlated with the galaxy distribution. The gas is probably roughly in hydrostatic equilibrium with the cluster gravitational potential (Section 5.5), which is primarily influenced by the distribution of the dynamically dominant missing mass component (Section 2.8). The fact that the X-ray surface brightness and galaxy distribution correlate suggests that the galaxies and the missing mass have a similar distribution in clusters; other evidence favoring this viewpoint was given in Section 2.8.