


2.2. Sample Selection
2.2.1. Available Ground- and Space-based Observations
In selecting our galaxy sample we aimed to take advantage of as much pre-existing ground- and space-based UV, optical and near-IR images as possible. In particular, high priority was given to galaxies that have been observed with UIT in the far-UV (1500Å) and obeyed the SB and size criteria (Section 2.1.2 and Section 2.1.3). Some of these galaxies are close to the UIT detection limit, as they are minor members in galaxy groups targeted by UIT.
Also, nearby galaxies already observed with HST/WFPC2 in the mid-UV F300W and/or F255W filter that match our criteria will be included in our final sample. When the final Cycle 9 target list was compiled in early 2000, the HST Archive contained 15 such galaxies with F300W images obtained and two more imaged in F255W. These Archival observations came primarily from Cycle 4 program GO 5381 (PI: Koratkar) and Cycle 6 program GO 6355 (PI: Giavalisco). We will analyze these 17 Archival mid-UV images in a separate paper (Taylor et al. 2002, in preparation). The current Cycle 9 sample is designed and must be understood to be complementary to this existing Archival sample.
Over the last decade, several of us have systematically imaged from the ground a total of about 750 nearby galaxies covering all Hubble types and inclinations. The majority of these galaxies - which includes most of the galaxies imaged in the far-UV with UIT (primarily at 1500Å) - were observed in UBVRI, but a good fraction was observed in the near-IR JHK filters as well (Eskridge et al. 2002b). The data base thus compiled consists of seven individual galaxy samples:
(1) 86 face-on spiral galaxies of de Jong & van der Kruit (1994);
(2) 220 galaxies with Hubble types later than S0 from the OSU BVRJHK survey (Frogel et al. 1996; Eskridge et al. 2000, 2002b) (all inclinations);
(3) 113 galaxies from the Frei et al. (1996) survey in B and R, to which we added U and V-band images (good number of early-type galaxies; all inclinations; Taylor et al. 2002; in prep.);
(4) 100 galaxies with 1500Å and 40 with 2500Å images from the Astro/UIT mission (Kuchinski et al. 2000; Marcum et al. 2001) (all inclinations);
(5) 48 edge-on galaxies (de Grijs & Peletier 1997; de Grijs, Peletier, & van der Kruit, 1997);
(6) 150 late-type UGC galaxies selected to be morphologically irregular, peculiar, or merging (Hibbard & Vacca 1997; Hibbard et al. 2002). These have a range of impact parameters (i.e., the distance between the two interacting or colliding objects); and
(7) 49 late-type dwarf spiral galaxies (Matthews & Gallagher 1997) and compact, high-SB luminous blue galaxies (Gallagher et al. 1989, 2001) (all inclinations).
with some overlap among the samples. The last two sets were specifically added to provide a good number of likely local counterparts of the peculiar and irregular galaxies seen with HST in large numbers at high redshifts. The UBVRI + JHK images from these ground-based surveys, where available, are included in the data presented in Section 3 (Fig. 4).
To date, the HST Archive contains over 10,000 orbits of data on a multitude of distant galaxy projects (including parallels). To match these numerous observations of distant galaxies, we need a statistically significant and representative comparison sample of nearby galaxies that includes all morphological types. To cover a broad range of nearby galaxies, we will use three broad bins of Hubble types: (1) early-type galaxies (E-S0), (2) early-mid type spiral galaxies (Sa-Sc), and (3) late-type galaxies, irregulars (Sd-Irr), plus peculiars and mergers. For statistical studies as a function of photometric parameters, we will cover a range in inclination angles in three bins of sini: edge-on, face-on, and intermediate angles. Thus, we need about 54 galaxies in total, to populate each of the nine type-inclination bins with 6 galaxies to begin to average over galaxy properties.
Of the 20 galaxies with WFPC2 F300W images in the Archive as of early 2000 (mostly E/S0/Sabc's), about 17 are small enough to be contained within the WFPC2 FOV. To this available mid-UV sample we add here a complementary set of 37 galaxies, which we selected from the ground-based samples of about 750 galaxies described in section 2.2.1. These objects comprise 24 new irregulars, peculiars, and merging/interacting galaxies, and 13 new E/S0/Sabc's to complement the 17 usable galaxies available in the HST Archive.
2.2.3. Selection of the HST/WFPC2 Mid-UV Sample
The selection criteria for inclusion in the HST/WFPC2 sample of 37 galaxies are:
(a) the B-band half-light radius should fall within
the range 0.'1
 re
1.'0;
re
1.'0;
(b) the predicted average SB in F300W out to
r  re should be in the range 18
µF300W
22.5-23.0
mag arcsec - 2;
re should be in the range 18
µF300W
22.5-23.0
mag arcsec - 2;
(c) the distribution of Hubble types should be representative for nearby galaxy samples when combined with the set of archival galaxies;
(d) the distribution over apparent axis ratio (and hence inclination) should resemble that of nearby galaxy samples;
(e) priority should be given, first, to the 15 galaxies with available UIT 1500Å images that obey the other selection criteria above, and then to galaxies with multi-band ground-based images available;
(f) as much as possible, select galaxies that are schedulable in the HST CVZ, while satisfying (a) - (e). Replace candidates that are difficult to schedule by alternates.
In Table 1 we list the properties of the selected
sample. Most of the
table entries are taken or derived from values listed in the RC3 catalogue
(de Vaucouleurs et
al. 1991).
Cols. 2 and 3 list the
coordinates of the galaxy centers as measured on the Digital Sky Survey
(DSS). In a few cases of complex galaxies, merging/interacting
galaxies, or galaxies in small groups, the listed coordinates refer to a
"center of mass" position, allowing optimal centering inside the WFPC2
FOV. Col. 4 shows the apparent axis ratio of the minor and major axis
isophotal diameter measured at the µB = 25.0 mag
arcsec - 2 isophote. The
half-light radius, re and the radius at the
µB = 25.0 mag arcsec - 2 isophote,
r25, are listed in Cols. 5 and 6, respectively; the
predicted average SB in F300W out to re and
r25, and the
predicted total F300W magnitude (see section 2.2) are tabulated
in Cols. 7, 8, and 12. Col. 13 lists the revised T-type (numeric
morphological type on the 16-step de Vaucouleurs scale). The redshifts
in Col. 14 are given with respect to the Galactic Standard of Rest.
Col. 15 lists for each galaxy the physical image scale in pc/(")
at the distance of the galaxy, assuming a Hubble constant
H0 = 67 km s - 1 Mpc - 1. And
Col. 16 gives the physical size of a single WFC
CCD-frame at that redshift. For the typical redshift range,
z 0.004-0.02
(i.e., Virgo-Coma cluster like distances), a
single WFPC2 CCD covers 6.8-34 kpc.
| Galaxy | RA (J2000) | DEC | b/a | re | r25 | SBeU300 | SBr25U300 | U-B | B-V | B | U300 | T | z | Scale | kpc |
| (') | (') | (mag/arcsec2) | (mag) | (mag) | (mag) | (mag) | (pc / ") | / FOV | |||||||
| (1) | (2) | (3) | (4) | (5) | (6) | (7) | (8) | (9) | (10) | (11) | (12) | (13) | (14) | (15) | (16) |
| --- Cycle 9 WFPC2 mid-UV Sample: | |||||||||||||||
| NGC 1140 | 02:54:33.43 | -10:01:42.4 | 0.55 | 0.144 | 0.830 | 18.29 | 21.34 | -0.43 | 0.35 | 12.84 | 12.26 | 10.0 | 0.0049 | 106. | 7.95 |
| ESO 418-G008 | 03:31:30.58 | -30:12:46.6 | 0.66 | 0.185 | 0.587 | 20.61 | 22.37 | -0.23 | 0.41 | 13.92 | 13.84 | 8.0 | 0.0038 | 82.4 | 6.18 |
| NGC 1396 | 03:38:06.63 | -35:26:24.5 | 0.10 | 0.172 | 0.500 | 21.19 | 22.75 | 0.53 | ... | 14.80 | 16.62 | -3.0 | 0.0026 | 56.4 | 4.23 |
| NGC 1510 | 04:03:32.55 | -43:24:03.0 | 0.55 | 0.151 | 0.659 | 19.62 | 22.07 | -0.19 | 0.45 | 13.47 | 13.49 | -2.3 | 0.0028 | 60.7 | 4.55 |
| ESO 033-G022 | 05:31:41.58 | -73:45:04.2 | 0.06 | 0.248 | 1.021 | 19.92 | 22.24 | -0.30 | ... | 15.37 | 15.12 | 7.0 | 0.0138 | 299. | 22.4 |
| UGC 03426 (Mrk 3) | 06:15:36.33 | +71:02:13.8 | 0.87 | 0.085 | 0.910 | 20.36 | 24.76 | 0.18 | 1.06 | 14.03 | 14.98 | -2.0 | 0.0138 | 299. | 22.4 |
| IC 2184 (Mrk 8) | 07:29:25.31 | +72:07:39.8 | 0.78 | 0.159 | 0.416 | 19.17 | 20.51 | -0.58 | ... | 13.50 | 12.55 | 9.0 | 0.0124 | 269. | 20.2 |
| NGC 2551 | 08:24:50.16 | +73:24:43.0 | 0.68 | 0.220 | 0.830 | 21.75 | 23.88 | 0.39 | 0.99 | 13.10 | 14.57 | 0.2 | 0.0080 | 174. | 13.1 |
| UGC 05028/29 (Arp 300) | 09:27:56.94 | +68:24:56.9 | 0.58 | 0.150 | 0.354 | 21.32 | 22.44 | 0.14 | ... | 14.30 | 15.15 | 4.0 | 0.0127 | 276. | 20.7 |
| UGC 05101 | 09:35:51.45 | +61:21:10.5 | 0.59 | 0.183 | 0.574 | 20.10 | 21.83 | -0.89 | ... | 15.20 | 13.47 | 11.0 | 0.0401 | 870. | 65.3 |
| UGC 05189 | 09:42:55.27 | +09:28:47.9 | 0.52 | 0.226 | 0.869 | 20.22 | 22.39 | -0.73 | ... | 14.60 | 13.27 | 10.0 | 0.0102 | 221. | 16.6 |
| UGC 05626 | 10:24:27.76 | +57:23:31.1 | 0.37 | 0.215 | 0.792 | 20.04 | 22.12 | -0.73 | ... | 14.90 | 13.57 | 10.0 | 0.0088 | 191. | 14.3 |
| NGC 3310 (Arp 217) | 10:38:45.99 | +53:30:10.1 | 0.78 | 0.204 | 1.545 | 17.74 | 21.38 | -0.43 | 0.35 | 11.15 | 10.57 | 4.0 | 0.0035 | 75.9 | 5.69 |
| MCG+06-24-047 | 11:05:08.87 | +38:04:08.7 | 0.07 | 0.143 | 0.301 | 17.45 | 18.31 | -0.89 | ... | 15.40 | 13.67 | 11.0 | 0.0292 | 633. | 47.5 |
| NGC 3516 | 11:06:47.48 | +72:34:06.7 | 0.78 | 0.190 | 0.869 | 19.86 | 22.41 | -0.06 | 0.81 | 12.50 | 12.85 | -2.0 | 0.0092 | 200. | 15.0 |
| NGC 3690/IC 694 (Arp 299) | 11:28:31.49 | +58:33:45.9 | 0.83 | 0.185 | 0.587 | 17.87 | 19.62 | -0.58 | ... | 11.80 | 10.85 | 9.0 | 0.0107 | 232. | 17.4 |
| UGC 06527 (Arp 322) | 11:32:42.24 | +52:56:42.9 | 0.78 | 0.143 | 0.301 | 20.47 | 21.33 | -0.89 | ... | 15.80 | 14.07 | 11.0 | 0.0273 | 592. | 44.4 |
| UGC 06697 | 11:43:48.86 | +19:58:06.1 | 0.17 | 0.288 | 0.931 | 20.04 | 21.83 | -0.32 | 0.49 | 14.08 | 13.78 | 10.0 | 0.0223 | 484. | 36.3 |
| MCG+03-30-071 | 11:44:01.88 | +19:47:23.7 | 0.34 | 0.162 | 0.435 | 21.42 | 22.82 | -0.15 | 0.53 | 15.54 | 15.66 | 10.0 | 0.0163 | 354. | 26.6 |
| NGC 3860B | 11:44:47.27 | +19:46:05.3 | 1.00 | 0.134 | 0.245 | 22.02 | 22.58 | -0.12 | 0.52 | 15.30 | 15.50 | 10.0 | 0.0212 | 460. | 34.5 |
| NGC 3921 (Arp 224) | 11:51:06.78 | +55:04:44.4 | 0.62 | 0.362 | 1.069 | 22.34 | 23.94 | 0.25 | 0.68 | 13.06 | 14.18 | 0.0 | 0.0198 | 430. | 32.3 |
| NGC 4478 | 12:30:17.33 | +12:19:41.7 | 0.85 | 0.223 | 0.953 | 21.46 | 23.86 | 0.46 | 0.91 | 12.36 | 14.01 | -5.0 | 0.0044 | 95.4 | 7.16 |
| IC 3949 | 12:58:52.29 | +27:49:21.6 | 0.19 | 0.174 | 0.512 | 21.41 | 23.00 | 0.21 | 0.84 | 15.10 | 16.12 | -2.0 | 0.0249 | 540. | 40.5 |
| UGC 08335 (Arp 238) | 13:15:32.91 | +62:07:36.6 | 0.89 | 0.167 | 0.467 | 22.47 | 23.95 | 0.04 | ... | 15.00 | 15.60 | 4.0 | 0.0312 | 677. | 50.8 |
| Mrk 66 | 13:25:53.68 | +57:15:16.4 | 0.65 | 0.130 | 0.218 | 19.84 | 20.21 | -0.66 | 0.02 | 15.00 | 13.85 | 11.0 | 0.0221 | 479. | 35.9 |
| NGC 5253 | 13:39:55.76 | -31:38:38.5 | 0.39 | 0.379 | 2.506 | 18.52 | 21.88 | -0.24 | 0.43 | 10.87 | 10.77 | 10.0 | 0.0009 | 19.5 | 1.46 |
| NGC 5278/79 (Arp 239) | 13:41:39.96 | +55:40:12.4 | 0.71 | 0.197 | 0.674 | 21.43 | 23.35 | 0.14 | ... | 13.60 | 14.45 | 3.0 | 0.0255 | 553. | 41.5 |
| UGC 08696 (Mrk 273) | 13:44:42.29 | +55:53:11.1 | 0.23 | 0.183 | 0.574 | 18.95 | 20.68 | -0.89 | ... | 15.07 | 13.34 | 11.0 | 0.0380 | 824. | 61.8 |
| UGC 08823 (Mrk 279) | 13:53:03.55 | +69:18:30.3 | 0.59 | 0.162 | 0.435 | 22.65 | 24.05 | 0.49 | ... | 14.57 | 16.29 | -2.0 | 0.0311 | 675. | 50.6 |
| IC 4393 | 14:17:49.07 | -31:20:55.5 | 0.11 | 0.275 | 1.199 | 20.28 | 22.73 | -0.18 | ... | 14.55 | 14.60 | 6.0 | 0.0087 | 189. | 14.2 |
| UGC 09855 | 15:25:04.62 | +66:15:15.8 | 0.33 | 0.210 | 0.757 | 19.77 | 21.80 | -0.73 | ... | 14.80 | 13.47 | 10.0 | 0.0122 | 265. | 19.9 |
| UGC 10043 | 15:48:41.22 | +21:52:10.1 | 0.15 | 0.275 | 1.199 | 21.42 | 23.87 | 0.04 | ... | 14.80 | 15.40 | 4.0 | 0.0075 | 163. | 12.2 |
| NGC 6753 | 19:11:23.75 | -57:02:57.7 | 0.87 | 0.406 | 1.227 | 21.57 | 23.22 | 0.13 | 0.83 | 11.97 | 12.79 | 3.0 | 0.0103 | 223. | 16.7 |
| NGC 6789 | 19:16:41.93 | +63:58:20.8 | 0.78 | 0.193 | 0.644 | 19.42 | 21.28 | -0.73 | ... | 13.70 | 12.37 | 10.0 | 0.0005 | 10.8 | 0.81 |
| NGC 6782 | 19:23:57.96 | -59:55:21.6 | 0.66 | 0.354 | 1.094 | 21.32 | 23.02 | 0.32 | 0.92 | 11.84 | 13.14 | 0.8 | 0.0127 | 276. | 20.7 |
| NGC 7685 | 23:30:33.35 | +03:54:08.4 | 0.76 | 0.489 | 0.931 | 23.37 | 24.02 | 0.00 | 0.66 | 13.84 | 14.34 | 5.3 | 0.0193 | 419. | 31.4 |
| NGC 7769 (Mrk 9005) | 23:51:03.96 | +20:09:00.0 | 0.95 | 0.220 | 0.830 | 21.16 | 23.29 | 0.14 | ... | 12.77 | 13.62 | 3.0 | 0.0146 | 317. | 23.8 |
| --- Archival WFPC2 mid-UV Sample: | |||||||||||||||
| NGC 0221 | 00:42:41.90 | +40:51:55.0 | 0.76 | 0.601 | 4.355 | 20.21 | 23.76 | 0.48 | 0.95 | 9.03 | 10.73 | -6.0 | -0.0001 | 3.76 | .282 |
| NGC 1326 | 03:23:56.40 | -36:27:50.0 | 0.65 | 0.416 | 1.945 | 21.12 | 23.72 | 0.28 | 0.87 | 11.41 | 12.61 | -1.0 | 0.0041 | 88.9 | 6.67 |
| NGC 1380 | 03:36:26.90 | -34:58:33.0 | 0.66 | 0.659 | 2.393 | 22.02 | 24.07 | 0.45 | 0.94 | 10.87 | 12.49 | -2.0 | 0.0057 | 124. | 9.30 |
| NGC 1507 | 04:04:27.30 | -02:11:17.0 | 0.08 | 0.512 | 1.815 | 19.90 | 21.90 | -0.07 | 0.57 | 12.89 | 13.21 | 9.0 | 0.0027 | 58.6 | 4.40 |
| NGC 2798 | 09:17:22.90 | +42:00:02.0 | 1.00 | 0.199 | 1.285 | 20.89 | 24.19 | -0.01 | 0.72 | 13.04 | 13.51 | 1.0 | 0.0058 | 126. | 9.45 |
| NGC 3448 | 10:54:39.10 | +54:18:24.0 | 0.76 | 0.388 | 2.812 | 21.03 | 24.59 | -0.19 | 0.43 | 12.48 | 12.50 | 90.0 | 0.0047 | 102. | 7.65 |
| NGC 3516 | 11:06:47.30 | +72:34:12.0 | 0.89 | 0.190 | 0.869 | 20.00 | 22.55 | -0.06 | 0.81 | 12.50 | 12.85 | -2.0 | 0.0092 | 200. | 15.0 |
| NGC 4278 | 12:20:07.20 | +29:16:47.0 | 0.45 | 0.574 | 2.037 | 21.53 | 23.53 | 0.45 | 0.93 | 11.09 | 12.71 | -5.0 | 0.0022 | 47.7 | 3.58 |
| NGC 4425 | 12:27:13.40 | +12:44:09.0 | 0.96 | 0.379 | 1.476 | 22.94 | 25.14 | 0.39 | 0.90 | 12.73 | 14.20 | -1.0 | 0.0061 | 132. | 9.90 |
| NGC 4476 | 12:29:58.70 | +12:20:53.0 | 0.50 | 0.301 | 0.849 | 21.71 | 23.21 | 0.27 | 0.82 | 13.01 | 14.18 | -3.0 | 0.0062 | 134. | 10.1 |
| NGC 4564 | 12:36:27.00 | +11:26:21.0 | 0.36 | 0.330 | 1.774 | 21.07 | 23.97 | 0.46 | 0.93 | 12.05 | 13.70 | -5.0 | 0.0036 | 78.1 | 5.86 |
| NGC 4639 | 12:42:52.60 | +13:15:30.0 | 0.78 | 0.489 | 1.377 | 22.00 | 23.50 | 0.08 | 0.70 | 12.24 | 12.94 | 4.0 | 0.0032 | 69.4 | 5.21 |
| NGC 4772 | 12:53:29.10 | +02:10:11.0 | 0.45 | 0.397 | 1.694 | 21.29 | 23.70 | 0.33 | 0.92 | 11.96 | 13.28 | 1.0 | 0.0032 | 69.4 | 5.21 |
| NGC 5273 | 13:42:08.40 | +35:39:12.0 | 0.29 | 0.512 | 1.377 | 21.87 | 23.27 | 0.34 | 0.85 | 12.44 | 13.79 | -2.0 | 0.0037 | 80.3 | 6.02 |
| NGC 5377 | 13:56:16.80 | +47:14:17.0 | 1.00 | 0.561 | 1.858 | 23.29 | 25.14 | 0.37 | 0.90 | 12.24 | 13.66 | 1.0 | 0.0063 | 137. | 10.3 |
| IC 4710 | 18:28:38.20 | -66:58:54.0 | 0.79 | 0.632 | 1.815 | 22.38 | 23.92 | -0.10 | 0.57 | 12.50 | 12.75 | 9.0 | 0.0021 | 45.6 | 3.42 |
| NGC 7673 | 23:27:41.60 | +23:35:24.0 | 0.91 | 0.155 | 0.644 | 19.58 | 21.92 | -0.33 | 0.41 | 13.17 | 12.84 | 5.0 | 0.0119 | 258. | 19.4 |
(a) Unless stated otherwise, all table entries are taken or derived from de RC3 catalogue (de Vaucouleurs et al. 1991). | |||||||||||||||
NOTES ON TABLE COLUMNS: (1) galaxy name; (2) and (3) J2000 (RA, DEC) coordinates of the galaxy centers as measured on the Digital Sky Survey (DSS). In a few cases of complex galaxies, galaxy mergers, or galaxies in small groups, the listed coordinates refer to a "center of gravity position", allowing optimal centering inside the WFPC2 FOV; (4) ratio of the minor and major axis isophotal diameter at the SB(B) = 25.0 mag arcsec-2 isophote; (5) re denotes the half-light radius; (6) r25 denotes the radius at the SB(B) = 25.0 mag arcsec-2 isophote; (7) predicted average SB in F300W out to re (see section 2.2); (8) predicted average SB in F300W out to r25 (see Section 2.2); (9) measured Johnson (U - B) aperture color; (10) measured (B - V) aperture color; (11) total B-band magnitude; (12) predicted total F300W magnitude (see Section 2.2); (13) revised galaxy T-type (see also Fig. 2a); (14) Galactocentric galaxy redshift, as derived from the RC3; (15) number of parsec per arcsec at the distance of the galaxy, assuming a Hubble constant of 67 km s-1 Mpc-1; (16) physical size in kpc corresponding to a single WFPC2 CCD of 75" [Col. 16 = Col. 15 × 0.075). | |||||||||||||||
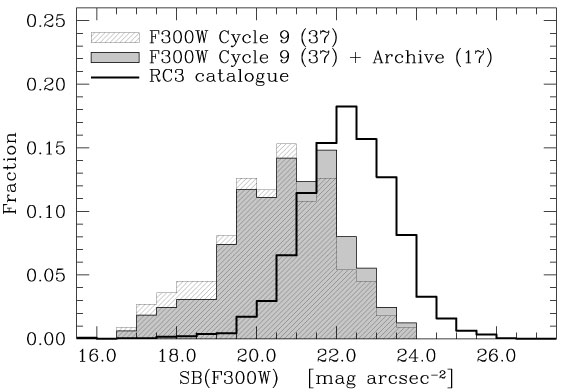
The SB-selection of the sample is illustrated in
Fig. 1, which shows the
normalized distributions of the predicted average
µF300W out to re for
the full (54 galaxy) sample and for the 37 galaxies in the Cycle 9 WFPC2
mid-UV sample, and compares these with the distribution over SB derived
for the 3009 galaxies in the RC3 with measured BT,
(U - B) and re.
Clearly, we sample predominantly galaxies with higher SB than the median
SB-value in the RC3, which is µF300W
22.3 mag arcsec -
2.
|
Figure 1. The normalized distribution of
the predicted average mid-UV
surface brightness (SB) out to re (see
Section 2.1.2)
for the 37 galaxies observed during HST Cycle 9 (hashed
histogram) and for the full galaxy sample (solid histogram),
which includes 17 galaxies with mid-UV data taken prior to Cycle 9. For
comparison, we also show the SB distribution for the 3009 galaxies in
the RC3 with measured BT, (U - B) and
re (open histogram).
The galaxies were selected to have µF300W
|
As nearby galaxy samples like the RC3 are also limited by significant
SB-selection
(Disney 1976,
Driver 1999),
this thus means that our Cycle
9 HST sample represents only the tip of the local galaxy
SB-distribution. Fig. 1 shows that our sample
covers only about the
brightest 50% SB-percentile seen in the RC3, while it over-represents
the highest SB galaxies seen in the RC3. If one wanted to use our
sample to represent all galaxies in the RC3 with
µF300W
 23 mag arcsec - 2,
one would have to apply weights to each of our galaxies in a given
observed SB-bin that could be derived from dividing the two
distributions over SB in Fig. 1. This will
obviously not work for
galaxies with µF300W
23 mag arcsec - 2,
one would have to apply weights to each of our galaxies in a given
observed SB-bin that could be derived from dividing the two
distributions over SB in Fig. 1. This will
obviously not work for
galaxies with µF300W
 23 mag arcsec -
2, since almost no galaxies at average
SB-levels that faint were observed with HST.
23 mag arcsec -
2, since almost no galaxies at average
SB-levels that faint were observed with HST.
As aforementioned, this SB-selection is justified when the primary goal is to construct a sample for comparison of nearby and high-redshift galaxies, since the strong cosmological SB-dimming limits our view of the high-redshift universe in a similar way (or worse). For example, simulations by Windhorst et al. (2002), who investigate how the galaxies in the present sample would appear to NGST under realistic observing conditions, show that at very high redshifts (z ~ 7-15) only the highest SB mid-UV structures (with average rest-frame µF300W out to re brighter than 20-21 mag arcsec - 2) will be visible to NGST.
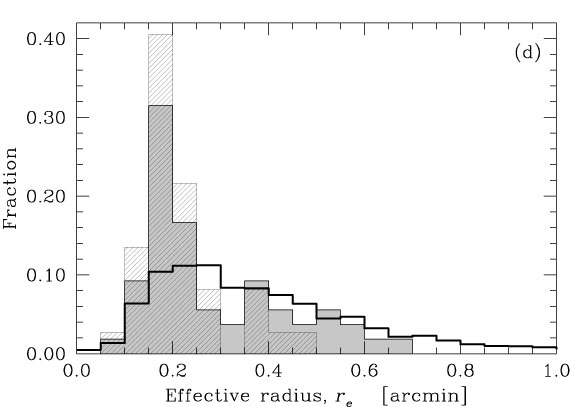
Figures 2a-d show the distributions of morphological type, of apparent axis ratio b/a, of the estimated average (U - B) color within the effective radius, and of the effective radius re, within the selected sample. These figures will help the reader to evaluate the usefulness or the weight to apply to individual galaxies in the present sample when using these data for his or her particular purpose. We stress that the present sample is not formally complete and, therefore is not suitable for studies that rely on complete statistics (i.e., studies that cover the complete local galaxy luminosity function or the complete range in local galaxy SB). Nonetheless, important trends are visible in Figs. 2a-2d that will help the reader to make our sample useful for high-redshift comparisons. These trends are:
15 mag) all the way down to the HDF limit
(B 28
mag), our nearby comparison sample is thus a fair one in terms of galaxy
ellipticities at all redshifts.
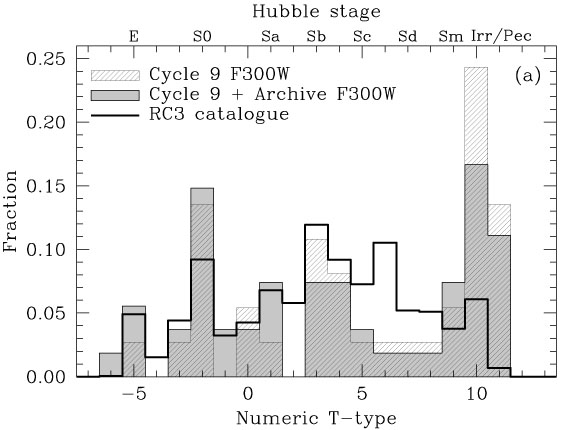
|
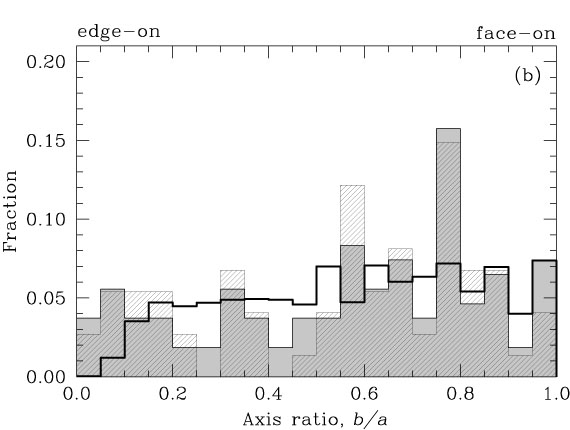
|
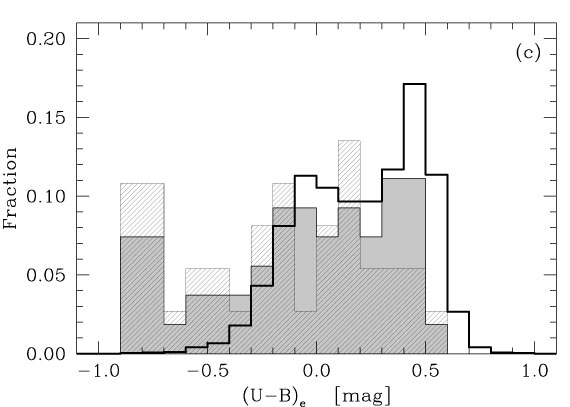
|
|
Figure 2. ���������������������������������������������������������������������������������������������������������������������������������������������������������������������������������������������������������������������������������������������������������������������������������������������������������������������������������������������������������������������������������������������������������������������������������������������������������������������������������������������������������������������������������������������������������������������������������������������������������������������������������������������������������������������������������������������������������������Other properties of the selected galaxy sample. As in Fig. 1, we present normalized distributions for the Cycle 9 galaxies (hashed), the full sample (solid), and the RC3 (open) of (a) morphological type; (b) apparent axis ratio, b/a; (c) average (U - B) color out to re; and (d) effective radius re. Taking deviations due to small number statistics into account, our sample approximates the RC3 distribution, except that for the purpose of comparison with high redshift objects, we placed extra emphasis on the very latest types, bluest optical galaxy colors, and smallest angular sizes (to fit the FOV of the WFPC2). We also somewhat over-represent highly inclined systems. |
Again, any non-representativeness of our galaxy sample compared to the RC3, or to any other galaxy catalog for that matter, can be addressed by applying the appropriate weights to individual galaxies in our sample when comparing it to any other samples. These weights can be determined from the ratios between the observed distributions in Fig. 2a-2d, or between our sample and any other sample than the RC3.