Copyright © 2001 by Annual Reviews. All rights reserved
| Annu. Rev. Astron. Astrophys. 2001. 39:
249-307 Copyright © 2001 by Annual Reviews. All rights reserved |


3.4. Background Measurements from COBE
The strongest evidence for direct detection of the CIB to date comes from studies based on the COBE measurements. For this reason, we describe these measurements in some detail.
The COBE mission carried two instruments designed to make absolute sky brightness measurements (Boggess et al. 1992). The Diffuse Infrared Background Experiment (DIRBE) was designed primarily to search for the CIB from 1.25 to 240 µm. The Far Infrared Absolute Spectrophotometer (FIRAS) was designed primarily to make a definitive measurement of the spectrum of the CMB and to extend the search for the CIB from 125 µm to millimeter wavelengths.
The COBE instruments, spacecraft, orbit, sky-scan strategy, and data processing were all designed to optimize the ability to make these difficult measurements with minimal stray light contamination and systematic measurement uncertainties. Data collection at cryogenic temperatures was extended over 10 months, providing ample time for careful calibration and tests for systematic errors such as photometric offsets and stray light contamination.
The DIRBE instrument
(Silverberg et
al. 1993)
was an absolute photometer that provided maps of the full sky in 10
broad photometric bands: 1.25, 2.2, 3.5, 4.9, 12, 25, 60, 100, 140, and
240 µm. A summary of the DIRBE investigation and the initial
results of its CIB measurements is provided by
Hauser et al. (1998).
Additional information is given in the COBE DIRBE Explanatory
Supplement
(Hauser et al. 1997).
The DIRBE was designed for extremely strong stray light rejection for
any source, discrete or diffuse, out of the field of view of the
instrument. The stray light was demonstrated to be less than 1 nW
m-2 sr-1 at all wavelengths. The instrument
contained a cold chopper, which provided continual measurement of the
sky brightness relative to that of a cold internal beam stop. It had a
full beam cold shutter, which was closed frequently to measure the
instrumental radiative and electronic zero-point offsets. The offsets
were stable, with uncertainties less than a few nW m-2
sr-1 in all bands. The instantaneous field of view was
0.7° × 0.7°, a compromise between being able to
discriminate stars and being able to map the whole sky with high
redundancy every 6 months. Redundancy allowed monitoring of the apparent
annual variations in sky brightness due to the Earth's orbital motion
within the IPD cloud. This variation is a unique signature of the IPD
contribution to the sky brightness. The sensitivity
(1 ) of the instrument
per field of view averaged over the 10 months of cryogenic operation was
~ 2 nW m-2 sr-1 at 1.25 and 2.2 µm,
0.5-1 nW m-2 sr-1 from 3.5 to 100 µm,
and 33 (11) nW m-2 sr-1 at 140 (240)
µm. Repeated observations of stable celestial sources
provided photometric closure over the sky and assured reproducible
photometry to ~ 1% or better for the duration of the
mission. Calibration of the DIRBE flux scale was based on observations
of a few isolated infrared sources of known brightness.
) of the instrument
per field of view averaged over the 10 months of cryogenic operation was
~ 2 nW m-2 sr-1 at 1.25 and 2.2 µm,
0.5-1 nW m-2 sr-1 from 3.5 to 100 µm,
and 33 (11) nW m-2 sr-1 at 140 (240)
µm. Repeated observations of stable celestial sources
provided photometric closure over the sky and assured reproducible
photometry to ~ 1% or better for the duration of the
mission. Calibration of the DIRBE flux scale was based on observations
of a few isolated infrared sources of known brightness.
The FIRAS instrument was a Fourier transform spectrometer in the form of
a polarizing Michelson interferometer. The instrument was operated in a
null, differential mode, providing precise spectral comparison of the
sky brightness with that of a very accurate, full-beam blackbody
calibrator at wavelengths from 100 µm to 1 cm. The
instrument and calibration are discussed by
Mather et al. (1993,
1999),
Fixsen et al. (1994),
Brodd et al. (1997).
The FIRAS had a 7° diameter field of view, with extremely low
sidelobe response over a broad spectral band. The sensitivity
(1) of the instrument
from 500 µm to 3 mm was 0.8 nW m-2
sr-1 per field of view averaged over the 10 months of
cryogenic operation. The photometric calibration errors
(1) associated with the
precision blackbody calibrator were typically 0.02 MJy sr-1,
corresponding to  I ~ 0.3 and
0.1 nW m-2 sr-1 at 200 and 600 µm
wavelength, respectively.
Fixsen et al. (1996),
Mather et al. (1999)
showed that the rms deviation of the CMB spectrum from that of a 2.725
± 0.002 K blackbody was less than 50 parts per million of the peak
CMB brightness from 476 µm to 5 mm wavelength.
I ~ 0.3 and
0.1 nW m-2 sr-1 at 200 and 600 µm
wavelength, respectively.
Fixsen et al. (1996),
Mather et al. (1999)
showed that the rms deviation of the CMB spectrum from that of a 2.725
± 0.002 K blackbody was less than 50 parts per million of the peak
CMB brightness from 476 µm to 5 mm wavelength.
Fixsen et al. (1997) compared the DIRBE and FIRAS zero point and absolute gain calibrations in their range of spectral overlap. They found that the calibrations of the two instruments were consistent within the quoted uncertainties of each and the systematic uncertainties of the comparison. The comparison is relatively weak for the DIRBE 100 µm band because of the low FIRAS sensitivity and partial coverage of the DIRBE bandpass. Since the FIRAS systematic calibration uncertainties are smaller than those of the DIRBE, these results can be used to make small systematic corrections in the DIRBE 140 and 240 µm results, although DIRBE-based results in the literature use the DIRBE calibration.
The COBE data have provided direct detections of the CIB in the near-infrared and submillimeter windows, as well as limits elsewhere within the spectral range of the two instruments. These results, described in Sections 3.4.2 and 3.4.3, are listed in Table 1 and shown in Figure 3. Searches for fluctuations in the CIB and their implications for the CIB, discussed in Section 3.6, are listed in Table 2 and are also shown in Figure 3.
 |
I |
Isotropy | Claimed | Reference |
| (µm) | (nW m-2 sr-1) | test passed | detection | |
| 1.25 | < 75 (33 ± 21) | no | no | Hauser et al 1998 |
| 1.25 | < 108 (60 ± 24) | no | no | Dwek & Arendt 1998 (e) |
| 1.25 | < 57 (28 ± 15) | no | no | Wright 2001b |
| 2.2 | < 39 (15 ± 12) | no | no | Hauser et al 1998 |
| 2.2 | 23 ± 6 | yes | yes | Wright & Reese 2000 |
| 2.2 | 22 ± 6 | no | tentative | Gorjian et al 2000 |
| 2.2 | 20 ± 5 | yes | yes | Wright 2001b |
| 3.5 | < 23 (11 ± 6) | no | no | Hauser et al 1998 |
| 3.5 | 14 ± 3 | no | tentative | Dwek & Arendt 1998 (e) |
| 3.5 | 11 ± 3 | no | tentative | Gorjian et al 2000 |
| 3.5 | 12 ± 3 | yes | yes | Wright & Reese 2000 |
| 1.4-4 | (see Figure 3) | yes | yes | Matsumoto et al 2000 |
| 4.9 | < 41 (25 ± 8) | no | no | Hauser et al 1998 |
| 4.9 | < 38 (25 ± 6) | no | no | Dwek & Arendt 1998 (e) |
| 12 | < 470 (190 ± 140) | no | no | Hauser et al 1998 |
| 25 | < 500 (190 ± 160) | no | no | Hauser et al 1998 |
| 60 | < 75 (21 ± 27) | no | no | Hauser et al 1998 |
| 60 | 28 ± 7 | yes | tentative | Finkbeiner et al 2000 |
| 100 | < 34 (22 ± 6) | no | no | Hauser et al 1998 |
| 100 | > 5 (11 ± 3) | no | no | Dwek et al 1998 |
| 100 | 23 ± 6 | no | yes | Lagache et al 2000 |
| 100 | 25 ± 8 | yes | tentative | Finkbeiner et al 2000 |
| 140 | 32 ± 7 | yes | tentative | Schlegel et al 1998 (c) |
| 140 | 25 ± 7 | yes | yes | Hauser et al 1998 (c) |
| 140 | 15 ± 6 | yes | yes | Hauser et al 1998 (d) |
| 140 | 15 ± 6 | no | yes | Lagache et al. 1999 (c) |
| 140 | < 47 (24 ± 12) | no | no | Lagache et al 2000 (c) |
| 240 | 17 ± 2 | yes | tentative | Schlegel et al 1998 (c) |
| 240 | 14 ± 3 | yes | yes | Hauser et al 1998 (c) |
| 240 | 13 ± 2 | yes | yes | Hauser et al 1998 (d) |
| 240 | 11 ± 2 | no | yes | Lagache et al. 1999 (c) |
| 240 | < 25 (11 ± 7) | no | no | Lagache et al. 2000 (c) |
| 200-1000 | (see Figure 3) | yes | tentative | Puget et al. 1996 |
| 200-1000 | a( /
0)k
B(T) |
yes | yes | Fixsen et al 1998(a) |
| 200-1000 | a( /
0)k
B(T) |
yes | yes | Lagache et al 1999(b) |
Error bars are
1 | ||||
|
 a a |
 (
I)
b (
I)
b |
PS c |
I
d |
Reference |
| (µm) | (arcmin) | (nW m-2 sr-1) | (Jy2 sr-1) | (nW m-2 sr-1) | |
| 1.25 | 42 | <19 | <200 | Kashlinsky et al. 1996a | |
| 1.25 | 42 | 15.5+3.7-7.0 | Kashlinsky et al. 2000 e | ||
| 1.25 | 42 | <5.6 | Wright 2001b | ||
| 1.4 | 8 | ~ 18 | Matsumoto et al. 2000 | ||
| 2.2 | 0.2–0.5 | <9.6 | Boughn et al. 1986 f | ||
| 2.2 | 1–5 | <4.1 | Boughn et al. 1986 f | ||
| 2.2 | 42 | <7 | <78 | Kashlinsky et al. 1996a | |
| 2.2 | 42 | 5.9+1.6-3.7 | Kashlinsky et al. 2000 e | ||
| 2.2 | 42 | <2.5 | Wright 2001b | ||
| 2.6 | 8 | ~ 5 | Matsumoto et al. 2000 | ||
| 3.5 | 42 | <2.4 | <26 | Kashlinsky et al. 1996a | |
| 3.5 | 42 | 2.4+0.5-0.9 | Kashlinsky et al. 2000 e | ||
| 4.9 | 42 | <1.3 | <13 | Kashlinsky et al. 1996b | |
| 4.9 | 42 | 2.0+0.25-0.5 | Kashlinsky et al. 2000 e | ||
| 12–100 | 42 |  1–1.5
1–1.5 |
10–15 |
Kashlinsky et al. 1996b | |
| 12 | 42 | <1.0 | <15 | Kashlinsky et al. 2000 | |
| 25 | 42 | <0.5 | <8 | Kashlinsky et al. 2000 | |
| 60 | 42 | <0.8 | <12 | Kashlinsky et al. 2000 | |
| 100 | 42 | <1.1 | <17 | Kashlinsky et al. 2000 | |
| 90 | 0.4–20 | 13000 ± 3000 | >3–10 | Matsuhara et al. 2000 | |
| (150 mJy) | |||||
| 170 | 0.6–4 | ~ 1 | 7400 (100 mJy) | Lagache & Puget 2000 | |
| 170 | 0.6–20 | 12000 ± 2000 | >0.9–2.6 | Matsuhara et al. 2000 | |
| (250 mJy) | |||||
| 400-1000 | 420 | 4(/400
µm)-3.1 |
Burigana & Popa 1998 | ||
| a Approximate angular scale of fluctuation measurements. | |||||
| b
[(
I)]2
is the variance of
I. |
|||||
| c Source power spectrum, for sources fainter than flux shown in parentheses. | |||||
| d Reported limit on the CIB inferred from the fluctuation measurement. | |||||
| e Limits give 92% confidence interval. | |||||
| f 90% confidence level. | |||||
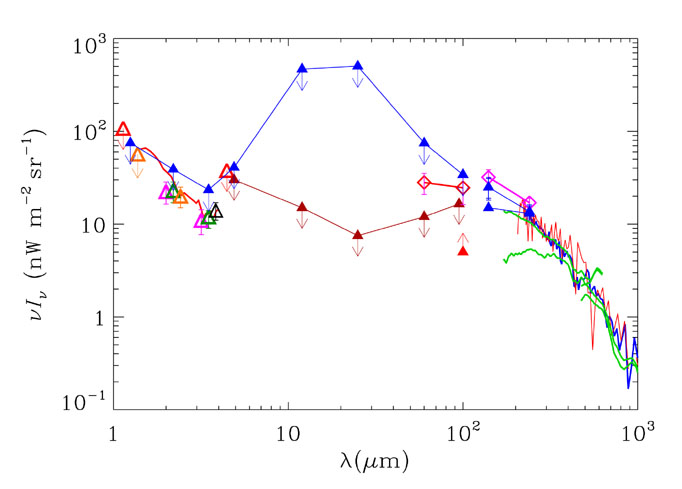 |
Figure 3. Diffuse extragalactic infrared
background measurements and limits. Error bars shown are
1 | .
3.4.2. CIB DETECTIONS AND LIMITS BASED ON DIRBE DATA
The first tentative identification of the CIB using DIRBE data was reported by Schlegel et al. (1998). In the course of preparing Galactic reddening maps based on the far-infrared data from IRAS and DIRBE, they removed the zodiacal emission contribution from the DIRBE data using the DIRBE 25 µm map as a template. Correlating the residual maps with H I maps they found a significant constant background at 140 and 240 µm, which they identified as a possible measurement of the CIB. However, they were not certain that the residual constant could not be an instrumental effect. They could not therefore be confident that the CIB had been detected and noted that the results of the DIRBE team would be more definitive.
The DIRBE team searched for the CIB in all 10 DIRBE wavelength bands
(Hauser et al. 1998).
Using the final photometric reduction of the DIRBE data, they reported
conservative upper limits at all wavelengths based on the darkest
measured sky brightness at each wavelength. These dark sky limits (95%
confidence level) are
I < 398,
151, 64, 193, 2778, 2820, 315, 94, 73, and 28 nW m-2
sr-1 at 1.25, 2.2., 3.5, 4.9, 12, 25, 60, 100, 140, and 240
µm, respectively. After modeling and removing the
contributions from foreground sources, they found positive residuals
exceeding
3 only at 4.9, 100, 140,
and 240 µm, of which only the 140 and 240 µm
were found to be isotropic (Table 1). Isotropy
tests included (a) tests of the consistency of the mean residuals
on five sky patches near the two Galactic poles, the two ecliptic poles,
and in the Lockman Hole; (b) tests for spatial variations such as
gradients with Galactic and ecliptic latitude; (c) tests of the
residual pixel brightness distributions; (d) tests for
correlations of the residuals with the foreground models; and most
rigorously (e) a two-point correlation function analysis of the
residuals on 2% of the sky including areas at high north and south
Galactic latitudes. Only the 140 and 240 µm residuals were
isotropic in the correlation function test, although because of detector
noise, the limits on anisotropies at these wavelengths were only of the
order of 10% of the mean CIB value.
The DIRBE team showed that the 140 and 240 µm residuals
could not be explained in terms of unmodeled components of the solar
system or Galaxy
(Dwek et al. 1998),
and they therefore concluded that the CIB had been measured at these
wavelengths. At all other wavelengths, they reported CIB upper limits
based on the residuals and estimated uncertainties. A conservative lower
limit of 5 nW m-2 sr-1 at 100 µm was
also determined, based on the argument that a thermal source producing
the spectrum detected at 140 and 240 µm could not be fainter
than this level at 100 µm
(Dwek et al. 1998).
The DIRBE team reported the 140 and 240 µm background both
on the DIRBE photometric scale and transformed to the more accurate
FIRAS photometric scale (Section 3.4.1). The
recalibrated brightnesses are consistent with the values on the DIRBE
scale, the most notable difference being about a
1.5 reduction at 140
µm (Table 1).
Systematic uncertainties in the foreground determination dominated the uncertainties reported by the DIRBE team. The IPD contribution presents the most difficult problem except at the longest wavelengths (Figure 2). The IPD brightness was determined by fitting the apparent annual variation of the sky brightness over the whole sky, with a parameterized model of the spatial distribution and scattering and radiative properties of the dust cloud (Kelsall et al. 1998). Although this model was successful, reproducing the seasonal variation well and leaving evident map artifacts only at the few-percent level, the uncertainties in the small differences between the measured brightness and the model are substantial. Furthermore, it is not possible to determine a unique IPD model from measurements of the sky brightness and its apparent annual variation made from within the cloud. Kelsall et al. considered a number of different shapes for the cloud density distribution that gave comparably good fits to the time dependence. They estimated the model uncertainty from the spread between these models in residual brightness at high Galactic latitude.
Arendt et al. (1998) described the DIRBE team methods for determining the Galactic contributions to the sky brightness. Discrete sources brighter than the DIRBE direct detection limit (~ fifth magnitude at 2.2 µm) and regions of bright extended emission were blanked out of the DIRBE maps. The contribution from fainter discrete Galactic sources was calculated from 1.25 to 25 µm using a faint source model based on the detailed statistical SKY model of Wainscoat et al. (1992).
The contribution from the interstellar medium (ISM) at most DIRBE wavelengths was identified by its variation over the sky. The 100 µm map was used to construct an ISM template for all other wavelengths from 12 to 240 µm. The residual maps with IPD and discrete Galactic sources removed at each wavelength was correlated with the ISM template to determine a global ISM color relative to 100 µm for each map. The ISM template was then scaled by each color and subtracted from the corresponding map to produce the final residual maps. The residual maps from 12 to 60 µm failed the isotropy tests, and their mean residuals at high Galactic latitude provided upper limits on the CIB.
The emission at 100, 140, and 240 µm (after removal of the
IPD contribution) was correlated with H I column density in two
well-studied dark fields near the north ecliptic pole and the Lockman
Hole. The correlation line was then extrapolated to zero H I column
density. If all of the Galactic infrared emission were correlated with H
I gas, extrapolation of this correlation to zero column density would
yield the extragalactic light. If there were additional infrared
emissions associated with other gas components not correlated with H I,
this procedure would not yield accurate results.
Arendt et al. (1998)
chose these two fields because they were known to have little molecular
gas, and low limits on the contribution from ionized gas regions could
be set using pulsar dispersion measures and
H measurements. These
additional determinations were averaged with the mean map residuals at
100, 140, and 240 µm to obtain the final CIB values shown in
Table 1.
measurements. These
additional determinations were averaged with the mean map residuals at
100, 140, and 240 µm to obtain the final CIB values shown in
Table 1.
To test the 100 µm residual for isotropy, an ISM template independent of the 100 µm map was needed. Arendt et al. (1998) used the H I map of Stark et al. (1992) as an ISM spatial template for this purpose. The final 100 µm residual map did not pass the isotropy tests, so only an upper limit on the CIB was reported. There was no discernible ISM contribution at 1.25 and 2.2 µm. Arendt et al. determined the small ISM contributions at 3.5 and 4.9 µm using an analysis based on a reddening-free parameter. The uncertainty in the ISM contribution at these short wavelengths made a negligible contribution to the overall uncertainty.
Following publication of the DIRBE team results, numerous analyses have
been aimed at improving the determination of the
foregrounds. Recognizing that the bright IPD foreground is a major
obstacle to CIB detection,
Finkbeiner et al. (2000)
analyzed the DIRBE data using two approaches that avoid the need for a
detailed IPD model. Both methods were based on analysis of the annual
variation of dimensionless ratios of the data along opposing lines of
sight after removal of the ISM contribution, and both showed the
presence of seasonally varying contributions from IPD plus a temporally
constant background at 60 and 100 µm. Their analysis
required assumptions about the spatial symmetries and temporal
invariance of the IPD cloud similar to those of the
Kelsall et al. (1998)
model. Finkbeiner et al. tentatively identified the constant backgrounds
with the CIB (Table 1), though they could not
conclusively demonstrate an extragalactic origin. They further noted
that the values are rather high and not consistent with limits implied
by the opacity of the intergalactic medium to TeV
 -rays
(Sections 3.7 and
4.4). They concluded that there is not yet a
satisfactory explanation for these constant backgrounds.
-rays
(Sections 3.7 and
4.4). They concluded that there is not yet a
satisfactory explanation for these constant backgrounds.
The statistical model of the stellar contribution used by the DIRBE team was a major source of uncertainty in the near infrared. There have been several studies aimed at reducing that uncertainty. Dwek & Arendt (1998) created a full-sky template of stellar light directly from the DIRBE data by assuming that the CIB at 2.2 µm is equal to the integrated light from galaxies (7.4 nW m-2 sr-1 at the time of their analysis). They constructed a map of starlight at 2.2 µm by subtracting this assumed CIB value and the zodiacal light model of Kelsall et al. (1998) from the DIRBE 2.2 µm map. This residual 2.2 µm map was used as a starlight template at 1.25, 3.5, and 4.9 µm. They obtained a significantly positive residual only at 3.5 µm. They tentatively identified this 3.5 µm residual as the CIB, although they did not demonstrate that it was isotropic. Table 1 shows updated 1.25, 3.5, and 4.9 µm results obtained with the Dwek & Arendt method using the average of the best current direct determinations of the 2.2 µm CIB discussed below (22 ± 6 nW m-2 sr-1) rather than the integrated galaxy light.
Gorjian et al. (2000)
reduced the stellar foreground uncertainty directly by measuring all the
stars brighter than ninth magnitude at 2.2 and 3.5 µm in a
dark 2° × 2° field near the north Galactic pole. They
calculated the contribution of fainter stars using the statistical model
of
Wainscoat et
al. (1992).
They also used a model for the zodiacal light contribution that differed
from that of
Kelsall et al. (1998).
They argued that the Kelsall et al. model left a high Galactic latitude
residual at 25 µm that is dominated by IPD emission. This
high 25 µm residual is unlikely to be Galactic cirrus
because the brightness relative to the cirrus at 100 µm is
much too high [as indicated by the ISM color analysis of
Arendt et al. (1998)],
and it is unlikely to be the CIB because it violates upper limits set by
TeV -ray
attenuation (Section 3.7). Gorjian et
al. therefore added a constraint
to their IPD model that the residual at 25 µm after zodiacal
light removal be zero at high Galactic latitude [the "very strong no
zodi principle" of
Wright (1997,
2001a)].
Their IPD model was otherwise similar to that of Kelsall et al., with
parameters determined by fitting the apparent annual variation of the
sky brightness. Gorjian et al. found significant positive residuals at
2.2 and 3.5 µm, which they identified as probable detections
of the CIB
(Table 1). Had they used the IPD model of Kelsall
et al., their residual emission would have been ~ 40% higher, clearly
illustrating the lack of uniqueness in the IPD model. With a field
covering only ~ 8 DIRBE beams, they did not demonstrate the isotropy of
the tentative CIB signal.
Wright & Reese (2000) used a distinctly different approach to determine the CIB at 2.2 and 3.5 µm. At each wavelength, they compared the histogram of the pixel intensity distribution in the DIRBE map with the histogram predicted from the star-count model of Wainscoat et al. (1992). The IPD contribution had first been removed using the model of Gorjian et al. (2000). They found that the predicted histograms had the same shape as those observed but had to be displaced by a constant intensity to agree with the observed histograms. The shift was consistent in five fields at high Galactic and ecliptic latitudes. They interpreted this shift as the CIB and obtained average values for the five fields consistent with the values found by Gorjian et al. (Table 1). They noted that the histogram method is statistically more powerful for finding a real residual and less subject to systematic errors in the star-count model than the subtraction approach used by Arendt et al. (1998).
The case for detection of the CIB at 2.2 µm was considerably strengthened by Wright (2001b). He used data from the initial catalog from the Two Micron All Sky Survey (2MASS) (Cutri et al. 2000) to remove the contribution of Galactic stars brighter than fourteenth magnitude from the DIRBE maps at 1.25 and 2.2 µm in four dark regions in the north and south Galactic polar caps. Each region was about 2° in radius. Using the same IPD model as Gorjian et al. (2000), Wright obtained 2.2 µm residuals in his four fields consistent with each other and with those of Gorjian et al. and of Wright & Reese (Table 1). Hence, there is a reasonable case for detection of the CIB at 2.2 µm, but its brightness has substantial uncertainty due to the uncertainty in the IPD contribution, and isotropy has been demonstrated only over a very limited area of sky. The scatter in the residuals at 1.25 µm was too large to claim a detection. Wright's analysis provides the strongest current upper limit on the CIB at 1.25 µm.
3.4.3. SUBMILLIMETER BACKGROUND BASED ON FIRAS DATA
Puget et al. (1996)
reported the first tentative identification of the CIB using COBE
data. Analyzing the first released FIRAS data, they concluded that there
was a residual uniform background from 200 µm to 2 mm in
excess of contributions from the CMB, IPD, and interstellar dust. They
constructed a simple model for the IPD brightness based on DIRBE 25 and
100 µm data and the assumption that the zodiacal emission is
only a function of ecliptic latitude. They extrapolated this model to
wavelengths longer than 100 µm, assuming
I
 3. Since at these
wavelengths the IPD contribution is small, an accurate IPD model is not
required. They assumed that the ISM emission at high Galactic latitude
and low H I column density is traced by H I, and that the submillimeter
emission correlated with H I can be represented by a single temperature
medium with a
2 emissivity
law. They also made a correction for infrared emission associated with
ionized gas not correlated with the H I, which significantly reduced
their residual at the shortest wavelengths (200-400
µm). Their residual maps had no significant gradients with
Galactic latitude or longitude.
Figure 3 shows the spectrum obtained by Puget et
al. with and without the ionized gas correction.
3. Since at these
wavelengths the IPD contribution is small, an accurate IPD model is not
required. They assumed that the ISM emission at high Galactic latitude
and low H I column density is traced by H I, and that the submillimeter
emission correlated with H I can be represented by a single temperature
medium with a
2 emissivity
law. They also made a correction for infrared emission associated with
ionized gas not correlated with the H I, which significantly reduced
their residual at the shortest wavelengths (200-400
µm). Their residual maps had no significant gradients with
Galactic latitude or longitude.
Figure 3 shows the spectrum obtained by Puget et
al. with and without the ionized gas correction.
Fixsen et al. (1998) carried out a more extensive analysis of the FIRAS data, based on the final photometric reduction of those data. They subtracted the final FIRAS determination of the CMB (Fixsen et al. 1996) and the IPD contribution obtained by extrapolation of the model of Kelsall et al. (1998). They used three different methods to look for an isotropic residual distinct from the ISM. One method assumed that the ISM spectrum is the same in all directions but that the intensity is spatially varying. The second method assumed that the neutral and ionized phases of the ISM are traced by a combination of maps of H I 21-cm line emission and of C II [158 µm] line emission. The latter was mapped over the sky by FIRAS (Bennett et al. 1994). Each component, including a term proportional to the square of the H I intensity, was allowed to have a distinct spectrum. In the third method, they assumed that the submillimeter emission of the ISM is traced by a linear combination of the DIRBE ISM maps at 140 and 240 µm (Arendt et al. 1998), each term again having its own spectrum. Although each of these methods is subject to different systematic errors, the three methods yielded a consistent residual isotropic background, providing confidence that this is a robust determination of the submillimeter spectrum of the CIB. An analytic representation of the mean residual from these methods is given in Table 1, and the spectrum is plotted in Figure 3. The results are consistent with the DIRBE results at 140 and 240 µm of Hauser et al. (1998).
Lagache et al. (1999)
extended the study of the far-infrared emission of the Galaxy at high
Galactic latitude using FIRAS data, finding a component of the emission
not correlated with H I emission but which follows a cosecant (b)
law. They attributed this emission to the warm ionized medium in the
Galaxy and subtracted the infrared emission associated with this
component, as well as that correlated with H I, from the mean FIRAS
spectrum in low H I column density regions to obtain the spectrum of the
CIB longward of 200 µm. The result is consistent with that
of
Fixsen et al. (1998)
(Table 1, Figure
3). Lagache et al. also applied a similar correction to estimate the
CIB at 140 and 240 µm from DIRBE data in the Lockman Hole
region and concluded that the results were significantly lower than
those of
Hauser et al. (1998).
However, as shown in Table 1, the 240
µm CIB intensity is within
1 of the Hauser et
al. value, and the 140 µm value, which differs by less than
2, is no longer positive
by 3 and might best be
interpreted as providing an upper limit of 27 nW m-2
sr-1. The similarity between the results of these analyses is
not surprising because
Hauser et al. (1998)
had chosen fields for their best determination of the 140 and 240
µm CIB that were known to have low-infrared emission from
the ionized gas phase (less than 5 and 2 nW m-2
sr-1 at 140 and 240 µm, respectively) [see
Section 3.4.2 and
Arendt et al. (1998)].
Lagache et al. (2000)
extended the study of infrared emission from the warm ionized medium
using data from the Wisconsin
H Mapper (WHAM) Sky
Survey of
Reynolds et al. (1998).
They analyzed diffuse emission regions covering about 2% of the sky at
high Galactic latitude. Assuming a constant electron density so they
could relate emission measure to H+ column density, they
found a correlation of infrared emission at FIRAS resolution with a
linear combination of H I and H+ column density that was
marginally better than with H I alone. Their results suggest that
20%-30% of the far-infrared emission at high Galactic latitudes is
uncorrelated with H I gas. Their values for the CIB at submillimeter
wavelengths are consistent with those of
Fixsen et al. (1998),
Lagache et al. (1999).
Their revised 140 and 240 µm residuals based on DIRBE data
are higher than those of
Lagache et al. (1999)
and are essentially the same as those of
Hauser et al. (1998).
However, these residuals are positive by less than
3 because of the small
sky area analyzed and the uncertainties in the WHAM data and, thus, most
confidently provide upper limits (Table 1). They
obtained a significantly positive residual at 100 µm,
similar to that of
Hauser et al. (1998),
but did not demonstrate that this residual was isotropic.